. 2025 Jun 30:15:1561806.
doi: 10.3389/fcimb.2025.1561806. eCollection 2025.

CD8+ T cells promote tubule-interstitial damage in malaria-induced acute kidney injury

Affiliations

CD8+ T cells promote tubule-interstitial damage in malaria-induced acute kidney injury

Douglas Esteves Teixeira et al. Front Cell Infect Microbiol. .

Abstract

Introduction: Malaria acute kidney injury (MAKI) is associated with severe malaria and correlates with poor prognosis and death of patients infected with Plasmodium falciparum. The pathogenesis of MAKI is not completely understood but some hypotheses are well recognized. Host-parasite interactions lead to mechanical obstruction, disorders in the renal microcirculation, and immune-mediated glomerular injury. We investigated the influence of CD8⁺ T cells in the pathogenesis of malaria-induced renal disease.

Methods: To assess the role of T lymphocytes in MAKI pathogenesis, we used adoptive transfer; antibody-driven CD8+ T cells depletion and treatment with FYT720.

Results: The transference of total T cells isolated from malaria-infected donor mice into naive recipient animals reproduced kidney tubule-interstitial damage without affecting glomerular function. It was associated with increased accumulation of CD8+ T cells in the kidneys of recipient mice. The selective depletion of CD8+ T cells in infected animals resulted in protection from tubular injury, although glomerular alterations still occurred. Finally, we evaluated FTY720, an immunomodulatory drug that sequesters T cells in lymphoid organs and limits their migration, as a potential therapeutic strategy. Treatment with FTY720 prevented the development of proteinuria and the increase in the urine to creatinine ratio. Moreover, FTY720 reduced urinary γ-glutamyl transferase (γ-GT) levels, a marker of tubular injury, but did not alter plasma urea and creatinine, two markers of glomerular function.

Discussion: Our results add new knowledge demonstrating that CD8+ T cells have a specific role in tubule-interstitial injury pathology during MAKI.

Keywords: CD8+ T cells; Plasmodium; acute kidney injury; host defense; host-pathogen interaction; malaria; tubule-interstitial injury.


Conflict of interest statement

The authors declare that the research was conducted in the absence of any commercial or financial relationships that could be construed as a potential conflict of interest.

Figures

Figure 1
Figure 1
Malaria-responsive T cells migrate to target organs. (A) Schematic representation of experimental design. Donor animals were infected 5 days before adoptive transfer. T cells from the donors’ spleens were enriched in wool columns and transferred to naive acceptor animals, generating two groups: acceptors that received T cells from uninfected donors (Naive → Naive); acceptors that received T cells from infected donors (Infected → Naive). On the third day after adoptive transfer, T cell migration was analyzed, and renal function was assessed. (B) Parasitemia was observed only in donor infected mice (gray bar) (n = 6–8). (C) Migration of malaria-responsive T cells to the kidney by CD3+/CFSE + cells (n = 4). (D) To confirm migration to the kidney, C57BL/6-GFP animals, infected or not, were used as donors to perform adoptive transfer (n = 6). Migration is expressed as the percentage of CD3+/CFSE+ or CD3+/GFP+ cells relative to the total CD3+ cells in the organ of interest. *versus naive → naive group, P < 0.05.
Figure 2
Figure 2
Malaria-responsive T cells induce tubule-interstitial injury. Quantification of urine protein excretion by (A) total proteinuria measured in 24h (n = 7) and (B) UPCr (n = 7). (C) Representative immunoblotting of urinary albumin and β2M (n = 3). (D, E) Representative immunoblotting of cortical KIM-1 and quantification of KIM-1 expression. GPDH was used as load control (n=4). (F) urinary γ-GT activity (n = 7). Urinary β2M, urinary γ-GT activity and cortical KIM-1 expression were used as tubular injury markers. The glomerular function was assessed using (G) plasma creatinine (n = 6), plasma urea (n = 6–7), and (H) creatinine clearance (n = 6). *versus naive → naive group, P < 0.05.
Figure 3
Figure 3
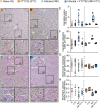
Malaria-responsive T cells induce tubular morphofunctional changes without significant glomerular effects. (A, B) Representative images of periodic acid-Schiff (PAS)-stained cortical slices showing the tubular and glomerular regions. Panels a1 and b1 display magnified views of the interstitial region, while a2 and b2 show magnified views of the glomeruli. (scale bar, 150 μm, n = 5). (C) Interstitial space and (D) interstitial cellularity. (E) Bowman’s capsule space and (F) glomerular cellularity. The dispersion plots in graphs (C-F) (on the left) represent the number of fields analyzed in the tubular and glomerular regions, while the box plots (on the right) show the mean values derived from the different fields for each animal (n = 4). Statistics were performed based on the average value of each animal analyzed. *versus naive → naive group, P < 0.05.
Figure 4
Figure 4
Adoptive transfer of malaria-responsive T cells induces an increase in CD8+ T cells population in renal tissue. (A) Dot-plot representing the percentage of CD4 and CD8+ T cells in total CD45+ renal cells of the naive → naive (orange) and infected → naive (blue) groups. (B) Quantification of the percentage of CD4+ (n = 5) and (C) CD8+ T cells (n = 5) in the kidney. (D) Representative immunoblotting of cortical perforin-1 expression in renal tissue. (E) Quantification of perforin-1 expression in renal tissue (n = 4). *versus naive → naive group, P < 0.05.
Figure 5
Figure 5
Depletion of CD8+ T cells induces an increase in parasitemia but does not change the percentage of CD4 T cells. (A) Representative scheme of CD8+ T cell depletion. Animals were infected with 106 iRBCs and treated with anti-mouse CD8 antibody on the day 2 and 3 post infection. The analyses were performed on day 5. (B) Peripheral parasitemia was assessed daily (n = 4). (C) Histogram representing the percentage of CD4+ and CD8+ T cells in CD45+ cells of the spleen. (D) Quantification of the percentage of CD4+ and CD8+ T cells in spleen (n = 4). (E) Histogram representing the percentage of CD4+ and CD8+ T cells in CD45+ cells of the kidney. (F) Quantification of the percentage of CD4+ and CD8+ T cells in spleen (n = 4). *versus undepleted group, P < 0.05.
Figure 6
Figure 6
Depletion of CD8+ T cells protects against tubular injury induced by PbA infection. Quantification of urine protein excretion by (A) 24-h proteinuria and (B) UPCr in the undepleted and CD8 depleted groups (n = 4). (C) Analysis of γ-GT enzyme activity in urine samples (n = 4). (D) Representative image of the urinary excretion of albumin and β2M and quantification graph (n=3). (E) Quantification of plasma levels of creatinine and urea (n = 4). (F) Estimated glomerular filtration rate assessed by creatinine clearance (n = 4). Dashed line indicates the levels of the untreated naive group. *versus undepleted group, P < 0.05.
Figure 7
Figure 7
The gene expression profile of the MAKI model correlates with other models of kidney injury (A) Heatmap graph of RNAseq database of murine kidney injury models of: MAKI, rhabdomyolysis, endotoxemia and ischemia and reperfusion. The gene profile was selected based on genes involved in the function and differentiation of tubules and glomerulus, injury markers, cytotoxic response and inflammatory process. Correlation graph between MAKI and rhabdomyolysis (B), endotoxemia (C) and ischemia and reperfusion (D) model, based on data extracted from the RNAseq database used in (A) In all representations, genes were normalized between 0 and 1. For graphs B, C and D, the mean of the normalized values ​​of the control was subtracted by the test condition (Naive – Pcc, Control – Rhabdomyolysis, Control – LPS and Control – IRI). The Spearman r correlation coefficient and P value were calculated. P < 0.05 were considered significant.
Figure 8
Figure 8
FTY720 induces immunosuppression without affecting parasitemia. (A) Scheme for infection with PbA and treatment with FTY720. The animals were infected with 106 infected RBCs (iRBCs) on day 0 and treated from the day 1 to day 4 post infection with FTY720 at a concentration of 0.3 mg/mL/kg. (B) Peripheral parasitemia level on day 5 post infection (n = 7). (C) FACS analysis of blood CD4+ T cells (n = 4) and (D) blood CD8+ T cells (n = 4). *versus naive group, P < 0.05; versus infected group, P < 0.05.
Figure 9
Figure 9
FTY720 treatment ameliorates renal tubular injury but does not affect glomerular damage during PbA infection. Quantification of urine protein excretion by (A) 24h proteinuria (n = 6-8) and (B) UPCr (n = 6-8). Tubular injury was assessed by (C) γ-GT urinary activity (n = 6-8). (D) Representative immunoblotting of cortical KIM-1. GPDH was used as load control (n = 3). Representative immunoblotting of urinary albumin and β2M (n = 3). (E) Quantification of cortical KIM-1 expression, albumin and β2M urinary excretion. Glomerular function was assessed by (F) plasma urea (n = 4), (G) plasma creatinine (n = 4) and (H) creatinine clearance (n = 4). *versus naive group, P < 0.05; versus infected group, P < 0.05.
Figure 10
Figure 10
FTY720 improves tubular histomorphological parameters in PbA-infected animals. (A–D) Representative images of periodic acid-Schiff (PAS)-stained cortical slices of the tubular and glomerular region. Panels a1, b1, c1 and d1 display magnified views of the glomeruli, while a2, b2, c2 and d2 show magnified views of the interstitial region (scale bar, 150 μm, n = 4). (E) Graph of interstitial space quantification. (F) Graph of interstitial cellularity quantification. (G) Graph of glomerular cellularity quantification. (H) Graph of Bowman’s capsule space quantification. The dispersion plots in graphs (E–H) (on the left) represent the number of fields analyzed in the tubular and glomerular regions, while the box plots (on the right) show the mean values derived from the different fields for each animal (n = 4). Statistics were performed based on the average value of each animal analyzed. *versus naive group P < 0.05, versus Infected group P< 0.05.
Figure 11
Figure 11
FTY720 prevents collagen deposition in PbA-infected animals. (A–D) Representative images of picrosirius red-stained cortical slices of the tubular and glomerular region. (E) Graph of collagen deposition quantification. The dispersion plot (on the left) represents the number of fields analyzed in the tubular and glomerular regions, while the box plot (on the right) shows the mean values derived from the different fields for each animal (n = 4). Statistics were performed based on the average value of each animal. *versus Naïve group P < 0.05.

References

    1. Abreu T. P., Silva L. S., Takiya C. M., Souza M. C., Henriques M. G., Pinheiro A. A. S., et al. (2014). Mice Rescued from Severe Malaria Are Protected against Renal Injury during a Second Kidney Insult. PloS One 9, e93634. doi: 10.1371/journal.pone.0093634 - DOI - PMC - PubMed
    1. Baer A., Colon-Moran W., Bhattarai N. (2018). Characterization of the effects of immunomodulatory drug fingolimod (FTY720) on human T cell receptor signaling pathways. Sci. Rep. 8, 10910. doi: 10.1038/s41598-018-29355-0 - DOI - PMC - PubMed
    1. Barsoum R. S. (2000). Malarial acute renal failure. J. Am. Soc. Nephrol. 11, 2147–2154. doi: 10.1681/ASN.V11112147 - DOI - PubMed
    1. Batte A., Berrens Z., Murphy K., Mufumba I., Sarangam M. L., Hawkes M. T., et al. (2021). Malaria-associated acute kidney injury in african children: prevalence, pathophysiology, impact, and management challenges. Int. J. Nephrol. Renovasc Dis. Volume 14, 235–253. doi: 10.2147/IJNRD.S239157 - DOI - PMC - PubMed
    1. Brown D. D., Solomon S., Lerner D., Del Rio M. (2020). Malaria and acute kidney injury. Pediatr. Nephrol. 35, 603–608. doi: 10.1007/s00467-018-4191-0 - DOI - PubMed

MeSH terms

Substances