

Development of a Starvation Response-Based Model and Its Application in Prognostic Assessment of Liver Hepatocellular Carcinoma
- PMID: 40662145
- PMCID: PMC12259329
- DOI: 10.1155/mi/8828435
Development of a Starvation Response-Based Model and Its Application in Prognostic Assessment of Liver Hepatocellular Carcinoma
Abstract
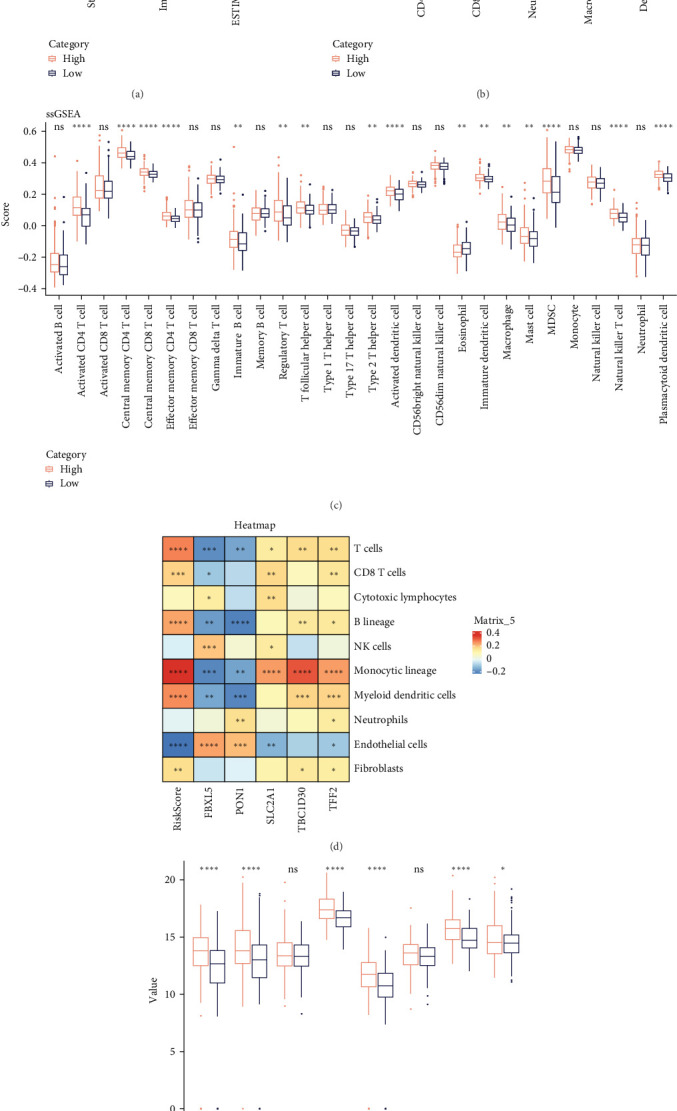
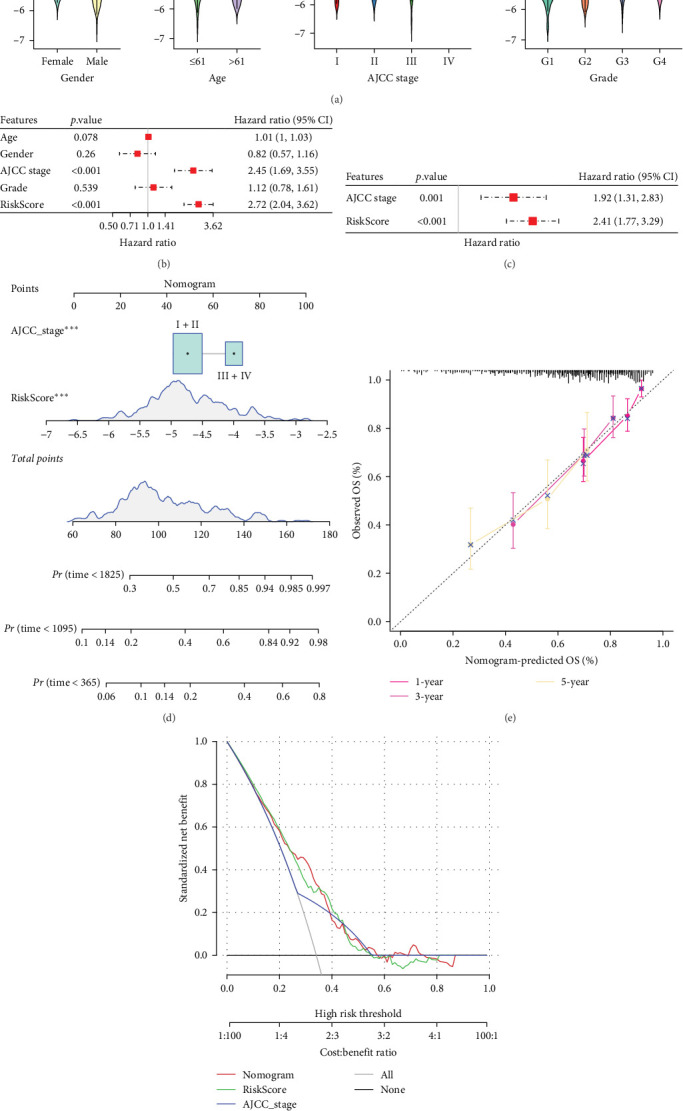
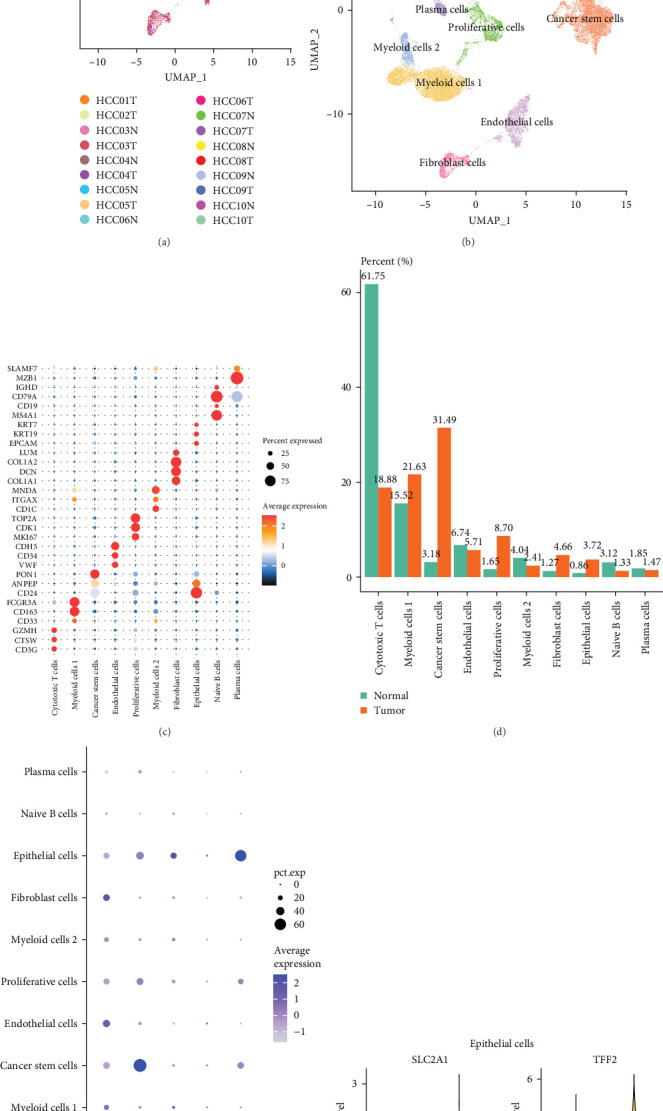
Background: Hepatocellular carcinoma (LIHC) is a highly prevalent and poorly prognostic malignancy worldwide, and nutrient deprivation in the tumor microenvironment activates the starvation response in tumor cells. Starvation response-related genes (SRRGs) play critical roles in maintaining energy metabolism and promoting tumor development, but their value in prognostic prediction of LIHC has not been clarified. Methods: We based on public databases to obtain transcriptome and single-cell RNA sequencing (scRNA-seq) data for LIHC and SRRG from previous studies. Key modules relevant to SRRGs were identified by weighted gene co-expression network analysis (WGCNA). Functional enrichment analysis was conducted using clusterProfiler R package. Independent prognostic genes were screened to build a RiskScore model and its performance was further verified. The immune microenvironmental profile of patients in different risk groups was assessed using the single-sample gene set enrichment analysis (ssGSEA), MCP-Counter, ESTIMATE, and TIMER algorithms. Seurat package for single-cell profiling and validation of key gene expression based on Huh7 and transformed human liver epithelial-2 (THLE-2) cell lines. The LIHC cell migration and invasion were measured by conducting wound healing and transwell assays. Results: The key module identified by WGCNA showed the strongest correlation with SRRGs and the glycolysis-related SRRGs were mainly enriched in metabolism-correlated pathways. Two protective genes (FBXL5 and PON1) and three risk genes (TFF2, TBC1D30, and SLC2A1) were discovered as the independent prognostic genes for LIHC. Activation of cytokine-cytokine receptor interaction and IL-17 signaling pathway and higher infiltration of immune cells in high-risk group was observed. The five independent prognostic genes were mainly expressed in cancer stem cells and epithelial cells, in particular, SLC2A1 and TFF2 were significantly high-expressed in epithelial cells in the tumor group than in nontumor group. FBXL5 and PON1 were downregulated, while TFF2, TBC1D30, and SLC2A1 were upregulated in LIHC cells. Silencing SLC2A1 significantly inhibited LIHC cell migration and invasion. Conclusion: In this study, we constructed the first risk model based on SRRGs to accurately predict the prognosis of LIHC, which provides a new idea for individualized treatment and targeted intervention.
Keywords: RiskScore model; glycolysis; liver hepatocellular carcinoma; prognosis; single-cell RNA sequencing; starvation response; transcriptome.
Copyright © 2025 Xinjun Hu et al. Mediators of Inflammation published by John Wiley & Sons Ltd.
Conflict of interest statement
The authors declare no conflicts of interest.
Figures


Similar articles
-
Identification of Biomarkers Based on Starvation Response-Related Genes for Assessing the Immune Profile and Prognosis in Lung Adenocarcinoma.Int J Genomics. 2025 Jul 11;2025:9950674. doi: 10.1155/ijog/9950674. eCollection 2025. Int J Genomics. 2025. PMID: 40686517 Free PMC article.
-
Mining of Targeted Therapeutic Drugs for Hepatocellular Carcinoma based on Programmed Death-related Features and Construction of an Imaging Histology Diagnostic Model.Curr Top Med Chem. 2025 Jul 8. doi: 10.2174/0115680266397340250701110954. Online ahead of print. Curr Top Med Chem. 2025. PMID: 40635214
-
Nuclear factor IA-mediated transcriptional regulation of crystallin αB inhibits hepatocellular carcinoma progression.Mol Clin Oncol. 2025 Jun 20;23(2):72. doi: 10.3892/mco.2025.2867. eCollection 2025 Aug. Mol Clin Oncol. 2025. PMID: 40599718 Free PMC article.
-
Systemic pharmacological treatments for chronic plaque psoriasis: a network meta-analysis.Cochrane Database Syst Rev. 2021 Apr 19;4(4):CD011535. doi: 10.1002/14651858.CD011535.pub4. Cochrane Database Syst Rev. 2021. Update in: Cochrane Database Syst Rev. 2022 May 23;5:CD011535. doi: 10.1002/14651858.CD011535.pub5. PMID: 33871055 Free PMC article. Updated.
-
Cost-effectiveness of using prognostic information to select women with breast cancer for adjuvant systemic therapy.Health Technol Assess. 2006 Sep;10(34):iii-iv, ix-xi, 1-204. doi: 10.3310/hta10340. Health Technol Assess. 2006. PMID: 16959170
References
-
- Torre L. A., Bray F., Siegel R. L., Ferlay J., Lortet-Tieulent J., Jemal A. Global Cancer Statistics,2012. CA: A Cancer Journal for Clinicians . 2015;65(2):87–108. - PubMed
MeSH terms
LinkOut - more resources
Full Text Sources
Medical
Miscellaneous
