

The Combination of Fat Distribution and BMI Redefines Obesity: Result From NHANES
- PMID: 40662213
- PMCID: PMC12260474
- DOI: 10.1002/jcsm.70013
The Combination of Fat Distribution and BMI Redefines Obesity: Result From NHANES
Abstract
Background: Body mass index (BMI) has well-recognized limitations, particularly in the context of the 'obesity paradox', where higher BMI does not consistently evaluate adverse outcomes. These limitations underscore the need for alternative approaches. This study aimed to redefine obesity using anthropometric indicators and to assess their prognostic value for mortality.
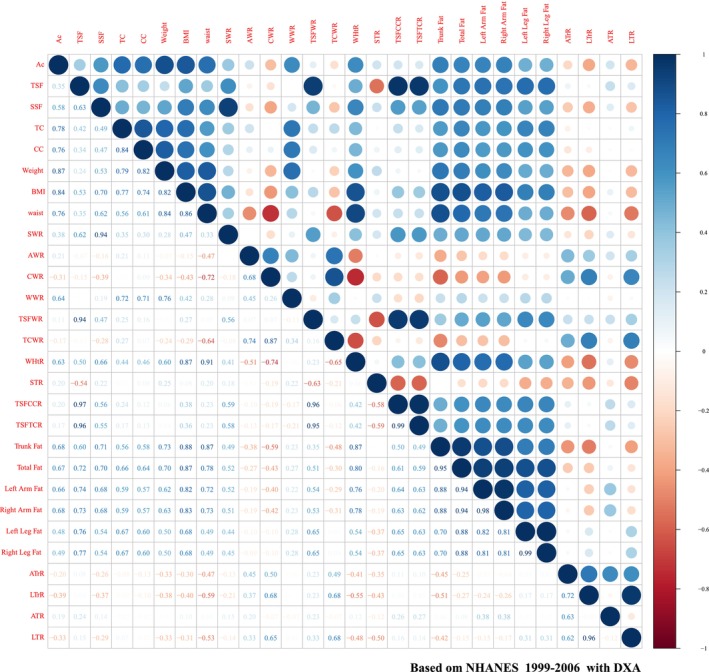
Methods: The original cohort included participants from the US National Health and Nutrition Examination Survey (NHANES) from 1999 to 2006. Additional dual-energy X-ray absorptiometry (DXA) data on fat distribution were sourced from NHANES 1999-2006 and 2011-2018. Ten fat distribution indicators were adopted to assess the fat distribution in the target population, including five centripetal obesity indicators, three global obesity indicators and two limb obesity indicators. All-cause, cardiovascular-specific and cancer-specific mortality outcomes were examined using weighted Cox proportional hazards models. Logistic regression was employed to evaluate associations between fat distribution indicators and the prevalence of specific diseases.
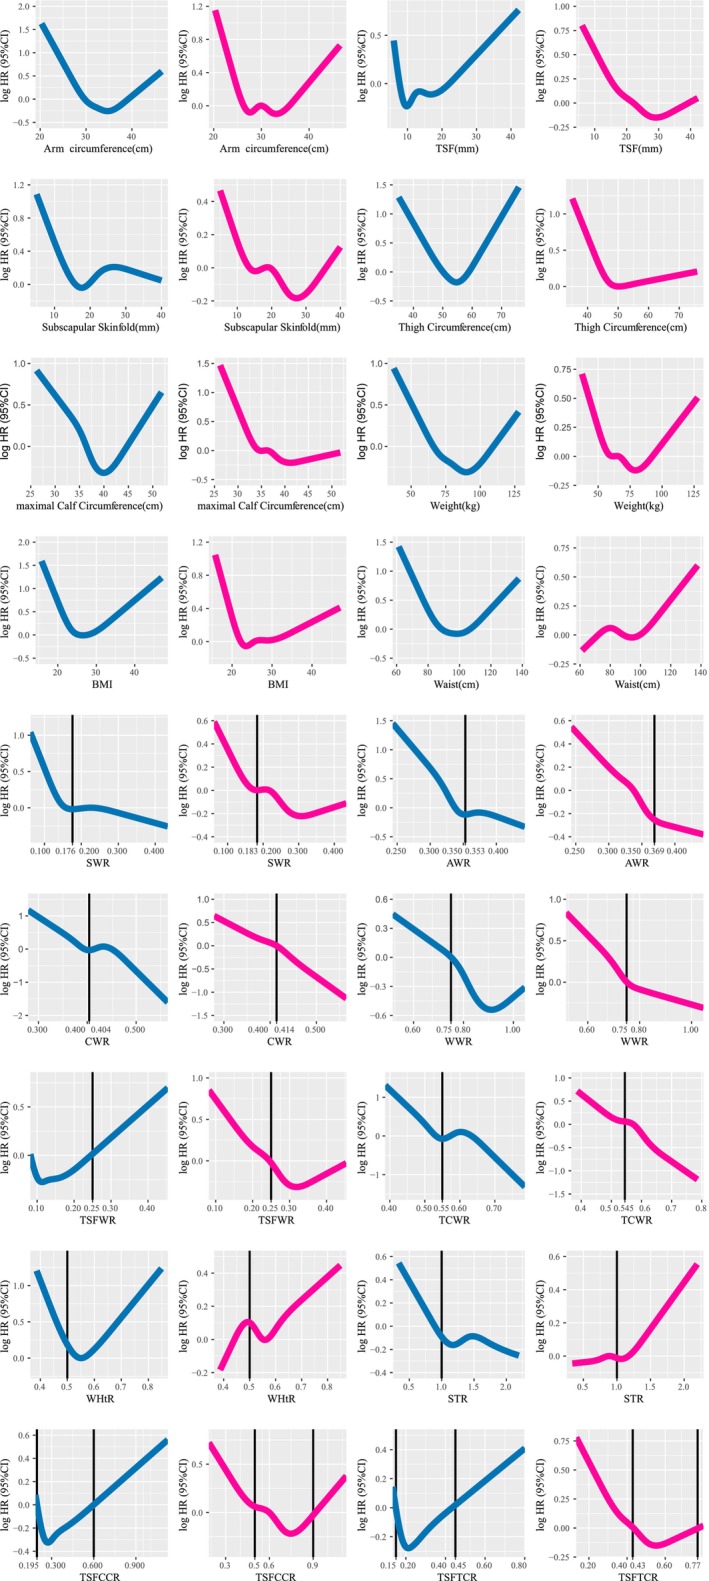
Results: This study included 14 936 participants (weighted 152 823 236 participants, mean age: 45.56 ± 17.60 years) and two DXA-assessed cohorts. Fat distribution indicators were correlated with various DXA-defined fat components. All 10 indicators demonstrated significant associations with mortality. Notably, the relationship between centripetal obesity indicators and all-cause mortality was approximately linear in both sexes. Centripetal obesity was also strongly associated with cardiovascular and cancer-specific mortality (p < 0.001). Although fat distribution indicators were significantly linked to the prevalence of cardiovascular disease (CVD), they showed no clear association with cancer incidence. Individuals with obesity but without centripetal fat accumulation exhibited a similar or slightly higher mortality risk compared with those with normal BMI and no centripetal obesity.
Conclusion: Centripetal obesity indicators emerged as the strongest independent evaluators of mortality, regardless of BMI classification. These findings highlight the clinical value of incorporating fat distribution metrics alongside BMI to more accurately assess obesity-related mortality risk.
Keywords: BMI; centripetal obesity; obesity.
© 2025 The Author(s). Journal of Cachexia, Sarcopenia and Muscle published by Wiley Periodicals LLC.
Conflict of interest statement
The authors declare no conflicts of interest.
Figures
References
-
- Gastelurrutia P., Lupón J., Domingo M., et al., “Usefulness of Body Mass Index to Characterize Nutritional Status in Patients With Heart Failure,” American Journal of Cardiology 108, no. 8 (2011): 1166–1170. - PubMed
-
- Gillum R. F., Mussolino M. E., and Madans J. H., “Body Fat Distribution, Obesity, Overweight and Stroke Incidence in Women and Men—The NHANES I Epidemiologic Follow‐Up Study,” International Journal of Obesity and Related Metabolic Disorders 25, no. 5 (2001): 628–638. - PubMed
MeSH terms
Grants and funding
LinkOut - more resources
Full Text Sources
Medical
