. 2025 Jul 15;135(14):e183749.
doi: 10.1172/JCI183749.

Sensory neuron-expressed FGF13 controls nociceptive signaling in diabetic neuropathy models

Affiliations

Sensory neuron-expressed FGF13 controls nociceptive signaling in diabetic neuropathy models

Aditya K Singh et al. J Clin Invest. .

Abstract

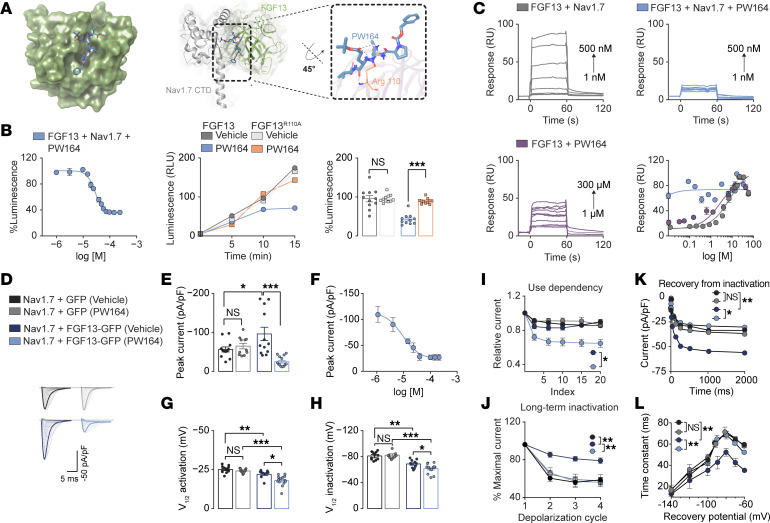
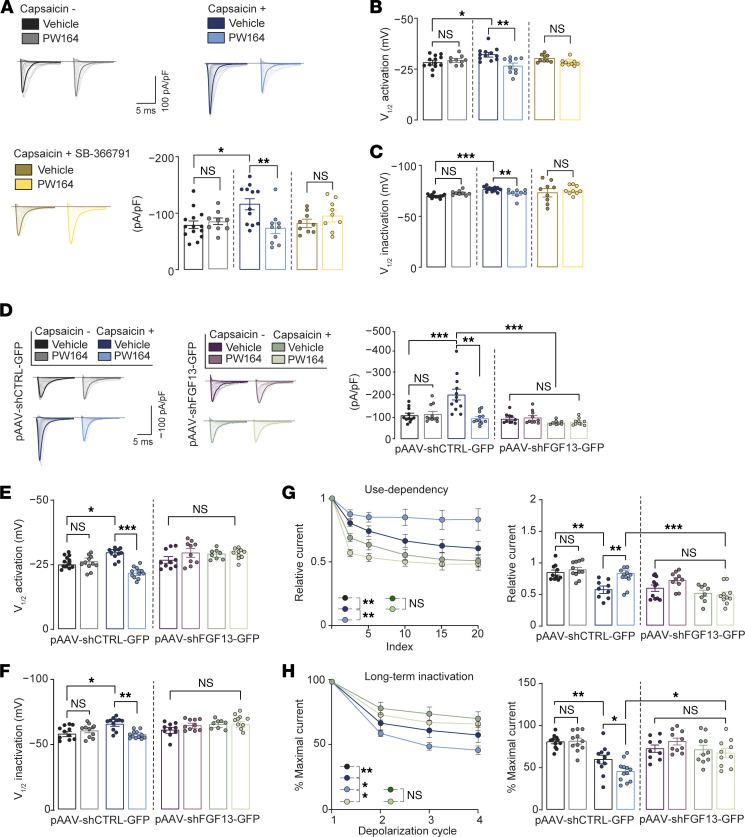
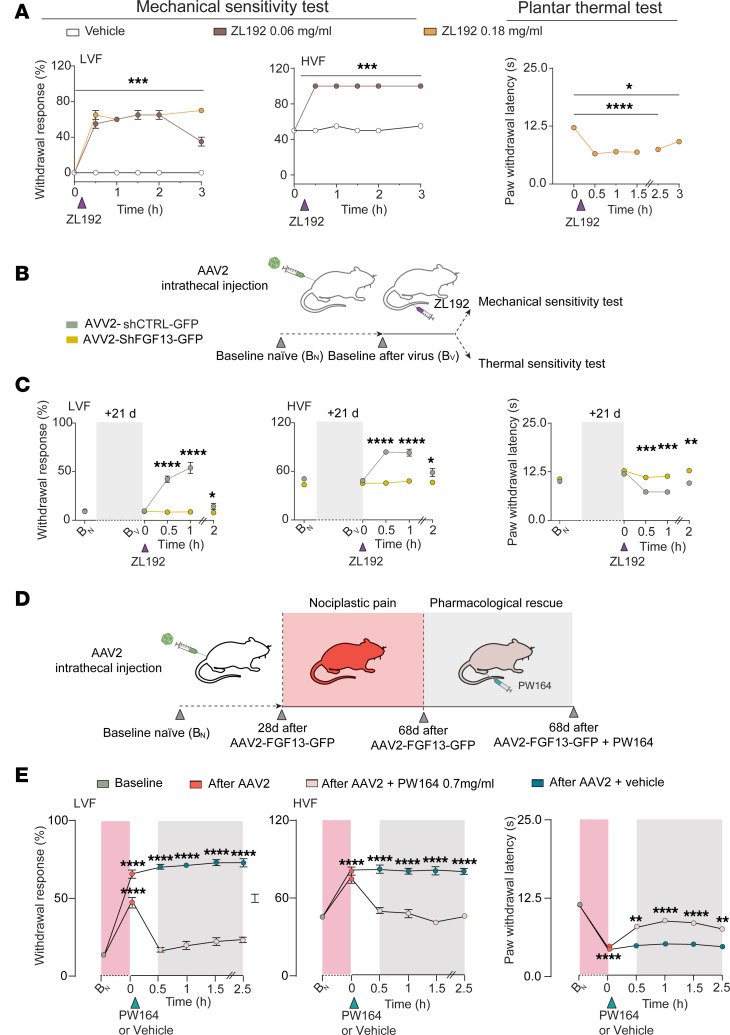
Nociception involves complex signaling, yet intrinsic mechanisms bidirectionally regulating this process remain unexplored. Here, we show that the fibroblast growth factor 13 (FGF13)/Nav1.7 protein-protein interaction (PPI) complex bidirectionally modulates nociception, and that the FGF13/Nav1.7 ratio is upregulated in type 2 diabetic neuropathy (T2DN). PW164, an FGF13/Nav1.7 channel C-terminal tail domain (CTD) PPI interface inhibitor, which reduces complex assembly, selectively suppressed Na+ currents sensitized by capsaicin-induced activation of TRPV1 channels in human induced pluripotent stem cell-derived (hIPSC-derived) sensory neurons and inhibited mechanical and thermal hyperalgesia in mice. FGF13 silencing mimics PW164 activity in culture and in vivo. Conversely, ZL192, an FGF13 ligand that stabilizes FGF13/Nav1.7 CTD assembly, sensitized Na+ currents in hIPSC-derived sensory neurons and exerted pronociceptive behavioral responses in mice. ZL192's effects were abrogated by FGF13 silencing in culture and in vivo and recapitulated by FGF13 overexpression. In a model of T2DN, PW164 injection reduced mechanical hyperalgesia locally and contralaterally without systemic side effects. In donor-derived dorsal root ganglia neurons, FGF13 and Nav1.7 proteins colocalized, and the FGF13/Nav1.7 protein ratio was upregulated in patients with T2DN. Lastly, we found that SCN9A variant V1831F, associated with painless diabetic neuropathy, abolished PW164-directed modulation of the FGF13/Nav1.7 PPI interface. Thus, FGF13 is a rheostat of nociception and promising therapeutic target for diabetic neuropathy pain.

Keywords: Neuroscience; Pain; Public Health; Sodium channels.


Figures

Figure 1
Figure 1. PW164 Inhibition of FGF13/Nav1.7 CTD complex formation selectively modulates Nav1.7 currents.
(A) PW164 docking on FGF13 surface and docked pose overlay with Nav1.7-CTD; H-bond in purple. (B) Percentage luminescence as function of PW164 log10 concentration in LCA produced by assembly of CLuc-FGF13/CD4-Nav1.7-CTD-NLuc complex or CLuc-FGF13R110A/CD4-Nav1.7-CTD-NLuc with vehicle or PW164 (20 μM). (C) Representative SPR sensograms and SSI saturation curves for respective groups. (D) Representative traces of INa recorded from HEK-Nav1.7 cells of indicated groups in response to depolarizing voltage steps. (E and F) Bar graph of peak INa density at voltage step –10 mV and dose response curve (IC50 = 6.74 ± 0.5 μM) (n = 11–14 cells/group). Scale bar 5 ms, 100 pA/pF. (G and H) V½ of voltage-dependence of activation and steady state inactivation (n = 9–17 cells/group). (I and J) INa amplitudes as a function of time (test pulse number referred to as index or depolarization cycle) in response to trains of variable depolarization protocols denoting use dependency (I) or long-term inactivation (J) of Nav1.7 (K and L) Time course (top) and time constants (bottom) of Nav1.7 repriming (recovery from inactivation) shown for indicated groups. Bottom panel denotes INa amplitudes in response to depolarizing pulses to allow channels entering long-term inactivation (n = 8–17 cells/group). Data are mean ± SEM; *P < 0.05, **P < 0.01, *** P < 0.001, 1-way ANOVA with post hoc Tukey’s multiple comparisons test. Student t test compared time constants in panel L.
Figure 2
Figure 2. FGF13 chemical inhibition or genetic silencing selectively suppress capsaicin-induced signaling in hIPSC-derived sensory neurons.
(A) Representative traces of INa in human RealDRG with indicated groups (n = 9–14 cells/group) and corresponding bar plots of peak INa density (B) V½ of voltage-dependence of activation. (C) V½ of steady state inactivation (right, n = 9–12 cells/group). (D) Representative traces of INa recorded in human RealDRG transfected with pAAV-CTRL-GFP or pAAV-shFGF13-GFP or from color-coded groups (n = 7–12 cells/group). (E) V½ of the voltage-dependence of activation. (F) V½ of voltage-dependent steady state inactivation (n = 7–12 cells/group). (G) Line and bar plots of use-dependent cumulative inactivation recorded at 10 Hz. (H) Percentage maximal current as a function of depolarization cycle denoting channel long-term inactivation (bottom, index; n = 8–10 cells/group). Data are mean ± SEM, *P < 0.05, **P < 0.01, *** P < 0.001, 1-way ANOVA with post hoc Tukey’s multiple comparisons test.
Figure 3
Figure 3. Inhibition of FGF13 exerts antinociceptive effects and mimics in vivo FGF13 knockdown.
(A) Paw withdrawal response at low (LVF) and high intensity (HVF) von Frey filament stimulation after intraplantar PW164 injection or bupivacaine (bup) (n = 3–4 mice/group). Paw withdrawal response to LVF and HVF stimulation with bup or PW164 30 minutes after capsaicin (cap); corresponding plots at 2 hours after capsaicin injection. (B) Time course of thermal radiant heat (Hargreaves) test showing paw withdrawal response (latency) in mice after intraplantar PW164 injection (0.7 mg/mL) alone or 30 minutes after capsaicin; n = 12/group. Green represents vehicle-only injection with capsaicin. (C) Experimental design showing lumbar intrathecal injection of viral particles and tests 21 days after viral injection (BV). Capsaicin and subsequent PW164 (0.7 mg/mL) injected locally in the same paw area 30 minutes apart. (D) Paw withdrawal response to LVF and HVF stimulation before and after local capsaicin injection followed by PW164 and corresponding bar graphs at 2 hours after PW164. (E) Plots corresponding to the same groups as D in response to thermal sensitivity test. Data are mean ± SEM; *P < 0.05, **P < 0.01, ***P < 0.001, ****P < 0.0001; 1-way ANOVA with post hoc Tukey’s or 2-way ANOVA with Šidák’s multiple comparisons test.
Figure 4
Figure 4. FGF13 activator ZL192 increases FGF13/Nav1.7 CTD complex formation and potentiates Nav1.7 currents.
(A) Docking of FGF13 positive modulator ZL192 on FGF13 surface and docked pose overlay with Nav1.7-CTD; H-bond is in purple. (B) Left, percentage luminescence as a function of log10 concentration of ZL192 in LCA produced by assembly of CLuc-FGF13/CD4-Nav1.7-CTD-NLuc. Center, percentage luminescence. Right, corresponding bar graph produced by assembly of CLuc-FGF13R110A/CD4-Nav1.7-CTD-NLuc or the CLuc-FGF13/CD4-Nav1.7M1830A-NLuc complex with either vehicle (0.5%) or ZL192 (50 μM). (C) Representative SPR sensograms and SSI saturation curves for respective groups. (D) Representative traces of INa recorded from HEK-Nav1.7 cells of indicated groups in response to depolarizing voltage steps, and bar graph of peak INa density at voltage step –10 mV (n = 11–12 cells/group; dose response EC50 = 8.5 ± 0.9 μM). (E and F) Bar graph of voltage dependence of activation and SSI inactivation for indicated groups (n = 11–12 cells/group). (G) Use dependency showing INa amplitudes as a function of time (test pulse number referred to as index) in response to a train of depolarizations presented at a frequency of 10 Hz. (H) INa amplitudes in response to depolarizing pulses representing LTI (n = 11–12 cells/group). (I and J) Time course (I) and time constants (J) of repriming (recovery from fast inactivation) of Nav1.7 channels in indicated groups. Data are mean ± SEM; *P < 0.05, **P < 0.01, ***P < 0.001, 1-way ANOVA with post hoc Tukey’s multiple comparisons test. Student t test compared time constants among groups in I and J.
Figure 5
Figure 5. ZL192 and FGF13 overexpression are sufficient to potentiate Na+ currents in hIPSC-derived sensory neurons without triggering stimuli.
(A) Representative traces of INa and peak INa density recorded from human RealDRG neurons in the color-coded groups (n = 7–16 cells/group). (B) Bar graphs represent V½ of activation and (C) SSI (right, n = 7–12 cells/group). (D) Line (left) and bar plots (right) representing use-dependent cumulative inactivation recorded at 10 Hz (left). (E) Line (left) and bar plots of long-term inactivation represented as percentage maximal current as a function of the depolarization cycle (right; n = 7–16 cells/group). Data are mean ± SEM, *P < 0.05, **P < 0.01, ***P < 0.001, ****P < 0.0001. One-way ANOVA with post hoc Tukey’s multiple comparisons test.
Figure 6
Figure 6. ZL192 exhibits pronociceptive roles that are prevented by in vivo FGF13 silencing and recapitulated in FGF13 overexpression.
(A) Paw withdrawal response to LVF and HVF stimulation before and after local ZL192 injection and corresponding experiments for thermal sensitivity in indicated groups. (B) Illustration of experimental design showing lumbar intrathecal injection of viral particles and tests before AAV injection (baseline naive, BN), or 21 days after viral injection (BV). (C) Frequency of paw withdrawal responses (in %) to LVF (left) and HVF (central) stimulation before and after ZL192 (0.18 mg/mL) intraplantar injection at different time points. Thermal sensitivity before and after ZL192 (0.18 mg/mL) intraplantar injection. (D) Experimental design showing lumbar intrathecal injection of viral particles, AAV2-FGF13-GFP or AAV2-GFP, in naive mice tested for mechanical and thermal responses from postinjection day 28 to day 68 and following intraplantar PW164 injection (0.7 mg/mL). (E) Data show development of mechanical (left and central) and thermal (right) chronic nociplastic hyperalgesia and its complete or partial pharmacological inhibition in response to intraplantar PW164 injection (0.7 mg/mL). In all groups unless noted, n = 12 mice/group were used except panel A (n = 4/group). Data are mean ± SEM, *P < 0.05 **P < 0.01, ***P < 0.001, ****P < 0.0001. One-way ANOVA with post hoc Tukey’s and/or 2-way ANOVA with Šidák’s multiple comparisons test.
Figure 7
Figure 7. PW164 reduces mechanical hyperalgesia in the HFD-induced T2DN mouse model.
(A) Body weights of mice fed a high fat diet (HFD) compared with standard chow diet (SD). (B) Glucose tolerance testing (GTT) performed at 13, 16, and 19 weeks. After measuring baseline fasting blood glucose levels, glucose (1 g/kg body weight) was injected i.p. and blood glucose measured at 15, 30, 60, and 120 minutes. For statistical analyses, AUC was calculated for each mouse. The mean ± SEM of each time point is shown. (C) Mice fed a HFD develop pain, shown as a decrease in the average 50% hindpaw withdrawal threshold upon von Frey stimulation of both hindpaws. (D) Experimental design showing intradermal PW164 injection (i.d.) (15 mg/kg) in the left paw. (E) Bar graph showing paw withdrawal response (both left and right paws) to von Frey stimulation before and after PW164 injection to left paw at 0 and 3 hours after PW164. (F) Bar graph showing paw withdrawal response (both left and right paws) to von Frey stimulation before and after vehicle (DMSO) injection to left paw at 0 and 3 hours. Animal groups were noted as (n = 4–9). Data are mean ± SEM, *P < 0.05, **P < 0.01, ***P < 0.001, Student t test.
Figure 8
Figure 8. Changes in FGF13/Nav1.7 complex formation correlate with diabetic neuropathy.
(A) Expression profile of FGF13 and SCN9A in molecularly defined neuronal subtypes, obtained from previous investigations of spatial transcriptomics in human dorsal root ganglia (47). (B) RNAscope-based expression pattern of FGF13 (red) and SCN9A (green) in donor-derived DRG neurons. The nuclear marker 4′,6-diamidino-2-phenylindole (DAPI) is shown in blue in the 3 panels on the left. A pie chart summarizes the percentage of neurons expressing each individual probe or pairs of probes. Quantification was done from 3 donors. Scale bars: 500 um (left); 50um (right top and bottom). (C) Representative confocal images from human nondiabetic (NDC) controls and patients with type-2 diabetic neuropathy (T2DN) DRG neurons stained with anti-FGF13 antibody (red), anti-Nav1.7 antibody (green), and peripherin (blue). To the right, summary bar graphs of mean and ratio fluorescence intensity for NDC versus T2DN. 21. White arrowheads indicate representative cells exhibiting FGF13/Nav1.7 colocalization. Scale bar: 50 μm. (D) Schematic illustration of SCN9A rare variants in the coding region of the Nav1.7 CTD found associated with neuropathies (top). ackFold model of the Nav1.7/FGF13 complex; the interaction with FGF13 occurs intracellularly. Close up showing the V1831F residue in direct interaction with the R110 residue on FGF13. R110 is a structural determinant of the FGF13/Nav1.7 CTD PPI interface. DDmut predicts the V1831F mutation to destabilize the FGF13/Nav1.7 complex ΔΔGStability = –1.75 kcal/mol. On the bottom right, LCA analysis of FGF13/Nav1.7 vs FGF13/Nav1.7 V1831F mutation does not alter complex assembly but prevents PW164’s pharmacological activity. Data are mean ± SEM, ns = not significant, *P < 0.05; **P < 0.01; ***P < 0.001, 1-way ANOVA post-hoc Tukey HSD (D); Mann Whitney test (C).

References

    1. Dubin AE, Patapoutian A. Nociceptors: the sensors of the pain pathway. J Clin Invest. 2010;120(11):3760–3772. doi: 10.1172/JCI42843. - DOI - PMC - PubMed
    1. Donnelly CR, et al. How do sensory neurons sense danger signals? Trends Neurosci. 2020;43(10):822–838. doi: 10.1016/j.tins.2020.07.008. - DOI - PMC - PubMed
    1. Goodwin G, McMahon SB. The physiological function of different voltage-gated sodium channels in pain. Nat Rev Neurosci. 2021;22(5):263–274. doi: 10.1038/s41583-021-00444-w. - DOI - PubMed
    1. Minett MS, et al. Distinct Nav1.7-dependent pain sensations require different sets of sensory and sympathetic neurons. Nat Commun. 2012;3:791. doi: 10.1038/ncomms1795. - DOI - PMC - PubMed
    1. Cox JJ, et al. An SCN9A channelopathy causes congenital inability to experience pain. Nature. 2006;444(7121):894–898. doi: 10.1038/nature05413. - DOI - PMC - PubMed

MeSH terms