. 2025 Jul 15;135(14):e190470.
doi: 10.1172/JCI190470.

HIF-1 promotes murine breast cancer brain metastasis by increasing production of integrin β3-containing extracellular vesicles

Affiliations

HIF-1 promotes murine breast cancer brain metastasis by increasing production of integrin β3-containing extracellular vesicles

Yongkang Yang et al. J Clin Invest. .

Abstract

Brain metastasis is a major cause of breast cancer (BC) mortality, but the cellular and molecular mechanisms have not been fully elucidated. BC cells must breach the blood-brain barrier in order to colonize the brain. Here, we determined that integrin β3 (ITGB3) expression mediated by hypoxia-inducible factor 1 (HIF-1) plays a critical role in metastasis of BC cells to the brain. Hypoxia stimulated BC cell migration and invasion ex vivo and brain colonization in vivo. Knockdown of either HIF-1α or ITGB3 expression impaired brain colonization by human or mouse BC cells injected into the cardiac left ventricle. Exposure of BC cells to hypoxia increased expression of ITGB3 and its incorporation into small extracellular vesicles (EVs). EVs harvested from the conditioned medium of hypoxic BC cells showed increased retention in the brain after intracardiac injection that was HIF-1α and ITGB3 dependent. EVs from hypoxic BC cells showed binding to brain endothelial cells (ECs), leading to increased EC-BC cell interaction, increased vascular endothelial growth factor receptor 2 signaling, increased EC permeability, and increased transendothelial migration of BC cells. Taken together, our studies implicate HIF-1-stimulated production of ITGB3+ EVs as a key mechanism by which hypoxia promotes BC brain metastasis.

Keywords: Breast cancer; Hypoxia; Oncology; Vascular biology.


Conflict of interest statement

Conflict of interest: GLS is a cofounder of and holds equity in HIF Therapeutics Inc. This arrangement has been reviewed and approved by Johns Hopkins University in accordance with its conflict-of-interest policies.

Figures

Figure 1
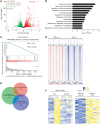
Figure 1. Identification of HIF target genes in brain-metastatic BC cells by RNA-Seq and ChIP-Seq.
(A and B) RNA-Seq analysis of MDA231-BrM2 cells exposed to 20% or 1% O2 for 24 hours was performed. Volcano plot (A) and Gene Ontology (GO) analysis (B) of HIF target genes are shown. (C) Gene set enrichment analysis (GSEA) revealed that expression of the “breast cancer metastasis” gene set was significantly correlated with the expression of HIF target genes in MDA231-BrM2 cells. (D) HIF-1α binding profiles at significantly called peak summits ± 1 kb in MDA231-BrM2 cells exposed to 20% or 1% O2, as determined by ChIP-Seq. (E) Venn analysis shows the overlap among 2,234 HIF-dependent hypoxia-induced genes as determined by RNA-Seq; 1,474 genes with HIF-1α binding sites by ChIP-Seq; and 1,957 genes overexpressed in MDA231-BrM2 cells, as compared with MDA231 cells (from ref. 16). (F) Heatmaps showing RNA expression of 44 shared genes in NTC versus HIF-double-knockdown cells at 20% or 1% O2 (left), and in MDA231 versus MDA231-BrM2 cells at 20% O2 (right).
Figure 2
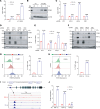
Figure 2. ITGB3 is a direct HIF-1 target gene.
(A and B) ITGB3 mRNA and protein were analyzed by RT-qPCR (A) and immunoblot assays (B) in 4T1 and 4T1-BR5 cells exposed to 20% or 1% O2. ITGB3 mRNA was quantified relative to 18S rRNA and normalized to mean for 4T1 cells at 20% O2; mean ± SD (n = 3). ****P < 0.0001 vs. 4T1 at 20% O2; ####P < 0.0001 vs. 4T1 at 1% O2 (unpaired 2-tailed Student’s t test). (CF) 4T1-BR5 (C and D) or MDA231-BrM2 (E and F) subclones were exposed to 20% or 1% O2, and ITGB3 mRNA or protein levels were analyzed by RT-qPCR (C and E) and immunoblot assays (D and F); mean ± SD (n = 3). ****P < 0.0001 vs. NTC at 20% O2; ####P < 0.0001 vs. NTC at 1% O2 (2-way ANOVA with Tukey’s multiple-comparison test). (G and H) Flow cytometry histograms showing anti-ITGB3 antibody binding to 4T1-BR5 (G) or MDA231-BrM2 (H) cells that were exposed to 20% or 1% O2; mean ± SD (n = 3). ****P < 0.0001 vs. 20% O2. (I) ChIP-Seq analysis revealed 3 matches to the HIF consensus binding site 5′-(A/G)CGTG-3′ or its complement (underlined) under the HIF-1α peak in the ITGB3 gene in MDA231-BrM2 cells using the Integrative Genomics Viewer (IGV) genome browser. (J) MDA231-BrM2 cells were exposed to 20% or 1% O2, and ChIP-qPCR was performed using antibodies against HIF-1α, HIF-1β, or HIF-2α. Primers flanking the nucleotide sequence shown in I were used for qPCR, and results were normalized to the mean result at 20% O2; mean ± SD (n = 3). ****P < 0.0001 vs. 20% O2; ns, not significant (unpaired 2-tailed Student’s t test).
Figure 3
Figure 3. ITGB3 expression is required for hypoxia-induced migration and invasion of brain-metastatic BC cells.
(AD) 4T1-BR5 subclones that were stably transduced with a lentivirus encoding an NTC shRNA or shRNA targeting ITGB3 or ITGAV were subjected to RT-qPCR (A and C) or immunoblot assays (B and D). Data are shown as mean ± SD (n = 3). **P < 0.01, ***P < 0.001, ****P < 0.0001 vs. shNTC; ns, not significant vs. shNTC (unpaired 2-tailed Student’s t test). (EH) 4T1-BR5 subclones were seeded on top of uncoated (E and F) or Matrigel-coated (G and H) Boyden chamber inserts and incubated at 20% or 1% O2 for 16 (E and F) or 24 (G and H) hours. Cells on the underside of the insert were stained with crystal violet and imaged by light microscopy (E and G; scale bars: 100 μm). The stained area was quantified using ImageJ (NIH) and expressed as mean ± SD (n = 3). **P < 0.01, ***P < 0.001, ****P < 0.0001 vs. shNTC at 20% O2; ####P < 0.0001 vs. shNTC at 1% O2 (2-way ANOVA with Tukey’s multiple-comparison test).
Figure 4
Figure 4. Pharmacological inhibition of HIF-1 or ITGB3 impairs migration and invasion of brain-metastatic BC cells.
(A) MDA231-BrM2 cells were exposed to 20% or 1% O2 for 24 hours in the presence of vehicle (DMSO) or digoxin, and expression of CA9, ITGB3, and RPL13A mRNA was assayed by RT-qPCR. Data are shown as mean ± SD (n = 3). ****P < 0.0001 vs. DMSO at 20% O2; ####P < 0.0001 vs. DMSO at 1% O2; ns, not significant (2-way ANOVA with Tukey’s multiple-comparison test). (BE) MDA231-BrM2 cells were seeded on top of uncoated (B and C) or Matrigel-coated (D and E) Boyden chamber inserts and incubated at 20% or 1% O2 in the presence of DMSO, digoxin (200 nM), or cilengitide (5 μM). Cells on the underside of the insert were stained with crystal violet and imaged by light microscopy (B and D; scale bars: 100 μm). The stained area was quantified using ImageJ and expressed as mean ± SD (n = 3). *P < 0.05, **P < 0.01, ****P < 0.0001 vs. 20% O2 DMSO; ####P < 0.0001 vs. 1% O2 DMSO; ns, not significant (2-way ANOVA with Tukey’s multiple-comparison test).
Figure 5
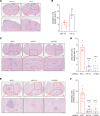
Figure 5. HIF-1–induced ITGB3 expression is required for colonization of brain by BC cells.
(A and B) 4T1-BR5 cells were exposed to 20% or 1% O2 for 48 hours and injected into left ventricle of BALB/c mice. On day 14, brains were harvested, and sections were analyzed by H&E staining. Representative images (A; scale bars: 200 and 50 μm in top and bottom panels, respectively) and quantification of metastatic area (B; mean ± SD; n = 5 mice, 3 sections per brain) are shown. **P < 0.01 vs. 20% O2 (unpaired 2-tailed Student’s t test). (C and D) Representative images of H&E-stained brain sections (C; scale bars: 200 and 50 μm in top and bottom panels, respectively) and quantification of metastatic area (D; mean ± SD; n = 5 mice, 3 sections per brain) 14 days after intracardiac injection of 4T1-BR5 subclones expressing the indicated shRNA are shown. ***P < 0.001, ****P < 0.0001 vs. shNTC (1-way ANOVA with Tukey’s multiple-comparison test). (E and F) Representative images of H&E-stained brain sections (E; scale bars: 200 and 50 μm in top and bottom panels, respectively) and quantification of metastatic area (F; mean ± SD; n = 8 mice, 3 sections per brain) 40 days after intracardiac injection of MDA231-BrM2 subclones expressing the indicated shRNA are shown. ****P < 0.0001 vs. shNTC (1-way ANOVA with Tukey’s multiple-comparison test).
Figure 6
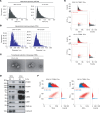
Figure 6. ITGB3 is exported from BC cells via EVs.
(A and B) MDA231-BrM2 cells were exposed to 20% or 1% O2 for 48 hours, and EVs were isolated and characterized by nano–flow cytometry (A) and nanoparticle tracking analysis (B). (C) Representative transmission electron microscopy images of EVs derived from MDA231-BrM2 cells are shown. Scale bars: 100 nm. (D) EVs and corresponding whole-cell lysates were characterized by immunoblot assays. (E and F) EVs derived from MDA231-BrM2 cells were stained with antibody against ITGB3 (E) or ITGB4 (F) and analyzed by nano–flow cytometry. Blue, unstained; red, antibody-stained; black, total particle population.
Figure 7
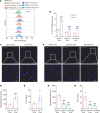
Figure 7. HIF-1α expression and ITGB3 expression promote the interaction of EVs with brain ECs.
(A and B) GFP+ PalmGRET-EVs (2 μg; derived from MDA231-BrM2 cells exposed to 20% or 1% O2 for 48 hours) were incubated with hCMEC/D3 ECs for 24 hours, and then the cells were analyzed by flow cytometry (A) and quantified (B; mean ± SD, n = 3). ****P < 0.0001 vs. NTC at 20% O2; ####P < 0.0001 vs. NTC at 1% O2 (2-way ANOVA with Tukey’s multiple-comparison test). (CE) PalmGRET-EVs (10 μg; derived from MDA231-BrM2 cells exposed to 20% or 1% O2 for 48 hours) were injected into the left ventricle of BALB/c mice, and then the brains were analyzed by fluorescence microscopy and nanoluciferase assay. Representative fluorescence microscopy images (C; scale bars: 100 and 20 μm in top and bottom panels, respectively), quantification of fluorescent area (D), and nanoluciferase activity (E) are shown; mean ± SD (n = 5 mice, 3 sections per brain). **P < 0.01, ****P < 0.0001 vs. 20% O2 (unpaired 2-tailed Student’s t test). (FH) PalmGRET-EVs (10 μg; derived from MDA231-BrM2 subclones exposed to 1% O2 for 48 hours) were injected into the left ventricle of BALB/c mice, and then the brains were analyzed by fluorescence microscopy and nanoluciferase assay. Representative fluorescence microscopy images (F; scale bars: 100 and 20 μm in top and bottom panels, respectively), quantification of fluorescent area (G), and nanoluciferase activity (H) are shown; mean ± SD (n = 5 mice, 3 sections per brain). ***P < 0.001, ****P < 0.0001 vs. shNTC (1-way ANOVA with Tukey’s multiple-comparison test).
Figure 8
Figure 8. ITGB3+ EVs promote interaction of BC cells with ECs and increase endothelial permeability.
(AE) As shown in the schematic created with BioRender (biorender.com) (A), hCMEC/D3 ECs were seeded on 6-well plates, cultured to confluence, and treated for 24 hours with EVs from MDA231-BrM2 cells that were exposed to 20% or 1% O2 (B and C) or subclones that were exposed to 1% O2 (D and E). GFP+ MDA231-BrM2 cells were then added onto the hCMEC/D3 monolayer and incubated for 1 hour, and non-adherent cells were removed by washing with PBS. Adherent BC cells were imaged by fluorescence microscopy (B and D; scale bars: 10 μm) and quantified (C and E; mean ± SD, n = 3). *P < 0.05 or ***P < 0.001 vs. no EVs (C) or shNTC EVs (E); ##P < 0.01 vs. 20% O2 EVs (C) (by 1-way ANOVA with Tukey’s multiple-comparison test). (F) hCMEC/D3 ECs were seeded on Boyden chamber filters, cultured to confluence, and incubated with EVs from MDA231-BrM2 subclones for 24 hours. FITC-dextran was added to the upper chamber, and fluorescence in the lower chamber was measured 20 minutes later using a plate reader. Data are shown as mean ± SD (n = 3). ****P < 0.0001 vs. no EVs; ####P < 0.0001 vs. 20% O2 shNTC-EVs; &&&&P < 0.0001 vs. 1% O2 shNTC-EVs (2-way ANOVA followed by Tukey’s multiple-comparison test).
Figure 9
Figure 9. ITGB3+ EVs increase permeability of brain ECs by augmenting VEGFR2 signaling.
(A) hCMEC/D3 cells were incubated for 24 hours with or without EVs (isolated from MDA231-BrM2 cells exposed to 20% or 1% O2 for 48 hours), followed by stimulation with VEGFA165 for 30 minutes. Whole-cell lysates were prepared for immunoblot assays. (B) hCMEC/D3 cells were incubated for 24 hours with or without EVs (isolated from MDA231-BrM2 subclones that were exposed to 1% O2 for 48 hours), followed by stimulation with VEGFA165 for 30 minutes, and immunoblot assays were performed. (C and D) hCMEC/D3 cells were seeded into Boyden chamber inserts, cultured to confluence, and incubated with or without EVs from empty vector (Control) or ITGB3-overexpressing (ITGB3-OE) MDA231-BrM2 subclones in the presence of vehicle or 5 μM sunitinib for 24 hours. FITC-dextran was added to the upper chamber, and fluorescence in the lower chamber was measured 20 minutes later and presented as mean ± SD (n = 3). ns, not significant vs No EVs without sunitinib; **P < 0.01 vs. control EVs without sunitinib; ****P < 0.0001 vs. ITGB3-OE EVs without sunitinib (2-way ANOVA followed by Tukey’s multiple-comparison test). (E and F) A monolayer of hCMEC/D3 cells was incubated for 24 hours with EVs (isolated from MDA231-BrM2 subclones that were exposed to 20% or 1% O2 for 48 hours), and then MDA231-BrM2 cells were added. BC cells that transmigrated through the EC monolayer to the lower chamber were stained with crystal violet and imaged by light microscopy (E; scale bars: 100 μm). The area of stained cells was quantified using ImageJ (F; mean ± SD, n = 3). ***P < 0.001 vs. 20% O2/shNTC-EVs; ####P < 0.0001 vs. 1% O2/shNTC-EVs (2-way ANOVA followed by Tukey’s multiple-comparison test).
Figure 10
Figure 10. HIF-1–dependent expression of ITGB3 incorporated into EVs promotes BC brain metastasis.
Intratumoral hypoxia in primary breast tumors induces the HIF-1–mediated expression of integrin β3, which is incorporated into EVs as a heterodimer with integrin αv. These EVs are released into the circulation and augment VEGFR2 signaling in brain endothelial cells, which increases vascular permeability, facilitating breaching of the blood-brain barrier and brain colonization by metastatic BC cells. This diagram was created with BioRender (biorender.com).

References

    1. Siegel RL, et al. Cancer statistics, 2024. CA Cancer J Clin. 2024;74(1):12–49. doi: 10.3322/caac.21820. - DOI - PubMed
    1. Kim MM, et al. National Cancer Institute Collaborative Workshop on shaping the landscape of brain metastases research: challenges and recommended priorities. Lancet Oncol. 2023;24(8):e344–e354. doi: 10.1016/S1470-2045(23)00297-8. - DOI - PMC - PubMed
    1. Palmieri D, et al. Brain metastases of breast cancer. Breast Dis. 2006;26:139–147. doi: 10.3233/BD-2007-26112. - DOI - PubMed
    1. Weil RJ, et al. Breast cancer metastasis to the central nervous system. Am J Pathol. 2005;167(4):913–920. doi: 10.1016/S0002-9440(10)61180-7. - DOI - PMC - PubMed
    1. Wang Y et al. Breast cancer brain metastasis: insight into molecular mechanisms and therapeutic strategies. Br J Cancer. 2021;125(8):1056–1067. doi: 10.1038/s41416-021-01424-8. - DOI - PMC - PubMed

MeSH terms