. 2025 Jul 1;41(Supplement_1):i561-i570.
doi: 10.1093/bioinformatics/btaf180.

RVINN: a flexible modeling for inferring dynamic transcriptional and post-transcriptional regulation using physics-informed neural networks

Affiliations

RVINN: a flexible modeling for inferring dynamic transcriptional and post-transcriptional regulation using physics-informed neural networks

Osamu Muto et al. Bioinformatics. .

Abstract

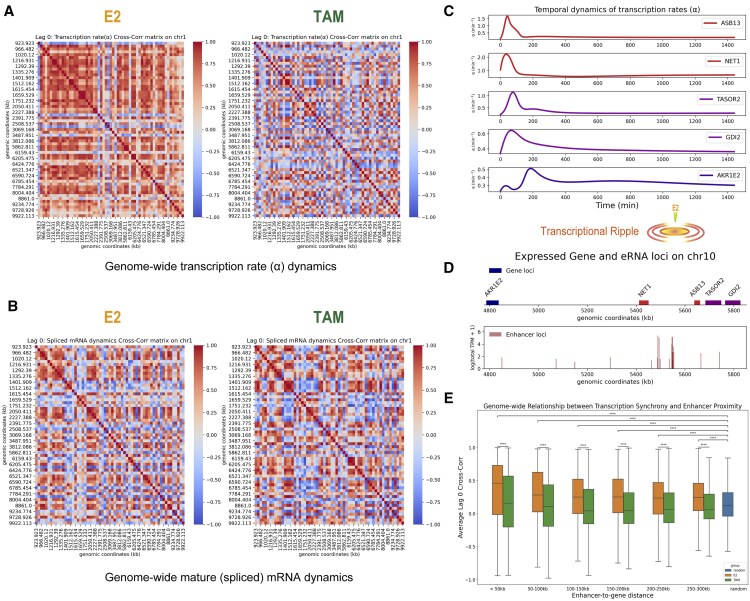
Summary: Dynamic gene expression is controlled by transcriptional and post-transcriptional regulation. Recent studies on transcriptional bursting and buffering have increasingly highlighted the dynamic gene regulatory mechanisms. However, direct measurement techniques still face various constraints and require complementary methodologies, which are both comprehensive and versatile. To address this issue, inference approaches based on transcriptome data and differential equation models representing the messenger RNA lifecycle have been proposed. However, the inference of complex dynamics under diverse experimental conditions and biological scenarios remains challenging. In this study, we developed a flexible modeling using physics-informed neural networks and demonstrated its performance using simulation and experimental data. Our model has the ability to computationally revalidate and visualize dynamic biological phenomena, such as transcriptional ripple, co-bursting, and buffering in a breast cancer cell line. Furthermore, our results suggest putative molecular mechanisms underlying these phenomena. We propose a novel approach for inferring transcriptional and post-transcriptional regulation and expect to offer valuable insights for experimental and systems biology.

Availability and implementation: https://github.com/omuto/RVINN.


Figures

Figure 1.
Figure 1.
Overview of the ODE model of the mRNA lifecycle (A) and the RVINN framework (B). In the ODE model, the dynamics of unspliced mRNA (U) are governed by the transcription rate (α) and splicing rate (β), while spliced mRNA (S) is modeled by the splicing rate (β) and degradation rate (γ). The RVINN framework models time-course gene expression data using neural networks, leveraging automatic differentiation (autodiff) to compute the ODE and Auxiliary loss.
Figure 2.
Figure 2.
Examples of time-course gene expression data simulated under the steady-to-steady scenario (A) and the oscillating scenario (B). Each dot represents an observed data (red for mature mRNA, blue for pre-mRNA), sampled at nine time points in triplicate with 30% noise. The x-axis is time (min), and the y-axis is mRNA abundance. a.u. indicates arbitrary units. Upper panels in (A) and (B) show time-course profiles from the trained data modules of RVINN (solid magenta or cyan lines) and INSPEcT (NF mode) with linear interpolation (solid gray lines). Lower panels in (A) and (B) show the time-course profiles of the estimated kinetic parameters by RVINN (dashed lines in color) and INSPEcT (NF mode; solid lines in color), compared with the ground truth. Legends for α and γ show the cross-correlation coefficient (lag 0), whereas the legend for β indicates the relative L1-error.
Figure 3.
Figure 3.
Genome-wide analysis of transcription dynamics under estradiol (E2) and tamoxifen (TAM) treatments. Cross-correlation matrices of transcription rate (A) and spliced mRNA (B) dynamics for genes on chromosome 1 (0–10 000 kb) under E2 (left) and TAM (right) treatments. Each symmetric matrix is indexed by gene start positions and represents the lag-0 cross-correlation between every pair of genes. Warmer colors indicate higher correlation. kb: kilobases. (C) Temporal delay in transcription rates on a genomic region containing expressed genes ASB13, NET1, TASOR2, GDI2, and AKR1E2 under E2 treatment. The plots highlight gene-specific differences in transcriptional activation over time. (D) Genomic coordinates of the expressed genes under E2 treatment and the MCF-7 enhancer RNA (eRNA) loci on chromosome 10. Red peaks in the bottom panel indicate eRNA expression in transcripts per million (TPM) obtained from FANTOM5 (Andersson et al. 2014). (E) Genome-wide analysis of transcriptional synchronicity and enhancer proximity. Box plots show average lag-0 cross-correlation coefficients for genes grouped by 50 kb binned genomic distance from the active enhancer regions. The active enhancer regions were defined by eRNA loci with log(total TPM + 1) >4.0. The box plots in orange, green, and blue represent the E2 treatment, TAM treatment, and randomly selected genes from outside the active enhancer regions in the E2 dataset, respectively. One-sided Mann–Whitney U-tests were performed on the average correlation coefficients. Asterisks indicate significant pairs based on adjusted P < .05 by the Benjamini–Hochberg (BH) method (****: adjusted P1.0×104). Pairs with no annotations were not tested.
Figure 4.
Figure 4.
RVINN visualizes the dynamic aspects of transcriptional buffering. (A, B) Temporal dynamics of spliced and unspliced mRNA levels (log2 Fold Change) for E2-specific (A) and TAM-specific (B) dynamically buffered genes. The upper and lower panels show the dynamics of spliced and unspliced mRNA, respectively. Each orange line represents E2-specific dynamically buffered genes, while each green line represents TAM-specific dynamically buffered genes. Other genes are represented in magenta and cyan. (C) Representative examples of E2-specific (AACS gene) and TAM-specific (CD2AP gene) dynamically buffered genes, showing temporal patterns where both transcription and degradation rates are upregulated (upper panel) and where both are downregulated (lower panel). (D) Enrichment analysis of RNA-binding protein (RBP) target genes for E2-specific and TAM-specific dynamically buffered genes. Buffered genes are categorized into “Up” and “Down” groups based on their transcription rate. We performed two-sided Fisher’s exact test to assess whether the known target genes of each expressed RBP are significantly enriched or depleted in each gene group. The viloin plot shows each RBP-target enrichment test with their adjusted P-values corrected by the BH method. The horizontal lines indicate the threshold for significance at an adjusted P-value of .05. For comparison, the same analysis was performed on random subsets of the non-buffered genes, sampled to match the number of E2-specific or TAM-specific dynamically buffered genes (“Not buffered-random genes” group). (E) Bar plot displaying each RBP whose target genes are significantly enriched in E2-specific dynamically buffered “Transcription Up” genes, ranked by odds ratio. (F, G) Similar to (E), these plots apply to TAM-specific dynamically buffered genes and are visualized for “Transcription Up” (F) and “Transcription Down” (G) cases.

References

    1. Altieri JAC, Hertel KJ. The influence of 4-thiouridine labeling on pre-mRNA splicing outcomes. PLoS One 2021;16:e0257503. 10.1371/journal.pone.0257503 - DOI - PMC - PubMed
    1. Andersson R, Gebhard C, Miguel-Escalada I et al. An atlas of active enhancers across human cell types and tissues. Nature 2014;507:455–61. 10.1038/nature12787 - DOI - PMC - PubMed
    1. Baran-Gale J, Purvis JE, Sethupathy P. An integrative transcriptomics approach identifies miR-503 as a candidate master regulator of the estrogen response in MCF-7 breast cancer cells. RNA 2016;22:1592–603. 10.1261/rna.056895.116 - DOI - PMC - PubMed
    1. Bastidas-Ponce A, Tritschler S, Dony L et al. Comprehensive single cell mRNA profiling reveals a detailed roadmap for pancreatic endocrinogenesis. Development 2019;146:dev173849. 10.1242/dev.173849 - DOI - PubMed
    1. Bergen V, Lange M, Peidli S et al. Generalizing RNA velocity to transient cell states through dynamical modeling. Nat Biotechnol 2020;38:1408–14. 10.1038/s41587-020-0591-3 - DOI - PubMed

LinkOut - more resources