. 2025 Jul 15:13:RP95324.
doi: 10.7554/eLife.95324.

EPHA4 signaling dysregulation links abnormal locomotion and the development of idiopathic scoliosis

Affiliations

EPHA4 signaling dysregulation links abnormal locomotion and the development of idiopathic scoliosis

Lianlei Wang et al. Elife. .

Abstract

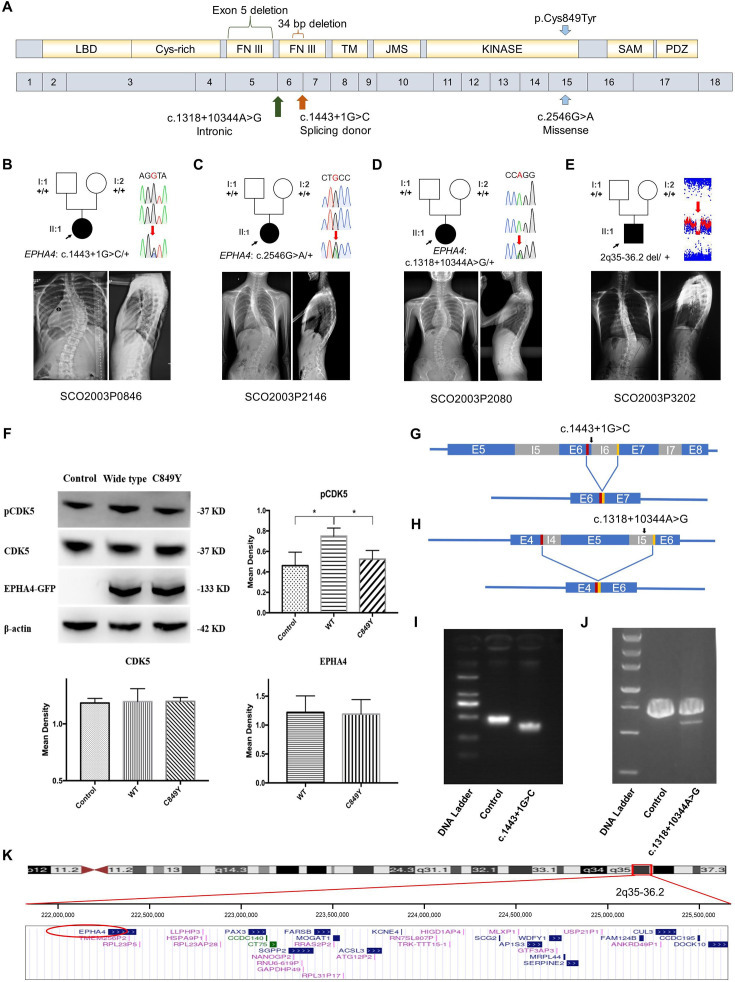
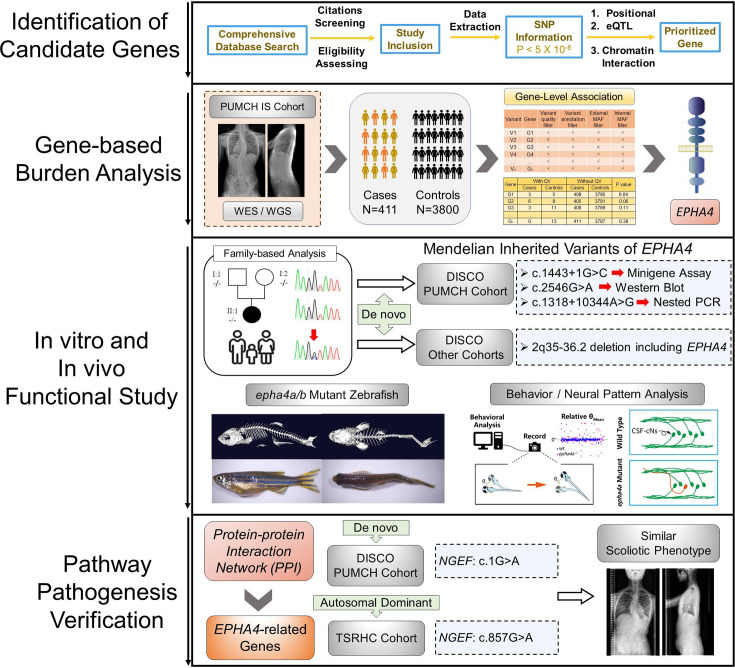
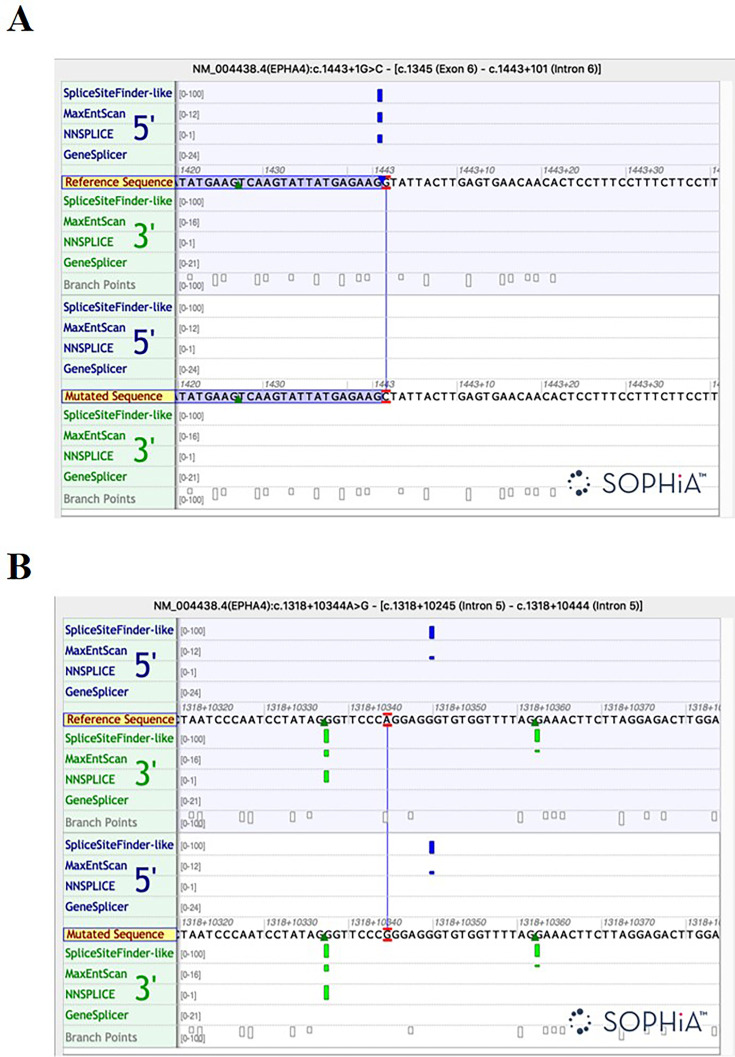
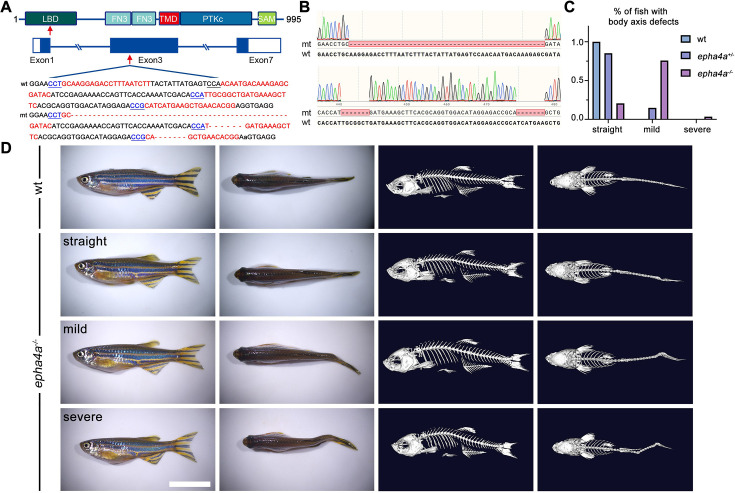
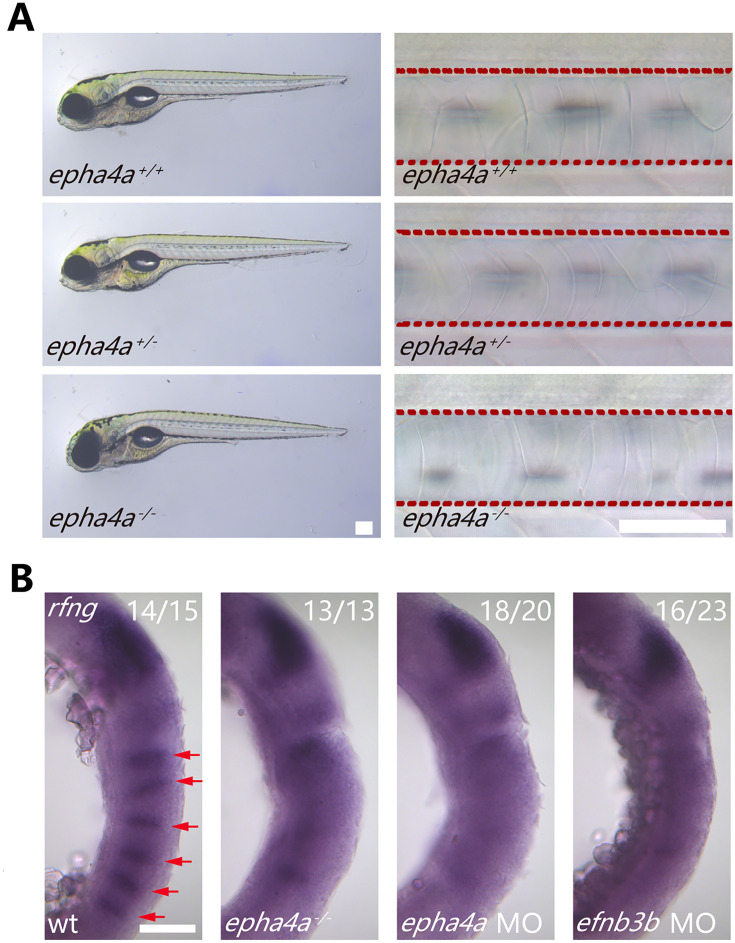
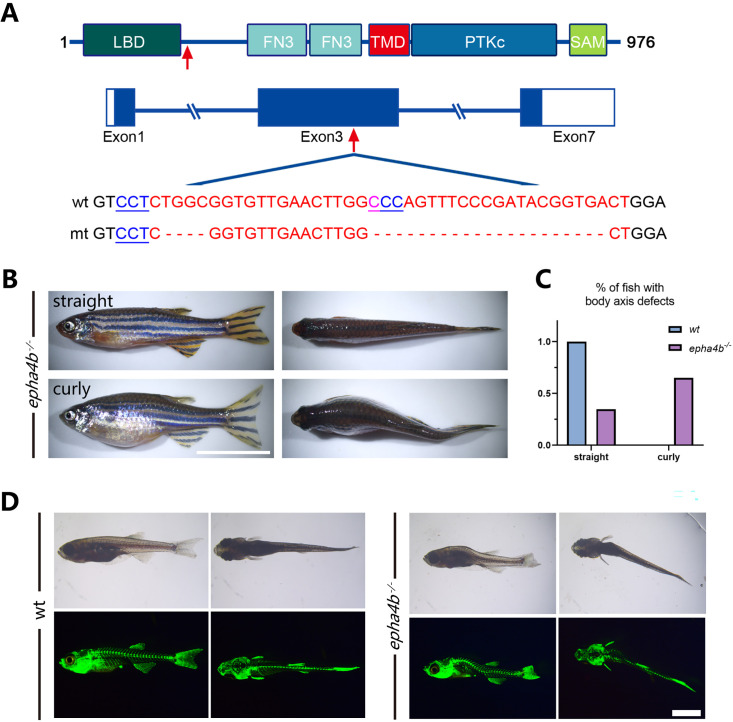
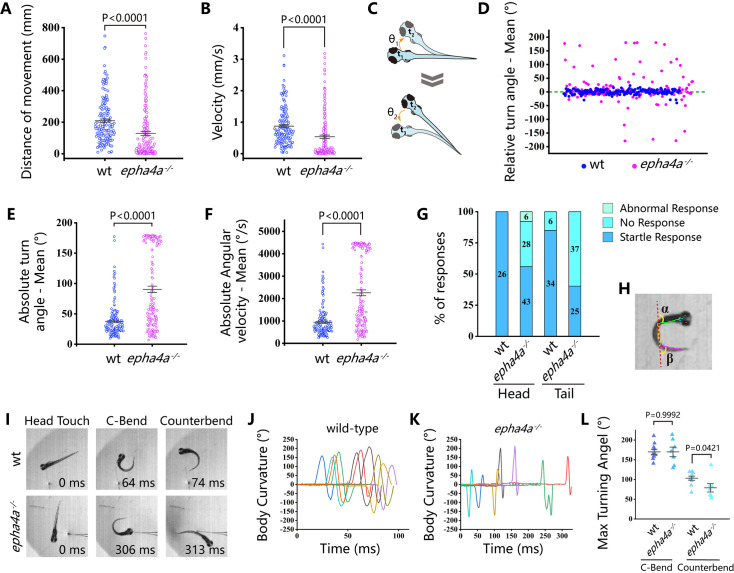
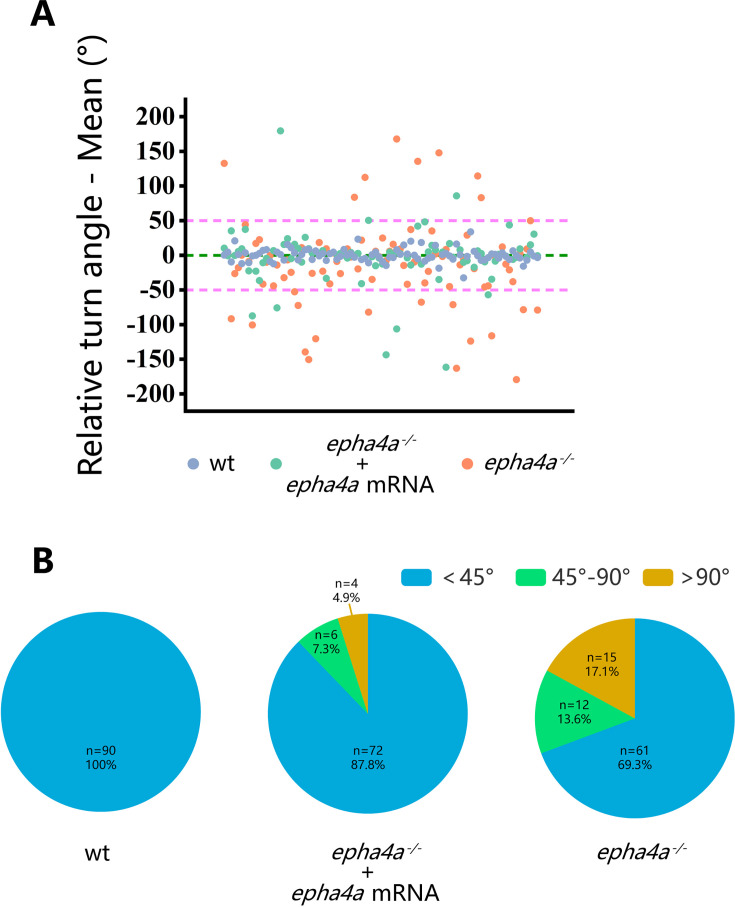
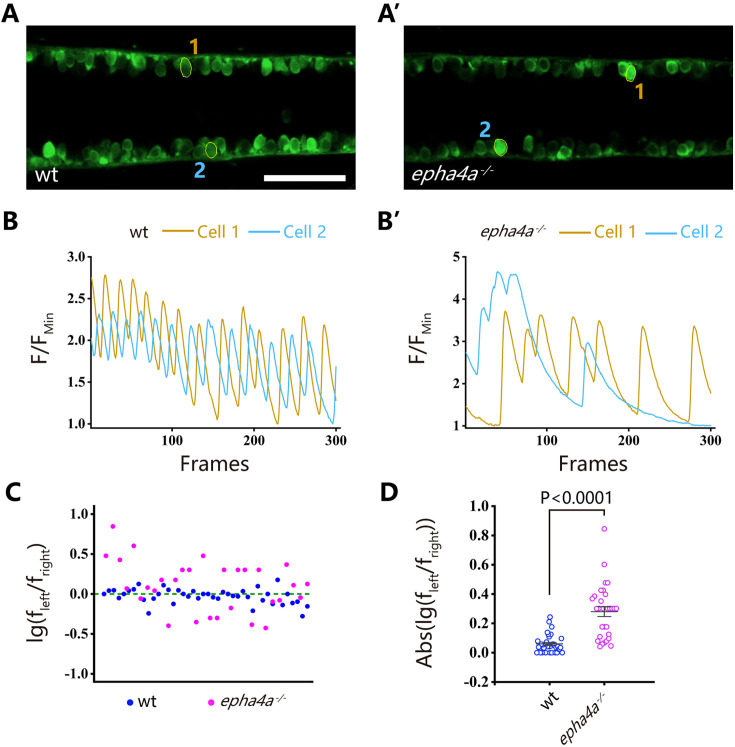
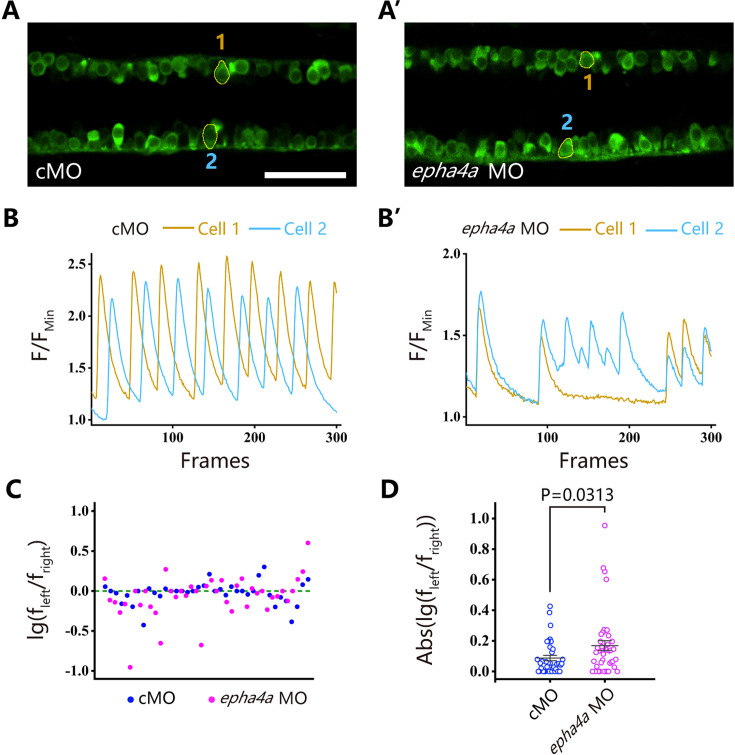
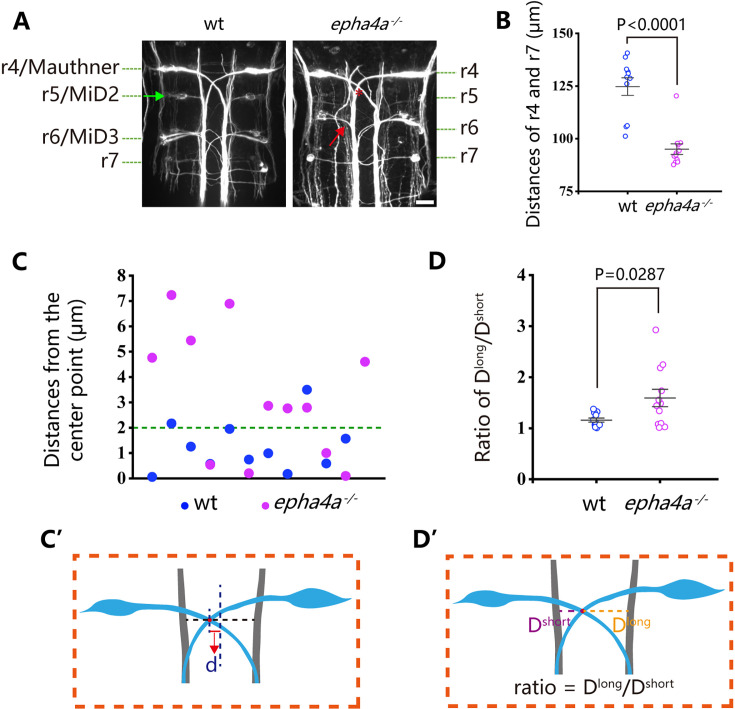
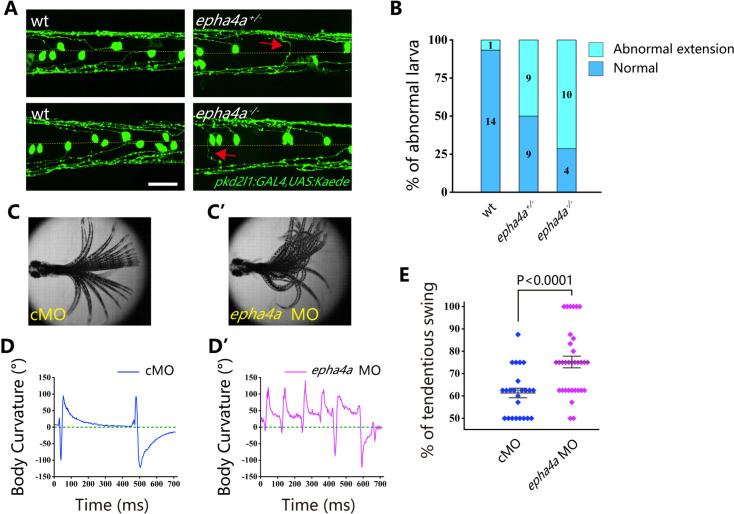
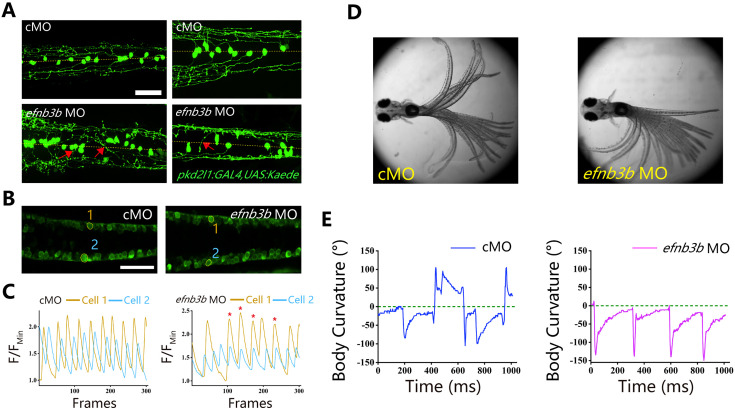
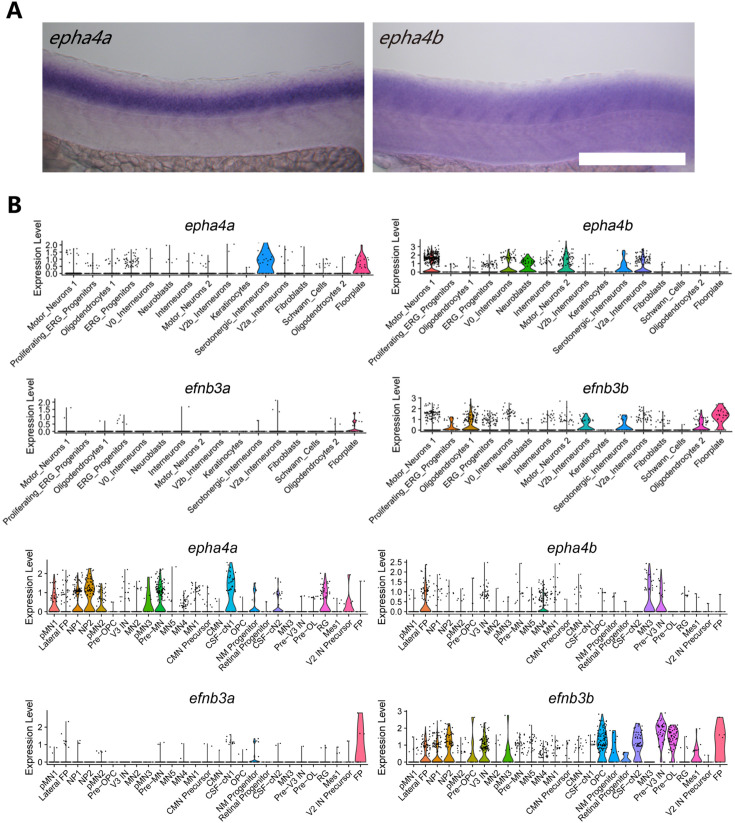
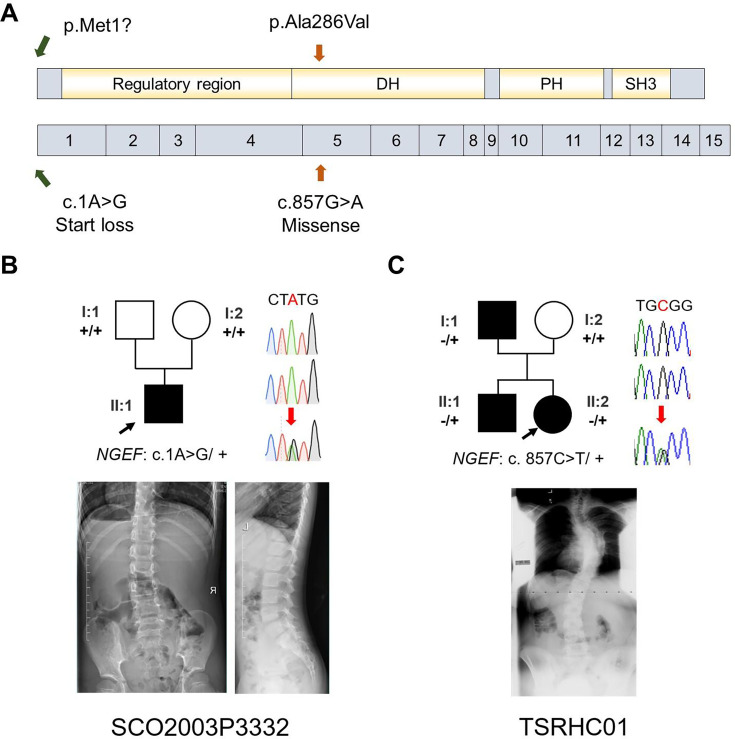
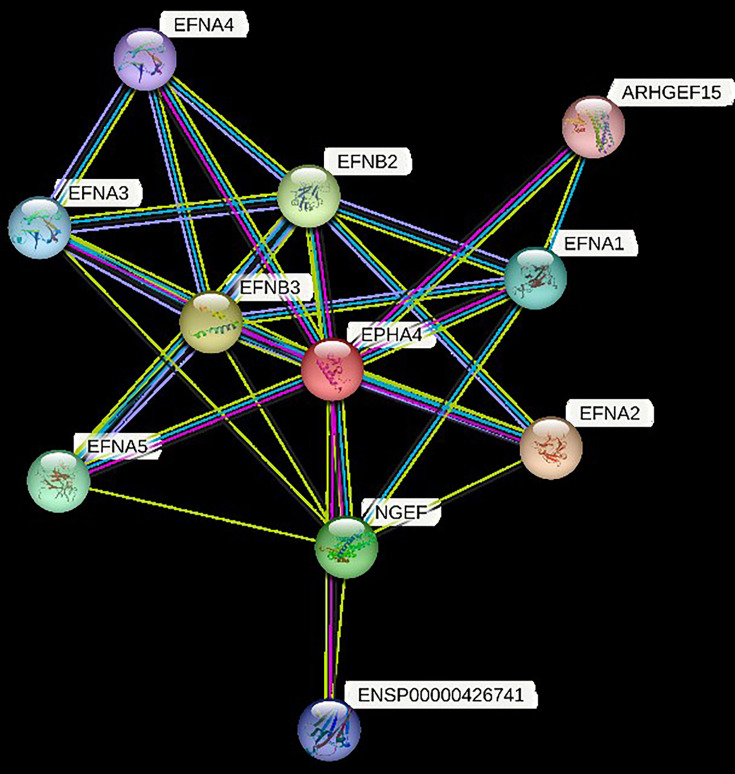
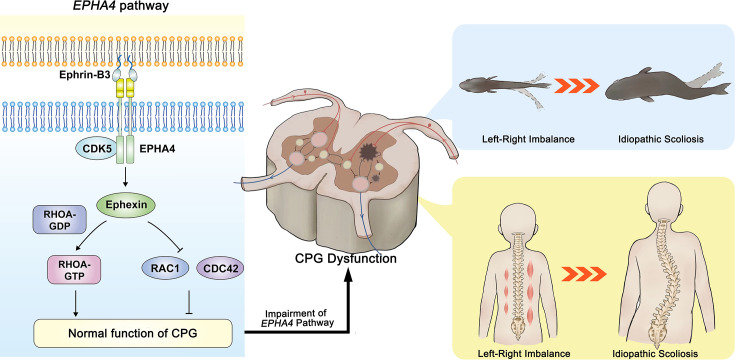
Idiopathic scoliosis (IS) is the most common form of spinal deformity with unclear pathogenesis. In this study, we first reanalyzed the loci associated with IS, drawing upon previous studies. Subsequently, we mapped these loci to candidate genes using either location-based or function-based strategies. To further substantiate our findings, we verified the enrichment of variants within these candidate genes across several large IS cohorts encompassing Chinese, East Asian, and European populations. Consequently, we identified variants in the EPHA4 gene as compelling candidates for IS. To confirm their pathogenicity, we generated zebrafish mutants of epha4a. Remarkably, the zebrafish epha4a mutants exhibited pronounced scoliosis during later stages of development, effectively recapitulating the IS phenotype. We observed that the epha4a mutants displayed defects in left-right coordination during locomotion, which arose from disorganized neural activation in these mutants. Our subsequent experiments indicated that the disruption of the central pattern generator (CPG) network, characterized by abnormal axon guidance of spinal cord interneurons, contributed to the disorganization observed in the mutants. Moreover, when knocked down efnb3b, the ligand for Epha4a, we observed similar CPG defects and disrupted left-right locomotion. These findings suggested that ephrin B3-Epha4 signaling is vital for the proper functioning of CPGs, and defects in this pathway could lead to scoliosis in zebrafish. Furthermore, we identified two cases of IS in NGEF, a downstream molecule in the EPHA4 pathway. Collectively, our data provide compelling evidence that neural patterning impairments and disruptions in CPGs may underlie the pathogenesis of IS.

Keywords: EPHA4; central pattern generators; genetics; genomics; human; idiopathic scoliosis; medicine; pathogenesis; zebrafish.


Conflict of interest statement

LW, XY, SZ, PZ, WW, KX, XC, QL, AK, YK, JL, XF, NO, ZC, YL, LL, HX, PZ, XL, YN, SW, SL, SY, CT, ZL, SC, XZ, ZW, GQ, JL, JR, CW, JZ, CZ, NW No competing interests declared, PL, JP affiliated to Baylor Genetics, Houston, SI J.R.L has stock ownership in 23andMe, is a paid consultant for Regeneron Pharmaceuticals and Novartis, and is a co-inventor on multiple United States and European patents related to molecular diagnostics for inherited neuropathies, eye diseases and bacterial genomic fingerprinting

Figures

Figure 1.
Figure 1.. Clinical and genetic information on idiopathic scoliosis (IS) patients and functional effect of EPHA4 variants.
(A) Locations of three EPHA4 single-nucleotide variants relative to the protein domains (top panel) and exons 1–18 (bottom panel). (B-E) Pedigrees and spinal radiographs of four probands with dominant gene variants. Sanger sequencing confirmed the variants. The arrows indicate the probands. The term +/+ denotes the wild-type, and cDNA change/+ denotes the heterozygous variant. (F) Western blot analysis of EPHA4-c.2546G>A variant showing the protein expression levels of EPHA4 and CDK5 and the amount of phosphorylated CDK5 (pCDK5) in HEK293T cells transfected with EPHA4-mutant or EPHA4-WT plasmid. WT: wild-type. Data represent three independent experiments. Error bars show mean ± SD. P<0.05 was considered statistically significant. (G) Schematic representation of the effect of the EPHA4-c.1443+1G>C mutation on the splicing process. This variant induced a new splicing site (red box). The yellow box indicates the splicing acceptor. (H) Schematic representation of the effect of the EPHA4-c.1318+10344A>G mutation on the splicing process. This variant induced a new splicing site (red box). The yellow box indicates the splicing acceptor. (I) The minigene assay result showed that the c.1443+1G>C variant introduced a new splicing site, resulting in a 36 bp in-frame deletion in exon 6. (J) The nested PCR showed that the c.1318+10344A>G variant induced exon 5 skipping, resulting in a 339 bp in-frame deletion. (K) NCBI RefSeq genes included in 2q35-q36.2 from UCSC Genome Browser. EPHA4 is shown by the red oval.
Figure 1—figure supplement 1.
Figure 1—figure supplement 1.. Flowchart for identification of causative genes.
The processes of candidate gene mapping and gene-based burden analysis were described. The variants in EPHA4 and NGEF identified in each cohort were displayed. Abbreviations: SNP: single-nucleotide polymorphism; eQTL: expression quantitative trait locus; IS: idiopathic scoliosis.
Figure 1—figure supplement 2.
Figure 1—figure supplement 2.. The splicing analysis by the Alamut software.
Results of Alamut analysis for (A) the c.1443+1G>C variant and (B) the c.1318+10344A>G variant using four algorithms (SpliceSiteFinder-like, MaxEntScan, NNSPLICE, and GeneSplicer).
Figure 2.
Figure 2.. Scoliosis in zebrafish epha4a mutants.
(A) Diagram of the protein domains, genomic structures, and sequences of wild-type and corresponding epha4a mutants. Red arrows indicate mutation sites. Blue boxes indicate open reading frames. Underlined sequences indicate the protospacer adjacent motif (PAM) region, and red fonts indicate Cas9 binding sites. LBD: ligand binding domain; FN3: fibronectin type 3 domain; TMD: transmembrane domain; PTKc: catalytic domain of the protein tyrosine kinases; SAM: sterile alpha motif. (B) Sanger sequencing results confirmed the deletion of the target region in epha4a mutant transcripts. (C) Bar graph showing the percentages of adult zebrafish with normal, mild, or severe body axis defects in wild-type (n=76), epha4a heterozygote (n=95), or epha4a homozygous (n=116). (D) Representative images of wild-type and homozygous epha4a mutants. Micro CT images are shown on the right. Lateral and dorsal views are shown. Scale bar: 1 cm.
Figure 2—figure supplement 1.
Figure 2—figure supplement 1.. Phenotypes of epha4a mutants.
(A) Representative images showing the notochord and external phenotypes of wild-type and epha4a mutants. The red dashed lines indicate the area of the notochord. (B) Whole-mount in situ hybridization results showing the expression of the rfng gene in 18 hr post-fertilization (hpf) wild-type, homozygous mutant, or morphant larvae as indicated. The rfng gene marks boundary cells in the hindbrain. The red arrows indicate boundary expression. The numbers of embryos analyzed are shown on the top right. Scale bars: 200 µm in panel (A), 100 µm in panel (B).
Figure 2—figure supplement 2.
Figure 2—figure supplement 2.. Zebrafish epha4b mutants exhibited body axis defects during development.
(A) Diagram showing the protein domains, genomic structures, and sequences of the wild-type and corresponding epha4b mutants. Red arrows indicate mutation sites. (B) Representative images of epha4b mutants. (C) Bar graph showing the percentages of adult fish with normal and body axis defects in wild-type (n=39) and epha4b mutants (n=43). (D) Bright-field and GFP fluorescent images showing scoliosis epha4b mutants at 28 days post-fertilization (dpf) as indicated by Tg(Ola.Sp7:NLS-GFP) transgene, which labels the bone skeleton. Scale bars: 1 cm in panel (B), 2 mm in panel (D).
Figure 3.
Figure 3.. Abnormal left-right swimming pattern in the absence of Epha4a.
(A) Dot plots showing the swimming distance of each 8 days post-fertilization (dpf) larva at a duration of 4 min (N=54 for wild-type and N=60 for epha4a mutants). (B) Dot plots showing the swimming velocity of wild-type and mutant larvae as indicated. (C) Diagram showing the turning angle (θ) of the larvae during swimming. (D) Scatter plot showing the relative turning angle of wild-type and mutant larvae. The relative angles were calculated by the sum of turning angles during fish swimming with left (positive) or right (negative) turns. The epha4a mutants favored turning to one side of their directions compared with those of wild-type larvae. (E) Dot plots showing the average absolute turning angle of wild-type and mutant larvae as indicated. (F) Dot plots showing the average absolute angular velocity of wild-type and mutant larvae as indicated. (G) Bar graph showing the percentages of 5 dpf zebrafish larvae with different reactions after tactile stimulation. N=10 for each group; the numbers of tactile stimulations are indicated in each column. (H) Representative images of the total body curvature measurements in zebrafish larvae, with values as the sum of α and β angles shown in the figure. (I) Representative time-series images of 5 dpf wild-type and epha4a mutant zebrafish larvae after tactile stimulation to the head. Each panel represents the points of maximal body curvature for the C-bend and counterbend after the tactile startle response. (J, K) A plot of body curvature angles as measured in panel (H) during swimming in response to tactile head stimulation in 5 dpf wild-type (panel J, N=5 larvae, n=10 stimuli) and epha4a mutants (panel K, N=5 larvae, n=7 stimuli). Each colored curve represents an independent experiment showing the response of a single larva to a stimulus. The positive angle means turning right. (L) The maximum curvature angles during the first C-bend and counterbend after tactile stimulation in wild-type and epha4a mutant larvae.
Figure 3—figure supplement 1.
Figure 3—figure supplement 1.. Rescue of the epha4a homozygous mutant phenotype by epha4a mRNA injection.
(A) Scatter plot showing the relative turning angle of wild-type, epha4a homozygous larvae and homozygous larvae injected with the corresponding mRNA. (B) The pie chart shows the proportional distribution of relative turning angles in three groups of larvae. N=30 larvae, n=90 experiments. Larvae that remained stationary during the recording were excluded.
Figure 4.
Figure 4.. Uncoordinated left-right activation of spinal cord neurons in epha4a mutants.
(A, A’) Fluorescent images showing the dorsal view of 24 hr post-fertilization (hpf) Tg(elavl3:GAL4; UAS:GCaMP) double transgenic larvae. The corresponding movies are shown in Videos 5 and 6. (B, B’) Line charts showing the quantification of fluorescence changes of the region of interests (ROIs, circled in A, A’) in wild-type larvae and epha4a mutants. (C) Scatter plot showing the distribution trend of the ratio of the calcium signal frequency between left and right in wild-type (N=14 larvae, n=42 experiments) and epha4a mutants (N=10 larvae, n=30 experiments). (D) Statistical graph of the ratio of the calcium signal frequency between left and right in wild-type larvae and epha4a mutants. Scale bars: 50 μm in panels (A, A’).
Figure 4—figure supplement 1.
Figure 4—figure supplement 1.. Uncoordinated left-right activation of spinal cord neurons in the absence of Epha4a.
(A, A’) Fluorescent images showing the dorsal view of 24 hr post-fertilization (hpf) Tg(elavl3:GAL4; UAS:GCaMP) double transgenic larvae. The corresponding movies are shown in Videos 7 and 8. (B, B’) Line charts showing the quantification of fluorescence changes of the region of interests (ROIs, circled in A, A’) in control and epha4a morphants. (C) Scatter plot showing the distribution trend of the ratio of the calcium signal frequency between left and right in control (N=15 larvae, n=38 experiments) and epha4a morphants (N=15 larvae, n=41 experiments). (D) Statistical graph of the ratio of the calcium signal frequency between left and right in control and epha4a morphants. Scale bars: 50 μm in panels (A, A’).
Figure 5.
Figure 5.. Disorganized neural patterning in epha4a mutants.
(A) Confocal images showing reticulospinal neuronal axons in 48 hr post-fertilization (hpf) wild-type and epha4a mutant larvae visualized with anti-neurofilament antibody RMO44. Asterisks indicate the cross sites of Mauthner axons. The green arrow indicates the cell body of the r5/MiD2 neuron in a wild-type larva. The red arrow points to the ipsilaterally projected axon of r6/MiD3 in the mutant larva, which is normally projected to the other side in wild-type fish. (B) Statistical chart showing the distance between r4 and r7 of 48 hpf wild-type and epha4a mutants. (C) Scatter plot showing the distance (d) between the center line and the intersection site of Mauthner axons as indicated in panel C′. (D) The ratio of the distance between the intersection site of Mauthner axons and bilateral axon bundles in 48 hpf wild-type (N=11 larvae) and epha4a mutants (N=12 larvae). The ratios were calculated as in panel D′. Scale bars: 20 µm in panel (A).
Figure 6.
Figure 6.. Aberrant swimming as a result of abnormal extension of cerebrospinal fluid-contacting neurons (CSF-cNs) axons.
(A) Fluorescent images showing the distribution of ascending axons of CSF-cNs marked by Tg(pkd2l1:GAL4,UAS:Kaede) in 2 days post-fertilization (dpf) epha4a mutant larvae. Yellow line indicates the midline, and the red arrows indicate aberrantly extended axons in epha4a+/- and epha4a-/- larvae. (B) Bar graph showing the percentages of abnormal extension of CSF-cNs axons in 2 dpf wild-type, epha4a heterozygote, and epha4a homozygous. The numbers of larvae are indicated in each column. (C, C’) Superimposed frames of tail oscillations in 5 dpf control and epha4a morphants. (D, D’) A plot of body curvature angles in panels (C) and (C’). The positive angle means turning right. (E) Percentages of tendentious swing in control (N=8 larvae, n=24 experiments) and epha4a morphants (N=11 larvae, n=33 experiments). The percentages were calculated by the ratio of tendentious tail oscillation during the first eight swings. Scale bars: 50 µm in panel (A).
Figure 7.
Figure 7.. Left-right coordination defects in efnb3b morphants.
(A) Fluorescent images showing the distribution of ascending axons of cerebrospinal fluid-contacting neurons (CSF-cNs) marked by Tg(pkd2l1:GAL4,UAS:Kaede) in 2 days post-fertilization (dpf) efnb3b morphants. The red arrows indicate aberrantly extended axons in efnb3b morphants. (B) Fluorescent images showing the dorsal view of 24 hr post-fertilization (hpf) Tg(elavl3:GAL4; UAS:GCaMP) transgenic larvae. (C) The line chart showing the quantification of fluorescence changes of the region of interests (ROIs) in control morphants and efnb3b morphants as indicated in panel B. (D) Superimposed frames of tail oscillations in 5 dpf control and efnb3b morphants. (E) A plot of body curvature angles in panel (D). The positive angle means turning right. Scale bars: 50 μm in panels (A, B).
Figure 7—figure supplement 1.
Figure 7—figure supplement 1.. Expression pattern of epha4 and efnb3 in the spinal cord.
(A) Whole-mount in situ hybridization results showing the expression of epha4a and epha4b genes in the spinal cord in 24 days post-fertilization (dpf) zebrafish larvae. (B) Violin plot showing epha4a, epha4b, efnb3a, and efnb3b gene expression in different cell types. Single-cell transcriptome data were acquired from two different studies (top and bottom) (Cavone et al., 2021; Scott et al., 2021). Scale bars: 200 µm in panel (A).
Figure 8.
Figure 8.. Idiopathic scoliosis (IS) patients with potential NGEF variants.
(A) Protein structure of NGEF protein with the position of potential variants. (B, C) Pedigrees and spinal radiographs of two probands with dominant gene variants. Sanger sequencing results are shown on the right.
Figure 8—figure supplement 1.
Figure 8—figure supplement 1.. Proteins in STRING that interact with EPHA4.
Protein interaction network analysis, as illustrated by STRING v11.5, was used to identify rare variants in genes related to EPHA4. Known and predicted protein-protein interactions are included in the STRING database. Multiple proteins, including Ephexin, are associated with EPHA4 physically or functionally. Ephexin, encoded by NGEF, is a neuronal guanine exchange factor.
Figure 9.
Figure 9.. The proposed mechanism of idiopathic scoliosis (IS) mediated by EPHA4 dysfunction.
In healthy individuals, EphrinB3-activated EPHA4 phosphorylates CDK5, leading to the phosphorylation of Ephexin, a protein encoded by NGEF. Phosphorylated Ephexin can regulate axon guidance through either activating RHOA or suppressing CDC42 and RAC1 signaling. These processes are critical in maintaining the normal function of the central pattern generator (CPG), the local neural network that provides coordinated bilateral muscle control. Impairment of the EPHA4 pathway and CPG may cause an imbalance of the motor drive from the spinal cord during development, thus causing the uncoordinated left/right swimming behavior in zebrafish larvae and the asymmetry of the bilateral muscular pull in a young child. Although the appearance is normal in early childhood, the dysfunction produces a scoliotic curve during the growth spurt.

Update of

  • doi: 10.1101/2024.03.04.583361
  • doi: 10.7554/eLife.95324.1
  • doi: 10.7554/eLife.95324.2

Similar articles

References

    1. Aguet F, Anand S, Ardlie KG, Gabriel S, Getz GA, Graubert A, Hadley K, Handsaker RE, Huang KH, Kashin S, Li X, MacArthur DG, Meier SR, Nedzel JL, Nguyen DT, Segrè AV, Todres E, Balliu B, Barbeira AN, Battle A, Bonazzola R, Brown A, Brown CD, Castel SE, Conrad DF, Cotter DJ, Cox N, Das S, de Goede OM, Dermitzakis ET, Einson J, Engelhardt BE, Eskin E, Eulalio TY, Ferraro NM, Flynn ED, Fresard L, Gamazon ER, Garrido-Martín D, Gay NR, Gloudemans MJ, Guigó R, Hame AR, He Y, Hoffman PJ, Hormozdiari F, Hou L, Im HK, Jo B, Kasela S, Kellis M, Kim-Hellmuth S, Kwong A, Lappalainen T, Li X, Liang Y, Mangul S, Mohammadi P, Montgomery SB, Muñoz-Aguirre M, Nachun DC, Nobel AB, Oliva M, Park Y, Park Y, Parsana P, Rao AS, Reverter F, Rouhana JM, Sabatti C, Saha A, Stephens M, Stranger BE, Strober BJ, Teran NA, Viñuela A, Wang G, Wen X, Wright F, Wucher V, Zou Y, Ferreira PG, Li G, Melé M, Yeger-Lotem E, Barcus ME, Bradbury D, Krubit T, McLean JA, Qi L, Robinson K, Roche NV, Smith AM, Sobin L, Tabor DE, Undale A, Bridge J, Brigham LE, Foster BA, Gillard BM, Hasz R, Hunter M, Johns C, Johnson M, Karasik E, Kopen G, Leinweber WF, McDonald A, Moser MT, Myer K, Ramsey KD, Roe B, Shad S, Thomas JA, Walters G, Washington M, Wheeler J, Jewell SD, Rohrer DC, Valley DR, Davis DA, Mash DC, Branton PA, Barker LK, Gardiner HM, Mosavel M, Siminoff LA, Flicek P, Haeussler M, Juettemann T, Kent WJ, Lee CM, Powell CC, Rosenbloom KR, Ruffier M, Sheppard D, Taylor K, Trevanion SJ, Zerbino DR, Abell NS, Akey J, Chen L, Demanelis K, Doherty JA, Feinberg AP, Hansen KD, Hickey PF, Jasmine F, Jiang L, Kaul R, Kibriya MG, Li JB, Li Q, Lin S, Linder SE, Pierce BL, Rizzardi LF, Skol AD, Smith KS, Snyder M, Stamatoyannopoulos J, Tang H, Wang M, Carithers LJ, Guan P, Koester SE, Little AR, Moore HM, Nierras CR, Rao AK, Vaught JB, Volpi S. The GTEx Consortium atlas of genetic regulatory effects across human tissues. Science. 2020;369:1318–1330. doi: 10.1126/science.aaz1776. - DOI - PMC - PubMed
    1. Andersson LS, Larhammar M, Memic F, Wootz H, Schwochow D, Rubin C-J, Patra K, Arnason T, Wellbring L, Hjälm G, Imsland F, Petersen JL, McCue ME, Mickelson JR, Cothran G, Ahituv N, Roepstorff L, Mikko S, Vallstedt A, Lindgren G, Andersson L, Kullander K. Mutations in DMRT3 affect locomotion in horses and spinal circuit function in mice. Nature. 2012;488:642–646. doi: 10.1038/nature11399. - DOI - PMC - PubMed
    1. Auton A, Brooks LD, Durbin RM, Garrison EP, Kang HM, Korbel JO, Marchini JL, McCarthy S, McVean GA, Abecasis GR, 1000 Genomes Project Consortium A global reference for human genetic variation. Nature. 2015;526:68–74. doi: 10.1038/nature15393. - DOI - PMC - PubMed
    1. Bagnat M, Gray RS. Development of a straight vertebrate body axis. Development. 2020;147:dev175794. doi: 10.1242/dev.175794. - DOI - PMC - PubMed
    1. Borgius L, Nishimaru H, Caldeira V, Kunugise Y, Löw P, Reig R, Itohara S, Iwasato T, Kiehn O. Spinal glutamatergic neurons defined by EphA4 signaling are essential components of normal locomotor circuits. The Journal of Neuroscience. 2014;34:3841–3853. doi: 10.1523/JNEUROSCI.4992-13.2014. - DOI - PMC - PubMed