. 2025 Jul 15:13:RP101670.
doi: 10.7554/eLife.101670.

Malnutrition drives infection susceptibility and dysregulated myelopoiesis that persists after refeeding intervention

Affiliations

Malnutrition drives infection susceptibility and dysregulated myelopoiesis that persists after refeeding intervention

Alisa Sukhina et al. Elife. .

Abstract

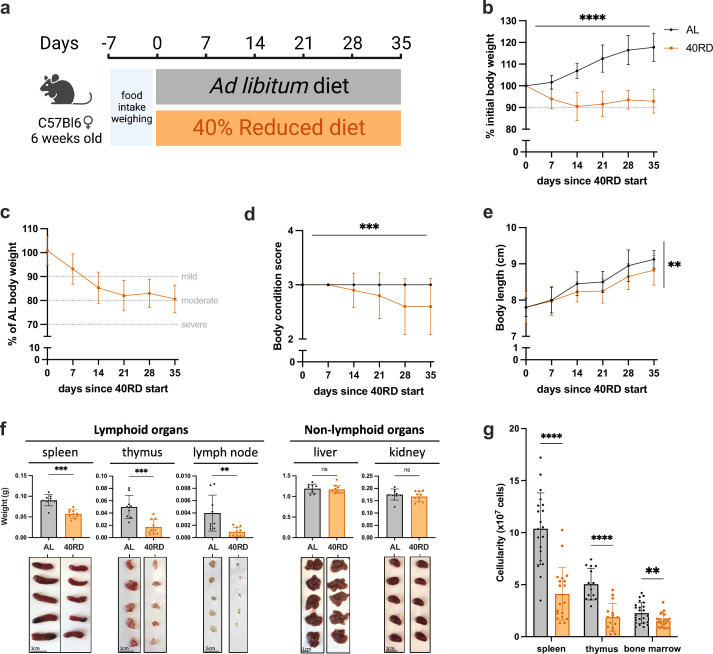
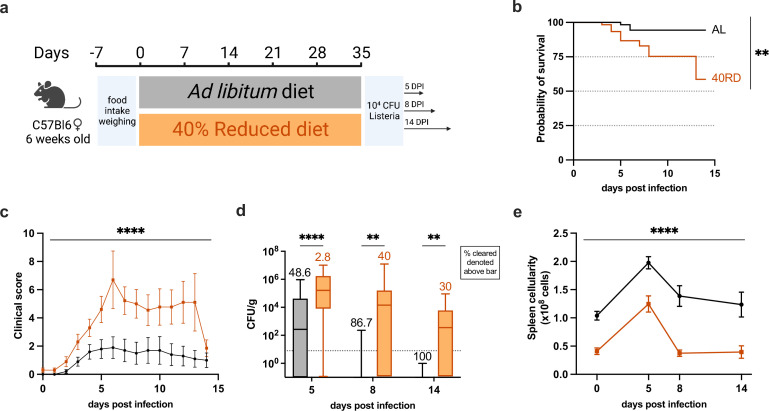
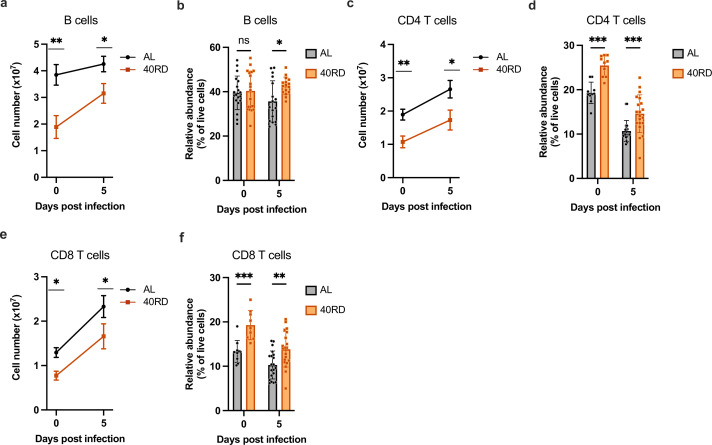
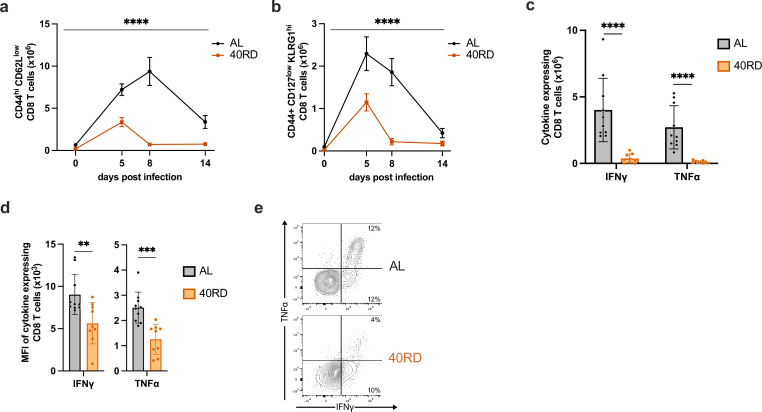
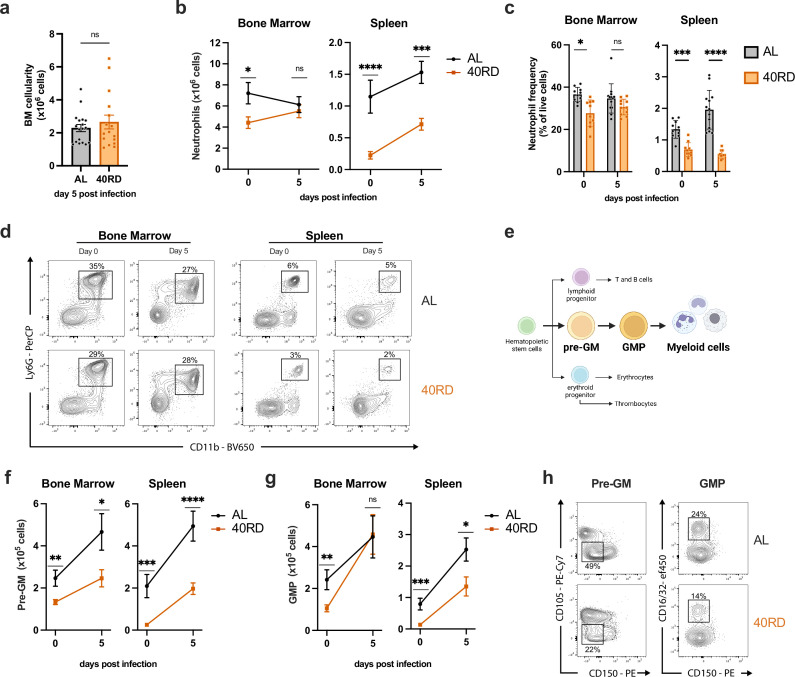
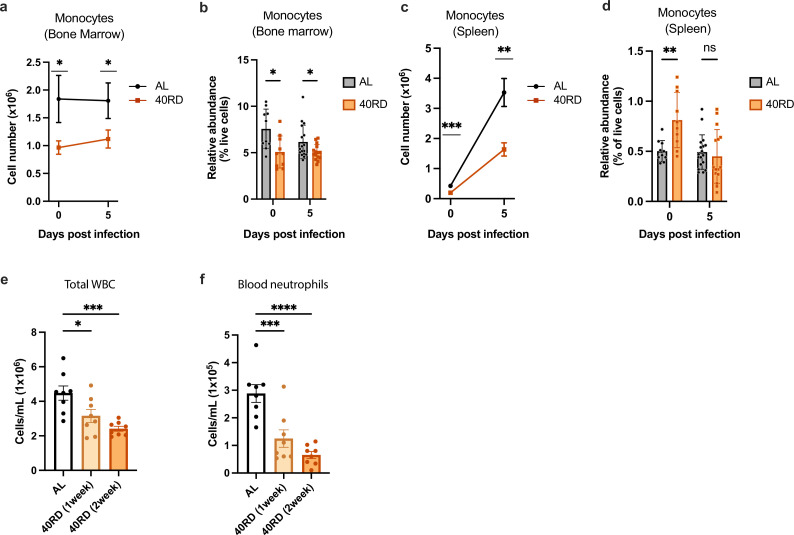
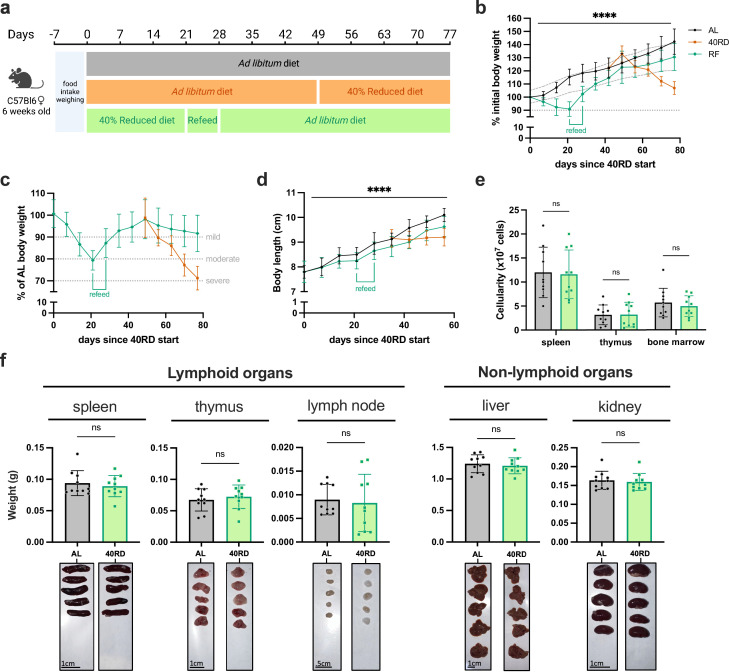
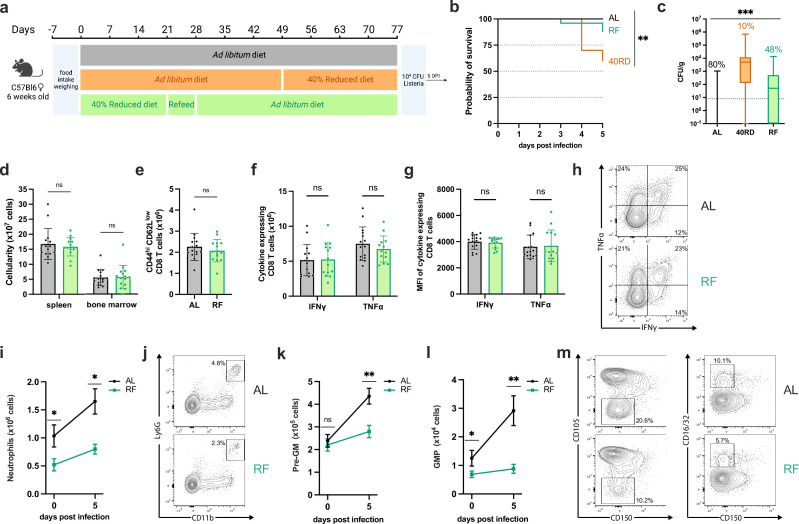
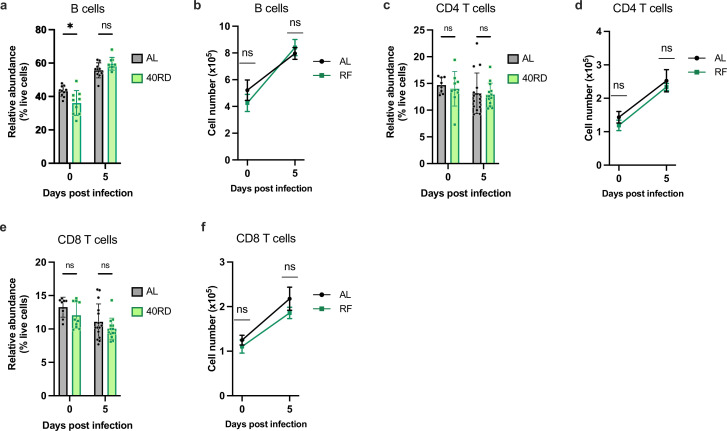
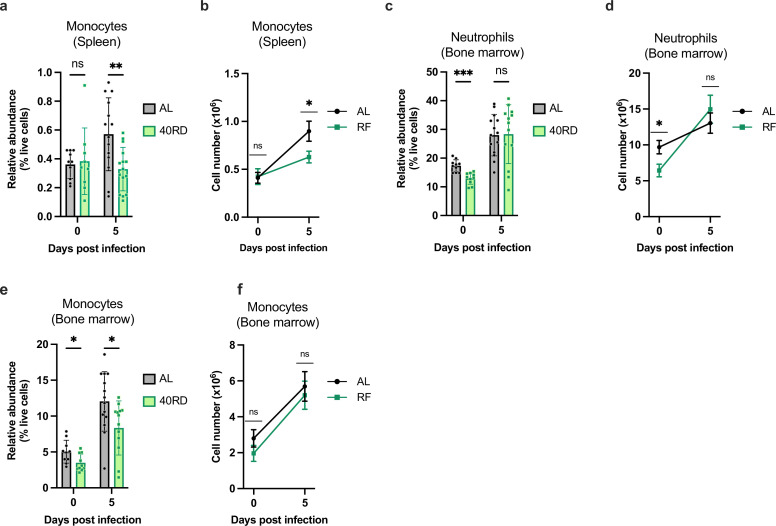
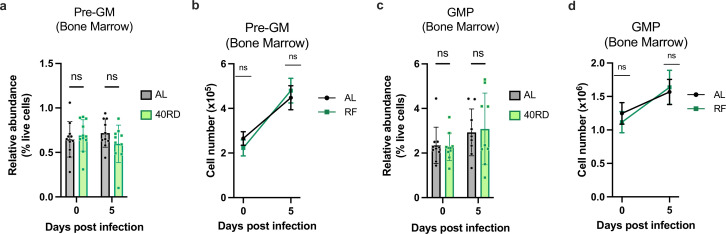
Undernutrition remains a major global health crisis, with nearly 1 billion people experiencing severe food insecurity. Malnourished individuals are especially vulnerable to infectious diseases, which is the leading cause of morbidity and mortality for this population. Despite the known link between undernutrition and infection susceptibility, the mechanisms remain poorly understood, and it is unclear whether refeeding can reverse nutritionally acquired immunodeficiency. Here, we investigate how malnutrition leads to immune dysfunction and the ability of refeeding to repair it. Malnourished mice show an inability to control sublethal Listeria monocytogenes infection, reduced immune cell function and expansion, and early contraction before pathogen clearance. Myelopoiesis is particularly affected, with fewer neutrophils and monocytes present both before and after infection in malnourished mice. While refeeding restores body mass, lymphoid organ cellularity, and T cell responses, refed mice remain susceptible to Listeria infection, revealing that recovery from lymphoid atrophy alone is not sufficient to restore protective immunity. Accordingly, peripheral neutrophils and monocytes fail to fully recover, and emergency myelopoiesis remains impaired in refed animals. Altogether, this work identifies dysregulated myelopoiesis as a link between prior nutritional state and immunocompetency, indicating that food scarcity is an immunologic risk factor, even after nutritional recovery.

Keywords: diet; immunodeficiency; immunology; infectious disease; inflammation; malnutrition; microbiology; mouse; myelopoiesis; neutrophil; refeeding.


Conflict of interest statement

AS, CQ, SR, EH, KR, MA, EN, AW, JN, FB, WB No competing interests declared

Figures

Figure 1.
Figure 1.. Sustained dietary restriction recapitulates the hallmarks of nutritionally acquired immunodeficiency.
(a) Schematic of experimental design for 40% reduced diet (40RD, orange) in comparison to control ad libitum (AL, black) diet. (b) Body weight of AL and 40RD mice as a percentage of initial body weight over time (n = 50). The dotted line represents 10% of initial body weight lost. (c) Body weight of 40RD mice as a percentage of age-matched average AL body weight over time (n = 50). Each dotted line represents clinical designations of undernutrition severity. (d) Body condition score of AL and 40RD mice over time (n = 10). (e) Body length of AL and 40RD mice over time, measured from the nose tip to the base of the tail (n = 10). (f) Comparative weights of AL and 40RD lymphoid and non-lymphoid tissues (n = 10) with representative photos of the corresponding organs. Scale bars 1 cm (0.5 cm for lymph nodes). (g) Total live cell counts for whole spleen (n = 15), thymus (n = 15), and bone marrow (n = 10). Statistics: (b–g) Plotted as mean ± SD; (b, d) simple linear regression with slope comparisons; (e) simple linear regression with elevation comparison; and (f, g) two-tailed Mann–Whitney test. ** P ≤ 0.01, *** P ≤ 0.001, **** P ≤ 0.0001.
Figure 2.
Figure 2.. Chronic malnutrition results in a failure to control sublethal L. monocytogenes infection.
(a) Schematic of Lm infection (104 CFUs per mouse) experimental design in AL (orange) and 40RD (black) mice. Mice were maintained on the corresponding diet throughout the course of the infection. (b) Probability of survival for infected AL and 40RD mice over time. The curves represent pooled data from three experimental groups: 5DPI (n = 25), 8DPI (n = 15), and 14DPI (n = 10). Statistics done via log-rank test. (c) Clinical score for infected AL and 40RD mice over time from the 14DPI group. Plotted as mean ± SEM; statistics done via mixed-effect two-way ANOVA analysis. (d) Pathogen burden in liver tissue of AL and 40RD mice. Percentage of mice that cleared the pathogen on a given day is represented as numbers above corresponding bars. The dotted line represents the limit of detection. Plotted as box and min to max whiskers; statistics done via two-tailed Mann–Whitney test for each time point. (e) Total splenocyte counts for infected AL and 40RD mice over time. Uninfected spleen cell counts are the same as used for Figure 1g. Plotted as mean ± SEM; statistics done via mixed-effect two-way ANOVA analysis. ** P ≤ 0.01, **** P ≤ 0.0001.
Figure 2—figure supplement 1.
Figure 2—figure supplement 1.. AL and 40RD mice were infected with 104 CFUs of Listeria monocytogenes per mouse.
At days 0 and 5 post-infection, spleens were harvested, counted, and analyzed by flow cytometry. (a) The total number of splenic B cells. (b) Relative abundance of B cells as a percentage of all live cells. (c) The total number of splenic CD4 T cells. (d) Relative abundance of CD4 T cells as a percentage of all live cells. (e) The total number of splenic CD8 T cells. (f) Relative abundance of CD8 T cells as a percentage of all live cells. * P ≤ 0.05, ** P ≤ 0.01, *** P ≤ 0.001.
Figure 3.
Figure 3.. Chronic malnutrition diminishes T cell expansion and function while accelerating contraction during infection.
AL and 40RD mice were infected with Lm at 104 CFUs per mouse. Splenocytes were counted, and flow cytometry was performed at days 0, 5, 8, and 14 post-infection to evaluate the total cell number of (a) antigen-experienced CD8+ T cells gated on live single CD8+ CD44hi CD62Llow and (b) short-lived effector cells further gated on KLRG1hi CD127low. Plotted as mean ± SEM; statistics done via mixed-effect two-way ANOVA analysis. Splenocytes from AL (n = 10) and 40RD (n = 10) mice were harvested at day 8 post-infection and stimulated ex vivo with OVA peptide for 6 hr. Intracellular flow cytometry was performed to quantify (c) total cell number of and (d) mean fluorescence intensity (MFI) of antigen-experienced CD8+ T cells expressing IFNγ and TNFα. Plotted as mean ± SD; statistics done via two-tailed Mann–Whitney test for each cytokine. (e) Representative flow cytometry data of (c, d), with average frequencies shown. ** P ≤ 0.01, *** P ≤ 0.001, **** P ≤ 0.0001.
Figure 4.
Figure 4.. Chronically malnourished mice display dysregulated myelopoiesis.
(a) Total bone marrow cell counts from day 5 post-infection AL (n = 18) and 40RD (n = 16) mice. Bone marrow cells and splenocytes were counted, and flow cytometry was performed at days 0 (n = 10 for both AL and 40RD) and 5 post Lm infection in AL and 40 RD mice to evaluate (b) the total cell number of neutrophils and (c) the relative frequency of neutrophils among live cells. (d) Representative flow cytometry data for the results in (b, c), with average frequencies shown. (e) A simplified schematic representation of myelopoiesis showing pre-GM and granulocyte/monocyte progenitor (GMP) as key progenitors in granulocyte/monocyte lineage. Bone marrow cells and splenocytes were counted, and flow cytometry was performed at days 0 and 5 post Lm infection in AL and 40 RD mice to evaluate the total cell number of (f) pre-GM cells (Lineage Sca1 CD117+ CD150 CD16/32 CD105) and (g) GMP cells (Lineage Sca1 CD117+ CD150 CD16/32+). (h) Representative flow cytometry results for the myeloid progenitor data in (f, g), with average frequencies shown. Statistics: (a–c, f, g) Plotted as mean ± SEM; statistics done via two-tailed Mann–Whitney test for each time point. * P ≤ 0.05, ** P ≤ 0.01, *** P ≤ 0.001, **** P ≤ 0.0001.
Figure 4—figure supplement 1.
Figure 4—figure supplement 1.. AL and 40RD mice were infected with 104 CFUs of Listeria monocytogenes per mouse.
At days 0 and 5 post-infection, bone marrow and spleens were harvested, counted, and analyzed by flow cytometry. (a) The total number of bone marrow monocytes. (b) Relative abundance of bone marrow as a percentage of all live cells. (c) The total number of splenic monocytes. (d) Relative abundance of splenic monocytes as a percentage of all live cells. Mice were placed on 40RD, and peripheral blood was collected at 1 and 2 weeks post-dietary restriction. Blood was then analyzed to quantify the total number of (e) white blood cells (WBC) and (f) blood neutrophils. * P ≤ 0.05, ** P ≤ 0.01, *** P ≤ 0.001, **** P ≤ 0.0001.
Figure 5.
Figure 5.. Refeeding intervention reverses wasting, stunting, and global immune atrophy.
(a) Schematic of the experimental design for refeeding intervention (RF) in comparison to age-matched 40RD and control AL diet. (b) Body weight of AL (n = 25), 40RD (n = 10), and RF (n = 25) mice as a percentage of their initial body weight over time. The dotted line represents 10% of initial body weight lost, and the shaded area represents the normal weight range for age-matched female C57Bl6 mice (c). (c) Body weight of 40RD (n = 10) and RF (n = 25) mice as a percentage of age-matched average AL body weight over time. Each dotted line represents clinical designations of undernutrition severity. (d) Body length of AL and 40RD mice over time, measured from the nose tip to the base of the tail (n = 10). (e) Total cell counts for whole spleen, thymus, and bone marrow from AL and RF mice (n = 10). (f) Comparative weights of AL and RF lymphoid and non-lymphoid tissues (n = 10) with representative photos of the corresponding organs. Scale bars 1 cm (0.5 cm for lymph nodes). Statistics: (b–f) Plotted as mean ± SD; (b, d) simple linear regression with slope comparisons; and (e, f) two-tailed Mann–Whitney test. **** P ≤ 0.0001.
Figure 6.
Figure 6.. Refeeding intervention fails to restore immunocompetency and normal myelopoiesis.
(a) Schematic of Lm infection (104 CFUs per mouse) experimental outline in AL, 40RD, and RF mice. Mice were maintained on the corresponding diet throughout the course of the infection. (b) Probability of survival for infected AL (n = 25), 40RD (n = 10), and RF (n = 25) mice over time. Statistics done via log-rank test. (c) Pathogen burden in liver tissue of five DPI AL (n = 25), 40RD (n = 10), and RF (n = 25) mice. Percentage of mice that cleared the pathogen on a given day is represented as numbers above corresponding bars. The dotted line represents the limit of detection. Plotted as box and min to max whiskers; statistics done via Kruskal–Wallis test. (d) Total splenocyte and bone marrow cell counts for AL (n = 15) and RF (n = 15) mice at day 5 post-infection. (e) Total cell number of CD44+CD8+ T cells in AL and RF mice at days 0 and 5 post-infection. Splenocytes from AL and RF mice were harvested at day 5 post-infection and stimulated ex vivo with OVA peptide for 6 hr. Intracellular flow cytometry was performed to quantify (f) total cell number of and (g) mean fluorescence intensity (MFI) of antigen-experienced CD8+ T cells expressing IFNγ and TNFα. (h) Representative flow cytometry results for data in (f, g), with average frequencies shown. (i) Total splenic neutrophils abundance in AL and RF mice at days 0 and 5 post-infection. (j) Representative flow cytometry results for day 5 post-infection neutrophil data in (i), with average frequencies shown. At days 0 and 5 post-infection, spleens from AL and RF were evaluated for the total number of (k) pre-GM cells and (l) granulocyte/monocyte progenitor (GMP) cells. (m) Representative flow cytometry results plots for the myeloid progenitor data in (k, l), with the average frequencies shown. Statistics: (d–g) Plotted as mean ± SD; statistics done via two-tailed Mann–Whitney test for each category. (i, k, l) Plotted as mean ± SEM; statistics done via two-tailed Mann–Whitney test for each time point. * P ≤ 0.05, ** P ≤ 0.01, *** P ≤ 0.001.
Figure 6—figure supplement 1.
Figure 6—figure supplement 1.. AL and RF mice were infected with 104 CFUs of Listeria monocytogenes per mouse.
At days 0 and 5 post-infection, spleens were harvested, counted, and analyzed by flow cytometry. (a) Relative abundance of B cells as a percentage of all live cells. (b) The total number of splenic B cells. (c) Relative abundance of CD4 T cells as a percentage of all live cells. (d) The total number of splenic CD4 T cells. (e) Relative abundance of CD8 T cells as a percentage of all live cells. (f) The total number of splenic CD8 T cells. * P ≤ 0.05.
Figure 6—figure supplement 2.
Figure 6—figure supplement 2.. AL and RF mice were infected with 104 CFUs of Listeria monocytogenes per mouse.
At days 0 and 5 post-infection, bone marrow and spleens were harvested, counted, and analyzed by flow cytometry. (a) Relative abundance of splenic monocytes as a percentage of all live cells. (b) The total number of splenic monocyte cells. (c) Relative abundance of bone marrow neutrophils as a percentage of all live cells. (d) The total number of bone marrow neutrophils. (e) Relative abundance of bone marrow monocytes as a percentage of all live cells. (f) The total number of bone marrow monocytes. * P ≤ 0.05, ** P ≤ 0.01.
Figure 6—figure supplement 3.
Figure 6—figure supplement 3.. AL and RF mice were infected with 104 CFUs of Listeria monocytogenes per mouse.
At days 0 and 5 post-infection, bone marrow was harvested, counted, and analyzed by flow cytometry. (a) Relative abundance of pre-GM cells as a percentage of all live cells. (b) The total number of pre-GM cells. (c) Relative abundance of granulocyte/monocyte progenitor (GMP) cells as a percentage of all live cells. (d) The total number of GMP cells.

Update of

Similar articles

References

    1. Antwi A. Assessment and management of severe malnutrition in children. West African Journal of Medicine. 2011;30:11–18. doi: 10.4314/wajm.v30i1.69878. - DOI - PubMed
    1. Ashworth A, Khanum S, Jackson A, Schofield EC. Guidelines for the Inpatient Treatment of Severely Malnourished Children. World Health Organization; 2003.
    1. Beisel WR. Single nutrients and immunity. The American Journal of Clinical Nutrition. 1982;35:417–468. doi: 10.1093/ajcn/35.2.417. - DOI - PubMed
    1. Beisel WR. Nutrition and immune function: overview. The Journal of Nutrition. 1996;126:2611S–2615S. doi: 10.1093/jn/126.suppl_10.2611S. - DOI - PubMed
    1. Bhargava A. Undernutrition, nutritionally acquired immunodeficiency, and tuberculosis control. BMJ. 2016;355:i5407. doi: 10.1136/bmj.i5407. - DOI - PubMed