. 2025 Sep 1;222(9):e20231911.
doi: 10.1084/jem.20231911. Epub 2025 Jul 15.

Monoallelic mutations in MMD2 cause autosomal dominant aggressive periodontitis

Affiliations

Monoallelic mutations in MMD2 cause autosomal dominant aggressive periodontitis

Tomoyuki Iwata et al. J Exp Med. .

Abstract

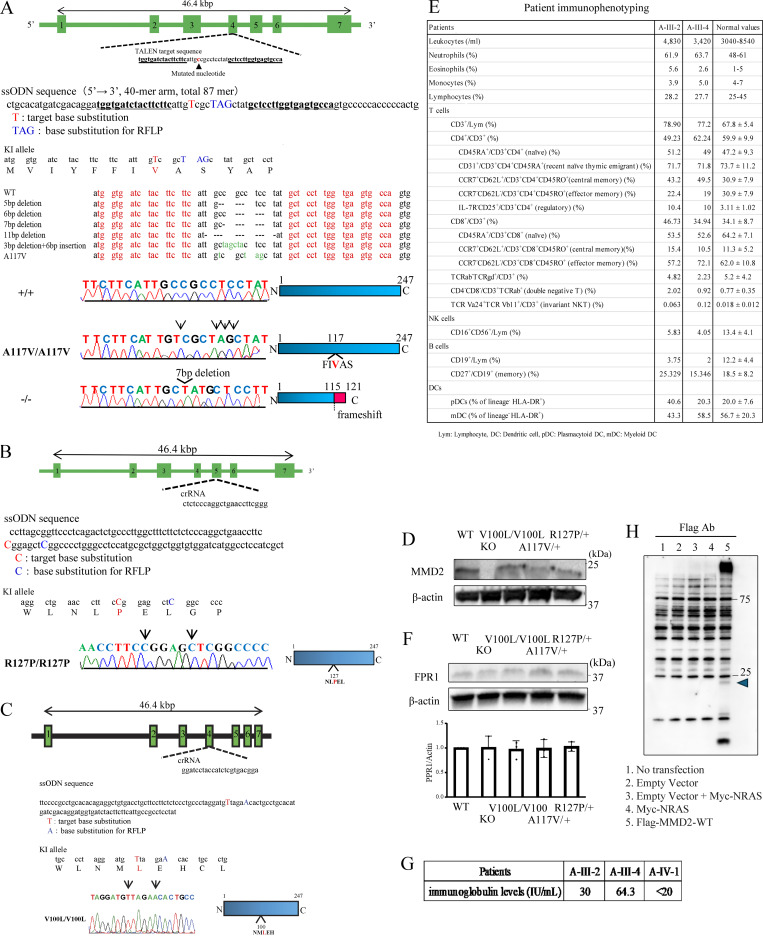
Aggressive periodontitis causes rapid destruction of periodontal tissue. It occurs at a young age with familial clustering. We report on the first time on molecular and cellular basis of a Mendelian form of autosomal dominant aggressive periodontitis. Monoallelic mutations in the monocyte to macrophage differentiation-associated 2 (MMD2) gene, encoding MMD2, in two Japanese families with autosomal dominant aggressive periodontitis are identified. Mutations, c.347 C>T (p.A116V) and c.377 G>C (p.R126P) in MMD2, disturbed fMLP-induced activation of Ras/ERK signaling. Additionally, abnormalities in the proteins of Golgi apparatus, a crucial contributor to innate immune signaling pathways, were identified in patients' neutrophils. The knock-in and knockout mice exhibited alveolar bone loss by ligature-induced periodontitis, along with impaired fMLP-induced chemotaxis, as found in the patients with MMD2 mutation. Our studies revealed that monoallelic mutations in MMD2 underlie the impairment of neutrophil chemotaxis, which leads to the development of autosomal dominant aggressive periodontitis.


Conflict of interest statement

Disclosures: H. Kanegane reported personal fees from Takeda Pharmaceutical Co. outside the submitted work. S. Okada reported grants from Japan Agency for Medical Research and Development, and from the Japan Society for the Promotion of Science during the conduct of the study. No other disclosures were reported.

Figures

Figure 1.
Figure 1.
Characteristic findings in patients with MMD2 mutations and heterozygous MMD2 mutations identified in two families. (A) The families’ pedigrees with p.A116V mutation. Arrows indicate the proband. Filled and open symbols represent affected and unaffected subjects, respectively. Genotypes of the variants c.347C>T and c.377G>C are shown under the number of samples. (B) X-ray images of the 26-year-old patient A-III-4. The normal alveolar bone line is indicated by a yellow dotted line, while the patient’s alveolar bone line is indicated by a red dotted line. (C) The families’ pedigrees with p.R126P mutation. (D) X-ray images of the 16-year-old patient B-III-1. (E) The intron/exon organization and amino acid alignments. Sanger sequencing of MMD2 gene exons 4 and 5 with or without the mutation. The amino acid sequences that were completely conserved among vertebrates. (F) Three-dimensional structural representations of MMD2.
Figure S1.
Figure S1.
Clinical photographs, population genetics, and cellular analyses in patients with MMD2 mutations. (A) Computed tomography images of age-matched healthy subjects, the 45-year-old patient A-III-2, the 44-year-old patient A-III-3, and the 40-year-old patient A-III-4. (B) Clinical photographs of family A. The normal gingival line is indicated by a green line. (C) Clinical photographs of the 16-year-old B-III-1. The gums are reddened. (D) Filtering and numbers of called variants. (E and F) Linkage analysis of the studied family A. Arrows indicate the position of the MMD2 gene. (G) CADD score (y axis) versus allele frequency (x axis) for all the variants of MMD2 found in gnomeAD. (H) Temporal changes in white blood cell count and temporal changes in neutrophils. (I) Superoxide production ability as determined using DHR123 antibody. Diagnosis of chronic granulomatosis using 7D5 antibody. (J) Phagocytic ability. (K) IL-1β production in neutrophils and monocytes of a patient (A-III-2, A-III-4, and A-IV-1). (L) FACS histogram showing superoxide production in neutrophils of a patient (A-III-2) and healthy subjects with or without PMA, zymosan, S. aureus (SA), and E. coli. Activity was assessed using DHR. DHR, dihydrorhodamine.
Figure S2.
Figure S2.
Characteristics of the patients’ peripheral blood and bone marrow. (A) The percentage of CD34+ cells were assessed using peripheral blood. The cells were gated from each lymphocytes (low SSC and CD45+) or monocytes (medium SSC with CD45+/CD14+) and analyzed by flow cytometry. The upper figure shows the histogram of CD34 expression for each subject, with lymphocytes on the right and monocytes on the left. The lower figure summarized the data including the mean fluorescent intensities (MFI) of CD34 expression collected from a patient (A-Ⅲ-2) and six healthy controls for each gating strategy. MFI of CD34 expression in monocytes was assessed in five subjects with Mmd2A116V/+. (a) The data from patients (A-Ⅲ-2, A-Ⅲ-3, A-Ⅳ-1, and A-Ⅳ-2) and healthy controls were displayed. (b) The data from patient (A-Ⅲ-4) was shown with healthy controls. The results of two independent experiments were shown. (B) Identification of CD34+ cells in peripheral blood using immunohistochemical staining. CD34+ cells in peripheral blood of patients III-2 and III-4 are shown. Scale bar = 50 μm. (C) X rays of femur in patients A-III-2 and A-III-4. (D) CD34 expression level on monocytes (CD45/CD14 gated). (E) Images of the bone marrow cells of healthy subjects and patients A-III-2 and A-III-4. Scale bar = 25 μm. (F) The induced colony number (CFU-G, CFU-granulocyte; CFU-GM, CFU-granulocyte/macrophage; CFU-M, CFU-macrophage) and mature population (CD15+CD11b+CD33+ cells) of bone marrow cells are shown.
Figure S3.
Figure S3.
Generation of Mmd2 A117V, R127P, and V100L knock-in mice using platinum TALEN and CRISPR-Cas9 and immunophenotyping of patients with p.A116V mutation. (A) The genomic structure of Mmd2, indicating the two binding sites of the TALENs, is shown. TALEN pairs were designed to bind exon 4 of the Mmd2 gene. The sequence information of Mmd2 mutant alleles, specifically, sequences obtained from mutant mice, which were generated by microinjection of TALEN mRNA. The DNA sequences that were used for designing the TALENs are highlighted in red. Nucleotide mutations and indels are shown. The reference nucleotide C was substituted with variant nucleotide T in the mutant sample. A 7-bp deletion resulted in a frameshift and thus in truncated proteins. (B) crRNA was designed to bind exon 5 of the Mmd2 gene. (C) crRNA was designed to bind exon 4 of the Mmd2 gene. (D) MMD2 protein expression in Mmd2+/+, Mmd2−/−, Mmd2V100L/V100L, Mmd2A117V/A117V, and Mmd2R127P/R127P mice neutrophils. (E) FPR1 protein expression in Mmd2+/+, Mmd2−/−, Mmd2V100L/V100L, Mmd2A117V/+, and Mmd2R127P/+ mice neutrophils. (F) Patient immunophenotyping. (G) Patient IgE levels. (H) Immunoblots were performed using HEK293T cells without transfection (lane 1, no transfection) and HEK293T cells transfected with the empty vector (lane 2), the empty vector and Myc-NRAS vector (Lane 3), the Myc-NRAS vector (lane 4), and Flag-MMD2-WT vector (Lane 5). Source data are available for this figure: SourceData FS3.
Figure 2.
Figure 2.
Characteristics of neutrophils with MMD2 mutations. (A) MMD2 expression, as assessed by real-time PCR on mRNA from patient’s (A-III-2 and A-III-4) and healthy subjects n = 3–5. (B) Immunoblotting analysis of MMD2 expression in neutrophils, monocytes, and lymphocytes from patient’s (A-III-2 and A-III-4) and healthy subjects. (C) Neutrophil chemotaxis induced by fMLP (100 nM, 4 h) was decreased in patients A-III-2, A-III-4, and B-III-1 compared with that in healthy subjects (H1, H2, H3, and H4) n = 5. (D) UMAP visualization in protein expression profiles of MMD2 patients (n = 3; blue) and healthy controls (n = 5; red). (E) Top-10 GO terms significantly upregulated or downregulated in MMD2 patients compared with healthy controls (P value <0.05). The color scale indicates the P value, and the size of the circle indicates the number of genes in the GO term. The Rene ratio indicates the number of core genes against the number of genes in the pathway. (F) GSEA plot of significantly suppressed GO terms. Proteins are ranked in decreasing order based on log 2 fold change of the differentially expression analysis. The color scale in the bottom graph shows upregulated (red) and downregulated (blue) expression in MMD2 patients. (G) Hierarchical clustering analysis based on differentially expressed proteins. The color scale shows log2 fold change comparing MMD2 patients with healthy controls, with red indicating upregulation and blue indicating downregulation. (H) GO analysis of downregulated proteins in MMD2 patients. The x axis shows the log10 P value of enriched GO terms. Source data are available for this figure: SourceData F2.
Figure 3.
Figure 3.
Induction of periodontitis and mRNA levels of pro-inflammatory cytokines in gingival tissues. (A) Representative photographs of the maxilla of treated and untreated mice. Scale bar = 1 mm. (B) Schematics of periodontal bone loss measurements. The distances between the cement–enamel junction and the alveolar bone crest (CEJ-ABC) at the distal facial side of the first molar, at the mesial and distal facial sides of the second molar, and at the mesial facial side of the third molar were measured (Mmd2+/+, n = 19; Mmd2V100L/V100L, n = 8; Mmd2A117V/+, n = 8; Mmd2A117V/A117V, n = 8; Mmd2R127P/+, n = 8; Mmd2R127P/R127P, n = 8; Mmd2−/−, n = 20). Measurements of the distances of CEJ-ABC were performed by personnel blinded to sample information. Mmd2+/+ versus Mmd2V100L/V100L; P = 0.9926, Mmd2+/+ versus Mmd2A117V/+; P < 0.0001, Mmd2+/+ versus Mmd2A117V/A117V; P < 0.0001, Mmd2+/+ versus Mmd2R127P/+; P < 0.0001, Mmd2+/+ versus Mmd2R127P/R127P; P < 0.0001, Mmd2+/+ versus Mmd2−/−; P < 0.0001. (C) qPCR analysis of inflammatory genes in the gingival tissues at 24 h after ligation. 18S was used for normalization. (Mmd2+/+, n = 5; Mmd2A117V/+, n = 5; Mmd2A117V/A117V, n = 5; Mmd2R127P/+, n = 5; Mmd2R127P/R127P, n = 5; Mmd2−/−, n = 5). Il6 (Mmd2+/+ versus Mmd2A117V/+; P = 0.0037, Mmd2+/+ versus Mmd2A117V/A117V; P = 0.0080, Mmd2+/+ versus Mmd2R127P/+; P = 0.0001, Mmd2+/+ versus Mmd2R127P/R127P; P = 0.0080, Mmd2+/+ versus Mmd2−/−; P = 0.0469). Il1b (Mmd2+/+ versus Mmd2A117V/+; P = 0.0142, Mmd2+/+ versus Mmd2A117V/A117V; P = 0.0297, Mmd2+/+ versus Mmd2R127P/+; P = 0.0465, Mmd2+/+ versus Mmd2R127P/R127P; P = 0.0003, Mmd2+/+ versus Mmd2−/−; P = 0.0370). Ccl3 (Mmd2+/+ versus Mmd2A117V/+; P = 0.0059, Mmd2+/+ versus Mmd2A117V/A117V; P = 0.0315, Mmd2+/+ versus Mmd2R127P/+; P = 0.0506, Mmd2+/+ versus Mmd2R127P/R127P; P = 0.0003, Mmd2+/+ versus Mmd2−/−; P = 0.0881). (B and C) Data are presented as mean ± SD. *P < 0.05, **P < 0.01, and ***P < 0.001 with one-way ANOVA with Tukey–Kramer test (B and C) or two-tailed unpaired t test (C, Mmd2+/+ versus Mmd2−/−). ns = not significant. Each dot represents a biologically independent mouse.
Figure 4.
Figure 4.
Neutrophil counts in periodontal tissue in a ligature-induced periodontitis model and neutrophil chemotaxis. (A) Neutrophil chemotaxis induced by fMLP in Mmd2A117V/+, Mmd2A117V/A117V, Mmd2R127P/+, Mmd2R127P/R127P, and Mmd2−/− mice was decreased compared with that in Mmd2+/+ and Mmd2V100L/V100L mice. (Mmd2+/+, n = 5; Mmd2V100L/V100L, n = 4; Mmd2A117V/+, n = 5; Mmd2A117V/A117V, n = 5; Mmd2R127P/+, n = 4; Mmd2R127P/R127P, n = 5; Mmd2−/−, n = 5). Mmd2+/+ versus Mmd2V100L/V100L; P = 0.6758, Mmd2+/+ versus Mmd2A117V/+; P = 0.0502, Mmd2+/+ versus Mmd2A117V/A117V; P = 0.0015, Mmd2+/+ versus Mmd2R127P/+; P = 0.0015, Mmd2+/+ versus Mmd2R127P/R127P; P < 0.0001, Mmd2+/+ versus Mmd2−/−; P < 0.0001. (B) No statistical difference in neutrophil chemotaxis induced by IL-8. The results are expressed as the mean ± SD. (Mmd2+/+, n = 5; Mmd2V100L/V100L, n = 4; Mmd2A117V/+, n = 5; Mmd2A117V/A117V, n = 5; Mmd2R127P/+, n = 4; Mmd2R127P/R127P, n = 5; Mmd2−/−, n = 5). Mmd2+/+ versus Mmd2V100L/V100L; P = 0.9669, Mmd2+/+ versus Mmd2A117V/+; P = 0.9997, Mmd2+/+ versus Mmd2A117V/A117V; P = 0.9913, Mmd2+/+ versus Mmd2R127P/+; P > 0.9999, Mmd2+/+ versus Mmd2R127P/R127P; P = 0.9994, Mmd2+/+ versus Mmd2−/−; P = 0.9440. (C–K) Neutrophil numbers were decreased in ligature-induced periodontitis. Immunofluorescence for Ly6G (C, F, and I) and MPO (D, G, and J) in gingival tissues at 24 h after ligation. Red = Ly6G-positive cells, green = MPO, L (white dot line) = ligature, B = alveolar bone, DP = dental pulp, D = dentin. Nuclei were visualized by DAPI (blue). n = 5. (C)Mmd2+/+ versus Mmd2A117V/+; P = 0.0185, Mmd2+/+ versus Mmd2A117V/A117V; P = 0.0048. (D)Mmd2+/+ versus Mmd2A117V/+; P = 0.0004, Mmd2+/+ versus Mmd2A117V/A117V; P = 0.0018. (E) Relative fluorescence intensity: Mmd2+/+ versus Mmd2A117V/+; P = 0.0790, Mmd2+/+ versus Mmd2A117V/A117V; P = 0.0043, bacterial DNA in gingival tissues: Mmd2+/+ versus Mmd2A117V/+; P = 0.0036, Mmd2+/+ versus Mmd2A117V/A117V; P = 0.0108. (F)Mmd2+/+ versus Mmd2R127P/+; P = 0.0339, Mmd2+/+ versus Mmd2R127P/R127P; P = 0.0042. (G)Mmd2+/+ versus Mmd2R127P/+; P = 0.0018, Mmd2+/+ versus Mmd2R127P/R127P; P = 0.0002. (H) Relative fluorescence intensity: Mmd2+/+ versus Mmd2R127P/+; P = 0.0371, Mmd2+/+ versus Mmd2R127P/R127P; P = 0.0049, bacterial DNA in gingival tissues: Mmd2+/+ versus Mmd2R127P/+; P = 0.0090, Mmd2+/+ versus Mmd2R127P/R127P; P = 0.0185. (I)Mmd2+/+ versus Mmd2−/−; P = 0.0004). (J)Mmd2+/+ versus Mmd2−/−; P = 0.0002). (K) Relative fluorescence intensity: Mmd2+/+ versus Mmd2−/−; P = 0.0001, bacterial DNA in gingival tissues: Mmd2+/+ versus Mmd2−/−; P = 0.0466. (E, H, and K) Fluorescence in situ hybridization (FISH) for bacteria rRNA in gingival tissues at 24 h after ligation. Quantification for relative fluorescence intensity were analyzed by BZ-X800 Analyzer (Keyence) in a random field. Green = bacteria rRNA. n = 4–5. Scale bar = 100 μm. Relative amounts of bacteria 16S rDNA in the gingival tissues analyzed by qPCR. The average of 16S rDNA levels in the gingival tissues from Mmd2+/+ with ligatures was set as 1. Data are presented as mean ± SD. *P < 0.05, **P < 0.01, and ***P < 0.001 with one-way ANOVA with Tukey–Kramer test (A–H) or two-tailed unpaired t test (I–K). n.s = not significant. Each dot represents a biologically independent mouse. All representative images from more than three independent experiments with similar results.
Figure 5.
Figure 5.
Phosphorylation of ERK- and DIA-MS–based interaction assay. (A) The activation of ERK phosphorylation of neutrophils from Mmd2+/+, Mmd2−/−, Mmd2A117V/+, Mmd2A117V/A117V, Mmd2R127P/+, Mmd2R127P/R127P, and Mmd2V100L/V100L mice. Neutrophils were stimulated with fMLP for 0, 3, 5, and 10 min, and the cell lysate was used in immunoblotting, using antibodies against phosphorylated ERK and total ERK. The same experiment was carried out at least three times, and one set of representative data is shown. Data are presented as mean ± SD. **P < 0.01 and ***P < 0.001 with one-way ANOVA with Tukey–Kramer test. ns = not significant n = 3. 0 min versus 10 min in Mmd2+/+; P < 0.0001. 10 min in Mmd2+/+ versus 10 min in Mmd2A117V/+; P = 0.0816. 10 min in Mmd2+/+ versus 10 min in Mmd2R127P/+; P = 0.3123. 0 min versus 10 min in Mmd2+/+; P < 0.0001. 10 min in Mmd2+/+ versus 10 min in Mmd2−/−; P < 0.0001. 10 min in Mmd2+/+ versus 10 min in Mmd2A117V/A117V; P = 0.0033. 0 min versus 10 min in Mmd2V100L/V100L; P < 0.0001. 0 min versus 10 min in Mmd2A117V/A117V; P = 0.0006. 0 min versus 10 min in Mmd2R127P/R127P; P = 0.0006. (B) Mass spectrometry of interacting Ras proteins after immunoprecipitating MMD2. Binding of RAS to mutated MMD2. (C) To examine the interaction between MMD2 and RAS, co-immunoprecipitation analysis was performed by co-expressing Flag-tagged MMD2-WT or MMD2-mut with Myc-tagged NRAS or HRAS. As a control for co-IP, a sample immunoprecipitated with an anti-HA antibody was included. Additionally, co-immunoprecipitation was performed with RelA, which has not been reported to interact with RAS, as a negative control. MMD2-derived band is highlighted with blue arrowhead. Source data are available for this figure: SourceData F5.

References

    1. Abe, T., and Hajishengallis G.. 2013. Optimization of the ligature-induced periodontitis model in mice. J. Immunol. Methods. 394:49–54. 10.1016/j.jim.2013.05.002 - DOI - PMC - PubMed
    1. Alaluusua, S., Kivitie-Kallio S., Wolf J., Haavio M.L., Asikainen S., and Pirinen S.. 1997. Periodontal findings in Cohen syndrome with chronic neutropenia. J. Periodontol. 68:473–478. 10.1902/jop.1997.68.5.473 - DOI - PubMed
    1. Alipour, N., Salehpour S., Tonekaboni S.H., Rostami M., Bahari S., Yassaee V., Miryounesi M., and Ghafouri-Fard S.. 2020. Mutations in the VPS13B gene in Iranian patients with different phenotypes of cohen syndrome. J. Mol. Neurosci. 70:21–25. 10.1007/s12031-019-01394-w - DOI - PubMed
    1. Anjani, G., Vignesh P., Joshi V., Shandilya J.K., Bhattarai D., Sharma J., and Rawat A.. 2020. Recent advances in chronic granulomatous disease. Genes Dis. 7:84–92. 10.1016/j.gendis.2019.07.010 - DOI - PMC - PubMed
    1. Bailleul-Forestier, I., Monod-Broca J., Benkerrou M., Mora F., and Picard B.. 2008. Generalized periodontitis associated with Chédiak-Higashi syndrome. J. Periodontol. 79:1263–1270. 10.1902/jop.2008.070440 - DOI - PubMed

LinkOut - more resources