. 2025 Jul 24;68(14):14300-14311.
doi: 10.1021/acs.jmedchem.4c03180. Epub 2025 Jul 15.

Evaluating Naphthalene-Modified Metallosalen Complexes as Anticancer Agents

Affiliations

Evaluating Naphthalene-Modified Metallosalen Complexes as Anticancer Agents

Jemily Acosta-Mercado et al. J Med Chem. .

Abstract

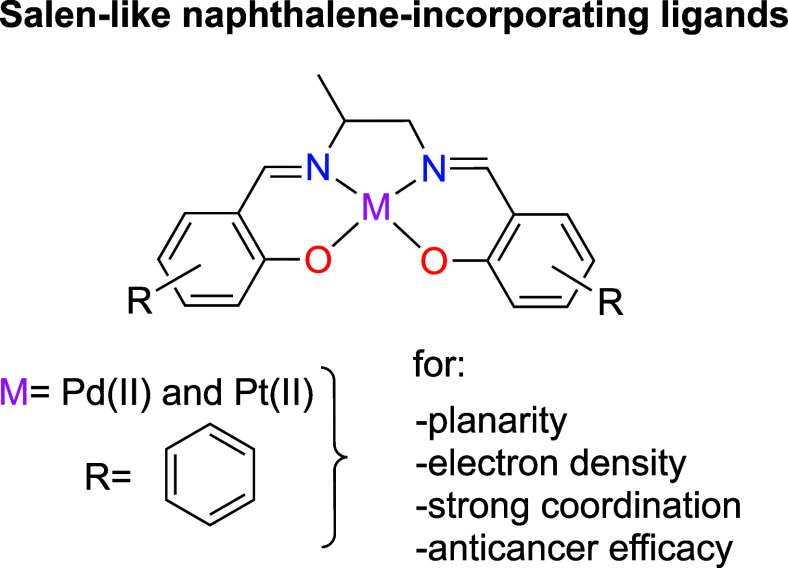
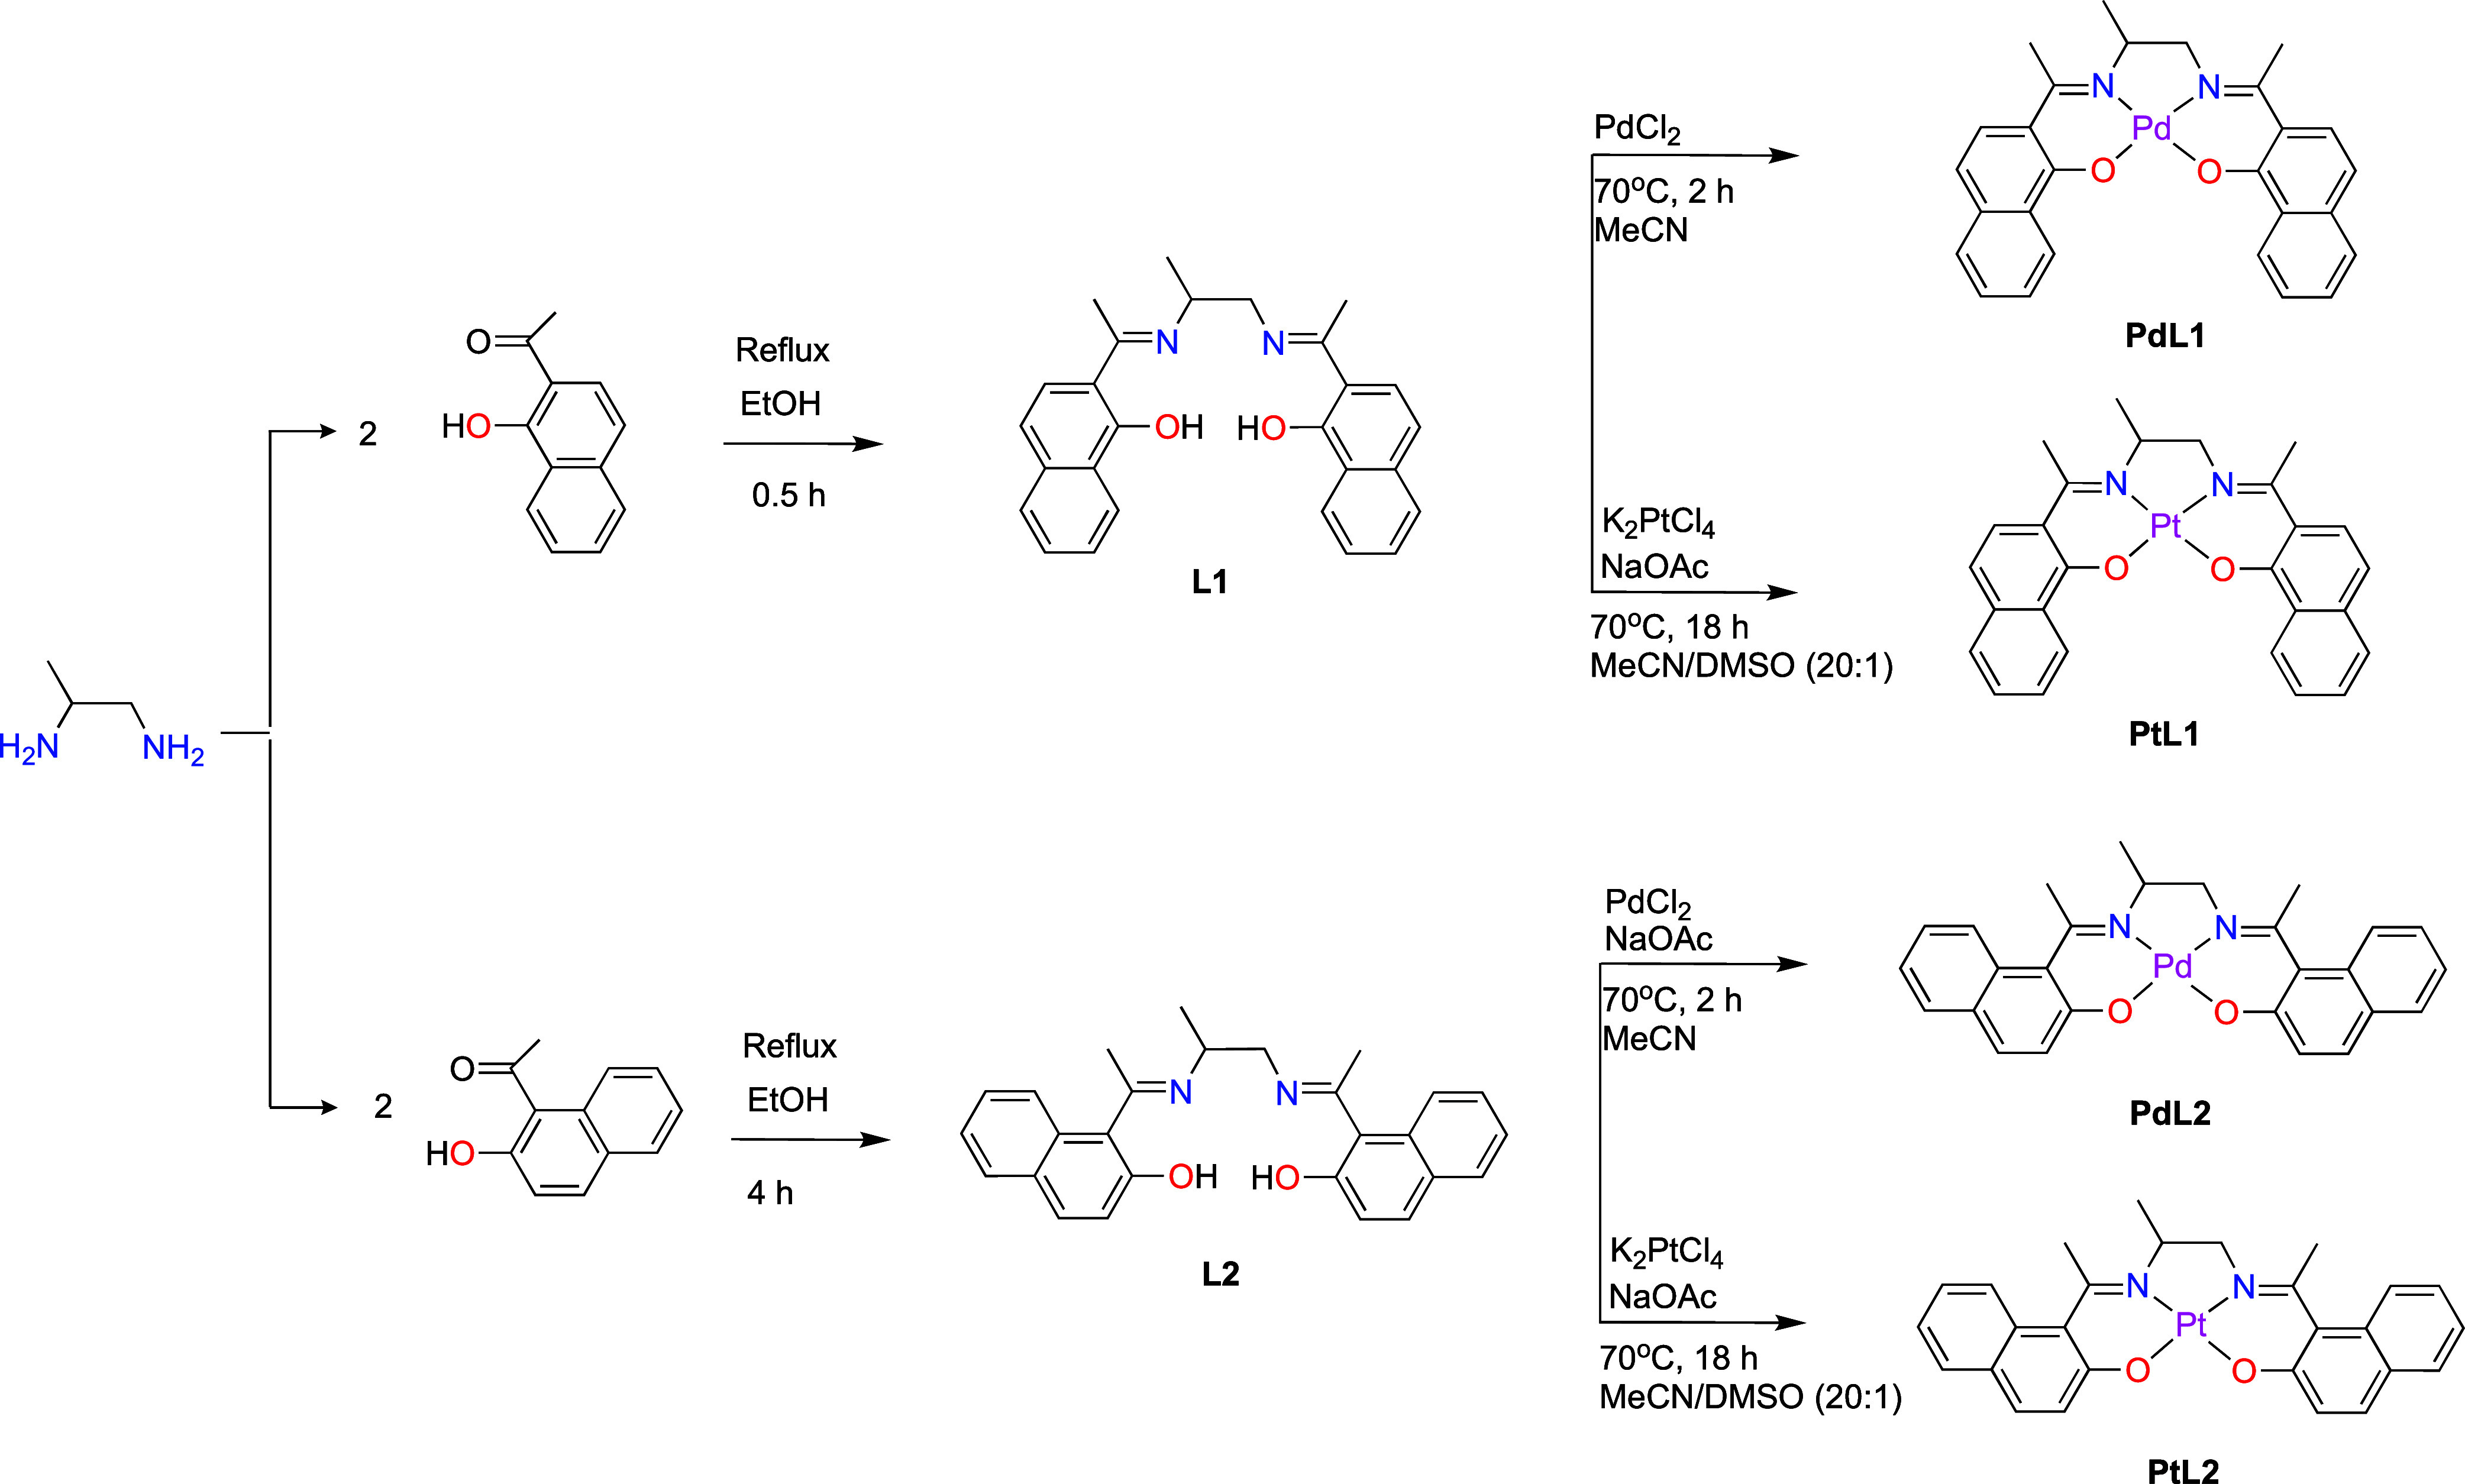
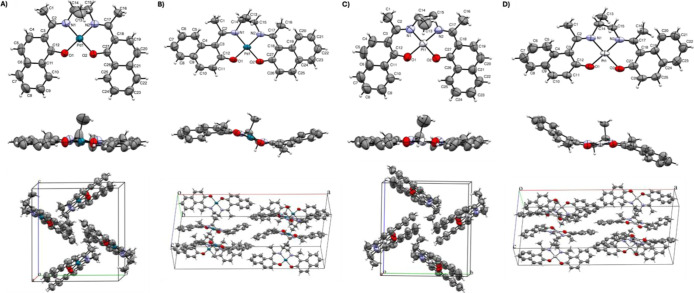
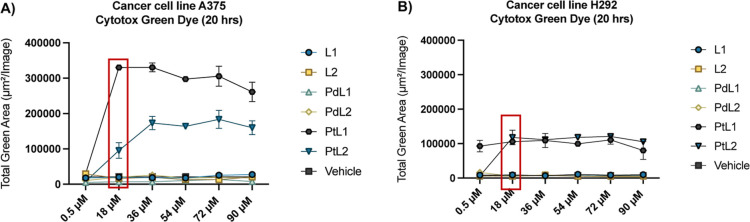
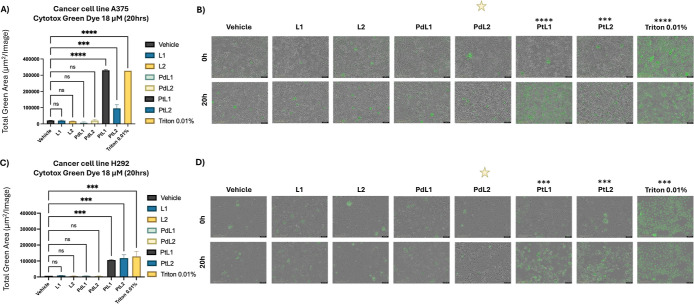
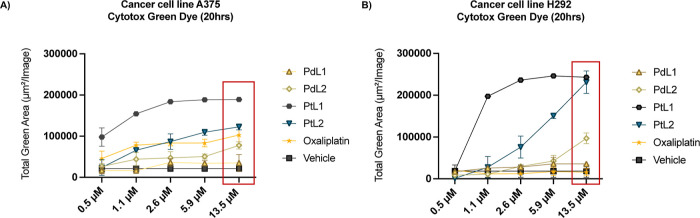
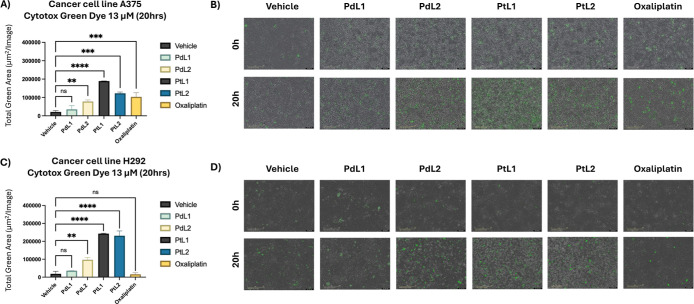
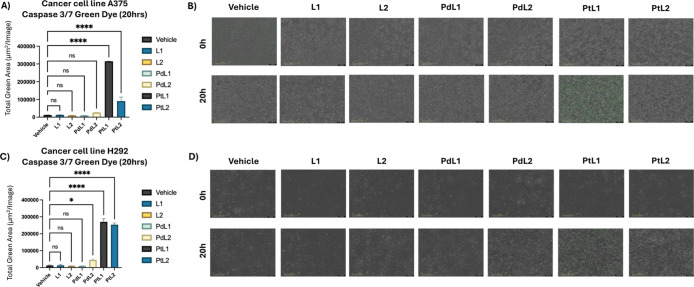
The development of novel naphthalene-modified metallosalens incorporating Pt(II) and Pd(II) presents a promising approach to addressing limitations in cancer therapies. These metallosalens were synthesized and characterized using single crystal X-ray diffraction (sc-XRD), UV-vis spectroscopy, nuclear magnetic resonance (NMR) spectroscopy, and C, H, N elemental analysis. Their strong metal coordination and enhanced electronic interactions, stemming from π-conjugated aromatic structures, improved their DNA-binding affinity and cytotoxic efficacy. Biological assays confirmed significant cytotoxicity in A375 (melanoma) and H292 (nonsmall cell lung cancer) cell lines, while demonstrating minimal toxicity toward HSAEC healthy lung cells. PtL1 and PtL2 exhibited superior activity, inducing apoptosis with high selectivity for cancer cells, as validated by Incucyte Caspase-3/7 Green Dye assays. These findings highlight the potential of naphthalene-modified metallosalens as broad-spectrum cancer therapies, balancing efficacy with reduced off-target effects, and underscore the importance of ligand design and metal coordination in advancing next-generation chemotherapeutics.


Figures

1
1
Representation of synthesized naphthalene-incorporating metallosalens. Coordination atoms are highlighted in blue and red, with metals shown in pink.
1
1. Synthetic Pathway to the Salen-Like Ligands L1 and L2 and the Corresponding Pt­(II) and Pd­(II) Complexes (PdL1, PdL2, PtL1, and PtL2)
2
2
Crystal structures of metallosalens: (A) PdL1 (2128741), (B) PdL2 (2450474), (C) PtL1 (2129562), and (D) PtL2 (2450470), showing front, side, and packing views along the b-axis. The structures are depicted as ORTEP diagrams at 50% probability, illustrating the thermal displacement ellipsoids of the atoms.
3
3
Cytotoxicity assessment using incucyte cytotox green. The graphs (A and B) illustrates the cytotoxicity induced by various treatments, including vehicle (DMSO 2% in media, negative control), L1, L2, PdL1, PdL2, PtL1, and PtL2 in the A375 (melanoma) and H292 (lung cancer) cell lines over a 20 h period at (0.5, 18, 36, 54, 72, 90) μM. Graphs represent the total green area, indicative of cell death, for each treatment at different concentration, expressed as mean ± SD. A red rectangle highlights the concentration of 18 μM, where the highest cytotoxicity was observed.
4
4
Cytotoxicity assessment using incucyte cytotox green against H292 and A375 cancer cell lines. This figure illustrates the cytotoxicity induced by various treatments, including vehicle (DMSO 2% in media, negative control), L1, L2, PdL1, PdL2, PtL1, PtL2, and Triton 0.01% (positive control), in the (A and B) A375 (melanoma) and (C and D) H292 (lung cancer) cell lines over a 20 h period at 18 μM. The graphs (A and C) represent the total green area, indicative of cell death, for each treatment, expressed as mean ± SD. Quantification of the total green area was achieved using Incucyte’s integrated image analysis tools, which capture fluorescence emitted by cells with compromised membranes, indicating cytotoxicity. Representative images (B and D) display the cells in real-time treatment at 0 and 20 h. A one-way ANOVA analysis of the total green area mean values revealed statistically significant differences between treatments, with p-values reported as 0.1234 (ns), 0.0332 (*), 0.0021 (**), 0.0002 (***), and <0.0001 (****). Yellow stars indicate regions of morphological changes without associated green fluorescence, characterized by a loss of cell adherence, suggesting structural alterations.
5
5
Cytotoxicity Comparison with Chemotherapy Agent Oxaliplatin. Graphs (A and B) show the cytotoxicity induced by various treatments, including vehicle (2% DMSO in media), PdL1, PdL2, PtL1, PtL2, and Oxaliplatin in the A375 and H292 cell lines over a 20 h period, with metallosalens tested at a 1:1 ratio to Oxaliplatin. These graphs represent the total green fluorescence area, indicating cell death, for each treatment at different concentrations, and are expressed as mean ± SD. A red rectangle highlights the 13.5 μM concentration, which will be further analyzed in bar graphs to compare the statistical significance between treatments in Figure .
6
6
Cytotoxicity Comparison with Chemotherapy Agent Oxaliplatin in H292 and A375 Cancer Cell Lines. This figure illustrates the cytotoxicity effects of various treatments, including vehicle control (DMSO 2% in media) PdL1, PdL2, PtL1, PtL2, and Oxaliplatin, in the (A and B) A375 and (C and D) H292 cell lines at a concentration of 13.5 μM over 20 h. The graphs (A and C) show the total green area, representing cell death, measured as mean ± SD for each treatment. Quantification was performed using Incucyte’s integrated image analysis, which detects fluorescence from cells with compromised membranes, a marker of cytotoxicity. Representative images of treated cells at 0 and 20 h are shown in panels (B and D). A one-way ANOVA analysis of the total green area mean values revealed statistically significant differences between treatments, with p-values reported as 0.1234 (ns), 0.0332 (*), 0.0021 (**), 0.0002 (***), and <0.0001 (****).
7
7
Caspase 3/7 Green Dye in H292 and A375 Cancer Cell Lines. This figure illustrates the effects of various treatments, including vehicle control (DMSO 2% in media), L1, L2, PdL1, PdL2, PtL1, and PtL2 in the (A and B) A375 and (C and D) H292 cell lines at a concentration of 9 μM over 20 h. The bar graphs (A and C) show the total green area, representing Caspase 3/7 activation, measured as mean ± SD for each treatment. The Caspase 3/7 Green Dye emits green fluorescence upon cleavage by activated caspases 3 and 7 during apoptosis. Quantification was performed using Incucyte’s integrated image analysis, which detects fluorescence from cells. Representative real-time images of treated cells at 0 and 20 h are shown in panels (B and D). A one-way ANOVA analysis of the total green area mean values revealed statistically significant differences between treatments, with p-values reported as 0.1234 (ns), 0.0332 (*), 0.0021 (**), 0.0002 (***), and <0.0001 (****).

Similar articles

References

    1. Mjos K. D., Orvig C.. Metallodrugs in Medicinal Inorganic Chemistry. Chem. Rev. 2014;114(8):4540–4563. doi: 10.1021/cr400460s. - DOI - PubMed
    1. Zhang C., Xu C., Gao X., Yao Q.. Platinum-Based Drugs for Cancer Therapy and Anti-Tumor Strategies. Theranostics. 2022;12(5):2115–2132. doi: 10.7150/thno.69424. - DOI - PMC - PubMed
    1. Manikandan R., Viswnathamurthi P.. Coordination Behavior of Ligand Based on NNS and NNO Donors with Ruthenium­(III) Complexes and Their Catalytic and DNA Interaction Studies. Spectrochim. Acta A Mol. Biomol Spectrosc. 2012;97:864–870. doi: 10.1016/j.saa.2012.07.028. - DOI - PubMed
    1. Todd R. C., Lippard S. J.. Inhibition of Transcription by Platinum Antitumor Compounds. Metallomics. 2009;1(4):280–291. doi: 10.1039/b907567d. - DOI - PMC - PubMed
    1. Wong E., Giandomenico C. M.. Current Status of Platinum-Based Antitumor Drugs. Chem. Rev. 1999;99(9):2451–2466. doi: 10.1021/cr980420v. - DOI - PubMed

MeSH terms