. 2025 Sep 1;224(9):e202505010.
doi: 10.1083/jcb.202505010. Epub 2025 Jul 15.

Nodal modulator (NOMO) is a force-bearing transmembrane protein required for muscle differentiation

Affiliations

Nodal modulator (NOMO) is a force-bearing transmembrane protein required for muscle differentiation

Brigitte S Naughton et al. J Cell Biol. .

Abstract

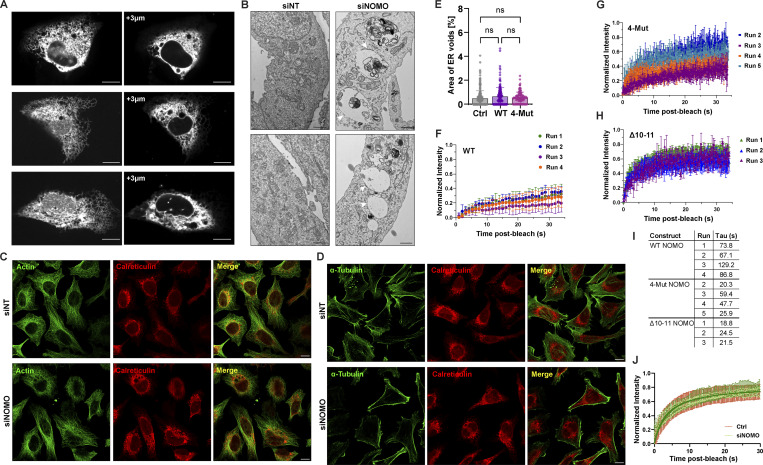
The ER relies on membrane-shaping proteins to maintain a continuous network of sheets and tubules that host distinct biological processes. How this intricate structure of the ER membrane system is maintained under conditions of mechanical strain is incompletely understood. NOMO is an ER-resident transmembrane protein that contributes to ER morphology and is highly expressed in striated muscle. In this study, we identify a critical interface between distal Ig domains that enables NOMO to maintain ER morphology and bear mechanical forces. By incorporating two independent tension sensors in the luminal domain of NOMO, we demonstrate that NOMO assemblies experience forces in the single piconewton range, with a significant contribution from the identified interface. These newly defined features are important-if not indispensable-for myogenesis, as interface mutations affecting mechanosensitivity fail to restore the essential role of NOMO during myogenesis in a C2C12 differentiation model. Moreover, NOMO depletion impairs nematode motility, underscoring a broader functional importance in muscle physiology.


Conflict of interest statement

Disclosures: All authors have completed and submitted the ICMJE Form for Disclosure of Potential Conflicts of Interest. J. Berro reported a patent to PCT/US2023/069505 pending. No other disclosures were reported.

Figures

Figure 1.
Figure 1.
Predicted structural features of NOMO. (A) An AlphaFold3 model prediction of FL human NOMO1 resolves twelve Ig-like folds, colored by Ig domains depicted as balls in the bottom right cartoon. NOMO1 is represented in two views related by a 180° rotation, as indicated. (B) Magnification of the interface formed by Ig 1/10/11 with D70-K927 and D121-R903 salt bridges labeled. (C) An alternative view of the Ig 1/10/11 interface with K66-D994-K931-E993 salt bridges labeled. (D) Ig 1–2 and Ig 10–11 interface conservation. Inset, ConSurf color-coding scheme from (1) variable to (9) conserved. (E) Sequence conservation of regions around and including the salt bridges shown in B and C, colored by >80% conservation. UniProt ID: Q15155.
Figure S1.
Figure S1.
NOMO structure predictions are confident and conserved. (A) AlphaFold3 models a highly confident structure of NOMO, colored by the per-residue confidence metric predicted local distance difference test (pLDDT) on a scale from 0 to 100, depicted in the legend inset. (B) Ig 1–2 and Ig 10–11 colored by pLDDT. (C) NOMO predicted aligned error (PAE) measuring the confidence of the relative position of two residues within the AlphaFold2 structure plot. (D) NOMO protein sequence conservation as predicted by ConSurf. Color scale is the same as in Fig. 1 E. (E) Representative distances in Å between distal regions in NOMO.
Figure 2.
Figure 2.
NOMO relies on the predicted Ig 1/10/11 interface for functionality. (A) Spinning disc confocal images of U2OS cells treated with either non-targeting (WT) or NOMO-targeting (siNOMO) RNAi. (B) Representative immunofluorescence images of U2OS cells treated with non-targeting siRNA (Ctrl) or NOMO-targeting siRNA (siNOMO), with indicated rescue constructs transfected in lower panels. (C) Immunoblot of cell lysates from experimental setups as in B. (D) Plot of mean ± SD of ER voids area normalized to total ER area determined by calreticulin staining under indicated conditions; n = 131 cells (Ctrl), n = 137 cells (siNOMO), n = 116 cells (siNOMO + F-NOMOr), and n = 115 cells (siNOMO + F-NOMOr4-Mut). (E and F) FRAP data showing means ± SD of fluorescence intensities of bleached regions normalized to the pre-bleach intensity for each condition. n ≥ 30 cells across a N ≥ 3 biological replicates. Note that NOMOWT data are the same in E and F. (G) Summary of mean tau (τ) values for each condition corresponding to FRAP experiments shown in E and F. Statistical analyses were performed using an ordinary one-way ANOVA test; ****P < 0.0001 and ns, not significant. Scale bars, 10 μm. Source numerical data and unprocessed blots are available in source data. Source data are available for this figure: SourceData F2.
Figure S2.
Figure S2.
NOMO depletion disrupts ER architecture and dynamics. (A) Spinning disc confocal microscopy images of U2OS cells under NOMO knockdown (siNOMO), showing z-stack projections at +3 µm from the basal plane shown at the left. Scale bars: 10 µm. (B) Transmission electron microscopy (TEM) images of control (siNT) and NOMO knockdown (siNOMO) U2OS cells. Arrows (black) denote ER; white arrowheads denote membrane delineated structures “voids” arising upon NOMO depletion. Scale bars: 1 µm. (C and D) Immunofluorescence images of HeLa cells under either non-targeting (siNT) or NOMO knockdown (siNOMO) conditions with calreticulin and the indicated cytoskeletal stain. (E) Quantification of void area in WT U2OS cells across conditions (Ctrl, WT NOMO, and 4-Mut NOMO). Data represent mean ± SD. Statistical significance was determined by an ordinary one-way ANOVA test; ns, not significant. (F–H) Superplots of FRAP data for WT NOMO, 4-Mut NOMO, and Δ10–11 NOMO constructs, with multiple biological replicates (Runs) displayed with a minimum of 10 cells per run. Each plot represents normalized fluorescence intensity over time after bleaching. (I) Table of FRAP recovery tau values (τ, in seconds) for indicated NOMO constructs across multiple experimental runs from E. (J) FRAP analysis of ER-localized Sec61β -GFP in control (Ctrl) and NOMO knockdown (siNOMO) cells. Source numerical data are available in source data.
Figure 3.
Figure 3.
Ig 12 and Ig 1011 dimerize and induce ER voids upon overexpression. (A) SDS-PAGE/Coomassie staining of constructs obtained from preparative SEC. (B and C) SEC profiles of recombinantly purified Ig 1–2 and Ig 10–11 on a HiLoad Superdex 75 pg. (D and E) ITC-binding studies of constructs used in A–C with dissociation constants (KD) and binding stoichiometry (n) indicated. n = 3 biological replicates. (F) Representative U2OS cells immunostained for the ER marker calreticulin and for either Ig 1–2-HA or Ig 10–11-FLAG expression. (G) Plot of mean void area relative to ER area per cell scored for the indicated construct expression. N = 113 untransfected cells (Ctrl), N = 103 Ig 10–11-FLAG–transfected cells, N = 105 WT Ig 1–2-HA–transfected cells, and N = 107 3-Mut Ig 1–2-HA–transfected cells from. Error bars denote ± SD. Statistical analyses were performed using an ordinary one-way ANOVA test; ****P < 0.0001, **P < 0.01, and ns, not significant. Scale bars, 10 μm. Source numerical data and unprocessed blots are available in source data. Source data are available for this figure: SourceData F3.
Figure S3.
Figure S3.
ITC replicates and co-IP with WT and 3-Mut Ig 1–2. (A) Isothermal titration calorimetry (ITC) replicates from Fig. 3 between WT Ig 1–2 and Ig 10–11. (B) ITC replicates for 3-Mut Ig 1–2 and Ig 10–11. Dissociation constants (KD) are indicated. n = 3 independent replicates were performed for each condition. (C) Immunoblot for expression of WT Ig 1–2-HA, 3-Mut Ig 1–2-HA, and Ig 10–11-FLAG in U2OS cells used for quantification in Fig. 3 G. (D) Co-immunoprecipitation (co-IP) analysis of interactions between HA-tagged Ig 1–2 constructs and WT or 4-Mut FL NOMO. Whole-cell lysates (input) and HA immunoprecipitates (IP: HA) were analyzed by immunoblot using antibodies against FLAG, NOMO, and HA. GAPDH serves as a loading control for input samples. Unprocessed blots are available in source data. Source data are available for this figure: SourceData FS3.
Figure 4.
Figure 4.
NOMO architecture is shaped by the Ig 1/10/11 interface. (A) SEC-MALS profile of FL WT NOMO (NOMO1WT-FLAG) on a Superose 6 column. The dashed line is the UV trace, molar mass represents the total molar mass of the PDC, and protein molar mass is the corrected molar mass to remove contribution from detergent. Inset, SDS-PAGE/Coomassie staining of the NOMO1WT-FLAG fraction obtained from preparative SEC. (B) SEC-MALS profile of the 4-mutant interface NOMO1 mutant, NOMO4Mut-FLAG, insert as in A. (C and D) Model representation drawn from the results shown in A and B. (E) Far-UV circular dichroism spectra of WT (blue) and 4-Mut (red) NOMO LD in the native conformation, and 6 M guanidine hydrochloride (GuHCl) treatment to induce unfolding (WT, tan; 4-mutant, light blue), as indicated by the loss of secondary structure. Curves represent normalized mean ± SD of n = 3 replicates. SEC-MALS, SEC linked to multi-angle light scattering. PDC, protein detergent complex. Source data are available for this figure: SourceData F4.
Figure 5.
Figure 5.
NOMO is under single pN forces partly dependent on the Ig 1/10/11 interface. (A) Illustration of the TEV cleavage-based readout. (B) Representation of the 5 pN and 10 pN coiled-coil (cc) sensors and their location between Igs 11 and 12 in WT and 4-mutant NOMO. (C) Immunofluorescence images of WT or 4-Mut FLAG-NOMO in either the absence (−) or presence (+) of TEVp. (D) Representative immunoblot of indicated cc-force sensors inserted in WT and 4-mutant NOMO when TEVp is absent or present (+). (E) Quantification of fraction of the indicated FLAG-NOMO construct cleaved under the absence (−) and presence (+) of TEVp. N = 8. Each condition was measured from n = 6 biological replicates. Statistical analyses were performed using an ordinary one-way ANOVA test; ****P < 0.0001. Source numerical data, immunoblot replicates, and unprocessed blots are available in source data. Source data are available for this figure: SourceData F5.
Figure 6.
Figure 6.
Force on NOMO is modulated by ER sheet spacing and cell migration. (A) Depiction of the FRET-based force sensor. (B) Rendering of the FRET sensor inserted within (TSin) constructs. Spheres depict Ig domains of NOMO, while a helix represents the coiled-coil topology of CLIMP-63. (C) Plots of normalized mean FRET efficiency ± SD for a TS only control, CLIMP-63 with TS inserted in the LD prior to the TM domain (CLIMP-63-TSin), WT NOMO with TS inserted in the LD prior to the TM domain (NOMO-TSin) or between Ig 11-12 (NOMO-TS11-TS-12), and 4-mutant NOMO (NOMO4-Mut-TSin). (D) Normalized mean FRET efficiency for NOMO-TSin as in C or with CLIMP-63 silenced (siCLIMP-63) or overexpressed (F-CLIMP-63). NOMO-TSin data are the same in C and D. (E) Schematic representation of the MEF3T3 wound migration assay. Cells at the wound edge extend protrusions and migrate into the gap, while interior confluent cells remain distal to the wound site. Arrows indicate the direction of migration. (F) NOMO-TSin in MEF3T3 cells either migrating into a wound (Edge) or in a confluent area away from the wound (Internal). For all plots, errors reflect SD; n ≥ 30 cells for each condition measured from n ≥ 3 experiments. Statistical analyses were performed using a two-tailed unpaired Mann–Whitney test (F) or ordinary one-way ANOVA (C and D); ****P < 0.0001, ***P < 0.001, *P < 0.05, and ns, not significant. Source numerical data are available in source data.
Figure S4.
Figure S4.
Normalized expression of NOMO1 in tibialis anterior muscle biopsies and C2C12 differentiation in NOMO knockout cells. (A) Dorsiflexion strength was measured in control and DM1 patients against NOMO transcript levels (R = −0.59). proto-DM1, an intermediate form of DM1 corresponding to fewer CTG repeats (50–100) than DM1 (>100) or healthy controls (<30). (B) Myogenesis was performed as in Fig. 6 A and immunostained for Myhc and stained for DNA with DAPI. (C) Immunoblot of control or NOMO-depleted (siNomo) myoblasts during indicated days of differentiation. (D) Assay performed as in B, with myoblasts stably expressing either WT (F-NOMOWT) or 4-Mut (F-NOMO4-Mut) constructs in Nomo knockout lines. (E) Quantification of myogenesis under indicated conditions, scored by fusion index. n = 21 frames, 2,433 nuclei (Ctrl), n = 10 frames, 1,411 nuclei (Nomo KO), n = 16 frames, 1,207 nuclei (Nomo KO, WT rescue), and n = 16 frames, 1,717 nuclei (Nomo KO, 4-Mut rescue). (F) Immunoblot comparing protein levels in control (Ctrl) and Nomo knockdown (siNomo) conditions during differentiation. Samples were collected at multiple time points up to day 3 of differentiation. Immunoblot analysis of myogenic markers in control and siNomo-treated cells over 4 days. (G) cDNA obtained from the indicated treated myotubes during day 1 or day 3 of differentiation, amplified via PCR using XBP-1–specific primers, separated by agarose, and stained with SYBR Safe. (H and I) Immunoblot of siRNA knockdown efficiency for Climp-63 and calnexin. GAPDH serves as a loading control. (J) Immunoblot analysis of nra-4 in Ctrl (L4440) and knockdown conditions and probed with anti-NOMO antibody. Statistical analyses were performed using an ordinary one-way ANOVA test; ****P < 0.0001, *P < 0.05, and ns, not significant. Error bars show min. to max. point range. All scale bars, 50 μm. Source numerical data and unprocessed blots are available in source data. Source data are available for this figure: SourceData FS4.
Figure 7.
Figure 7.
NOMO is required for myogenesis and depends on the Ig 1/10/11 interface. (A) Cartoon representation of C2C12 myogenesis, whereby myoblasts exit the cell cycle to differentiate into myocytes, which then fuse to form multinucleated myotubes expressing Myhc. (B) Fixed myotubes stained for Myhc and DAPI (DNA) 3 days after differentiation induction; left scale bars, 50 μm; right scale bars, 10 μm. (C) Electron micrograph of cells treated with either non-targeting (Ctrl) or Nomo siRNA (siNomo) during myoblast differentiation. (D) Representative images of the differentiation assay performed as in A, with myoblasts stably expressing siRNA-resistant F-NOMOr (WT) or F-NOMOr4-Mut (4-Mut) constructs under Nomo knockdown. (E) Myogenesis quantification of conditions shown in B and C, scored by the mean fraction of 3+ nuclei in Myhc-expressing myotubes (fusion index). N = 21 frames, 2,788 nuclei (Ctrl), N = 21 frames, 2,677 nuclei (siNomo), N = 16 frames, 1,957 nuclei (siNomo, WT rescue), and N = 18 frames, 2,457 nuclei (siNomo, 4-Mut rescue) from n = 3 biological replicates. Statistical analyses were performed using an ordinary one-way ANOVA test; ****P < 0.0001, **P < 0.01, and *P < 0.05. Source numerical data are available in source data.
Figure 8.
Figure 8.
Myogenesis defect is specific to NOMO rather than general ER dysfunction. (A) Bright-field images showing myogenic differentiation over 4 days (day −3 to day 3) following siRNA-mediated knockdown of Nomo, Climp-63, calnexin, or Rtn3, with non-targeting (NT) control. Immunofluorescence images on day 3 show myotubes with Myhc (red) and DAPI (blue). Scale bar: 50 µm. (B) qPCR validation of knockdowns from A. (C) Quantification of the mean fusion index ± SD, representing the proportion of 2+ nuclei within Myhc-positive myotubes. N = 1,441 nuclei (siNT), N = 1,450 nuclei (siNomo), N = 1,653 nuclei (siClimp-63), N = 1,658 nuclei (siCalnexin), and N = 1,888 nuclei (siRtn3). Each condition was measured from n = 3 biological replicates. (D) Motility analysis measured by body bends per second (BBPS) of C. elegans challenged with either non-targeting (L4440) (n = 58) or nra-4–directed RNAi (n = 64). Data show mean ± SD from n = 3 biological replicates. Statistical analyses were performed using one-way ANOVA (C) or a two-tailed unpaired Mann–Whitney (D); ****P < 0.0001, **P < 0.01, and *P < 0.05. Source numerical data are available in source data.
Figure S5.
Figure S5.
ER, actin, and Myhc morphology effects under NOMO knockdown. (A) Myoblast cells 3 days before differentiation (day −3) and after differentiation (day 3), immunostained for Myhc and ER marker BiP. (B) Conditions as in A, probed for actin by FITC-phalloidin.
Figure 9.
Figure 9.
Models of NOMO assembly in the ER. NOMO dimerization is represented in cis in models I and II and in trans in models III and IV. These models serve as the basic building blocks of NOMO oligomerization. The Ig 1/10/11 interface (yellow sliver) is shown intramolecularly in I and III and intermolecularly in II and IV. Ig domains are represented as circles, with Ig 1 and Ig 10 colored blue and orange, respectively.

Similar articles

Cited by

References

    1. Abramson, J., Adler J., Dunger J., Evans R., Green T., Pritzel A., Ronneberger O., Willmore L., Ballard A.J., Bambrick J., et al. 2024. Accurate structure prediction of biomolecular interactions with AlphaFold 3. Nature. 636:E4. 10.1038/s41586-024-08416-7 - DOI - PMC - PubMed
    1. Amaya, C., Cameron C.J.F., Devarkar S.C., Seager S.J.H., Gerstein M.B., Xiong Y., and Schlieker C.. 2021. Nodal modulator (NOMO) is required to sustain endoplasmic reticulum morphology. J. Biol. Chem. 297:100937. 10.1016/j.jbc.2021.100937 - DOI - PMC - PubMed
    1. Ashkenazy, H., Abadi S., Martz E., Chay O., Mayrose I., Pupko T., and Ben-Tal N.. 2016. ConSurf 2016: An improved methodology to estimate and visualize evolutionary conservation in macromolecules. Nucleic Acids Res. 44:W344–W350. 10.1093/nar/gkw408 - DOI - PMC - PubMed
    1. Budzik, J.M., Poor C.B., Faull K.F., Whitelegge J.P., He C., and Schneewind O.. 2009. Intramolecular amide bonds stabilize pili on the surface of Bacilli. Proc. Natl. Acad. Sci. USA. 106:19992–19997. 10.1073/pnas.0910887106 - DOI - PMC - PubMed
    1. Carley, E., Stewart R.M., Zieman A., Jalilian I., King D.E., Zubek A., Lin S., Horsley V., and King M.C.. 2021. The LINC complex transmits integrin-dependent tension to the nuclear lamina and represses epidermal differentiation. Elife. 10:e58541. 10.7554/eLife.58541 - DOI - PMC - PubMed

Substances

LinkOut - more resources