. 2025 Jul 15;42(5):40.
doi: 10.1007/s10585-025-10362-1.

Loss of IL13RA2 promotes metastatic tumor growth in triple-negative breast cancer via increased AKT and NF-κB signaling

Affiliations

Loss of IL13RA2 promotes metastatic tumor growth in triple-negative breast cancer via increased AKT and NF-κB signaling

Wendy E Bindeman et al. Clin Exp Metastasis. .

Abstract

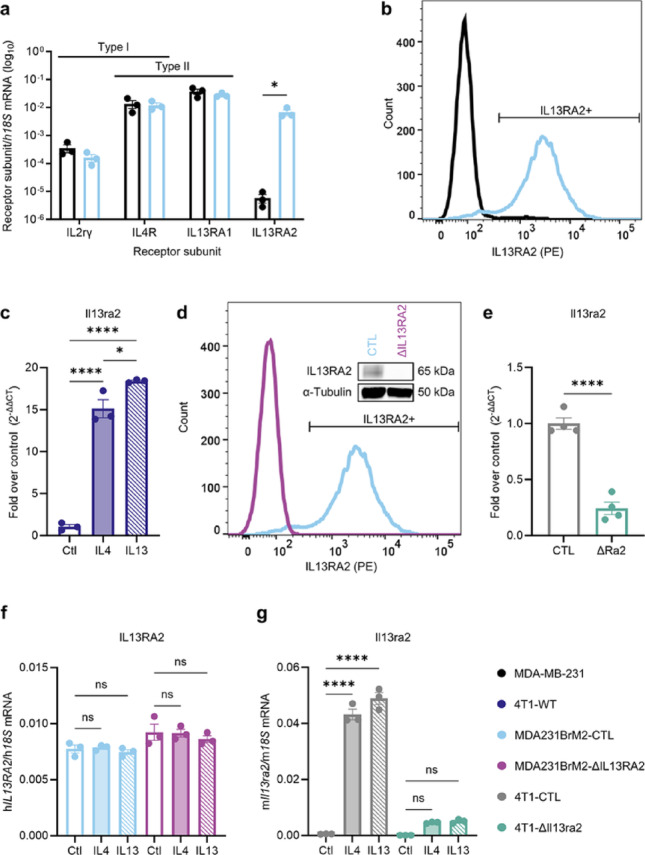
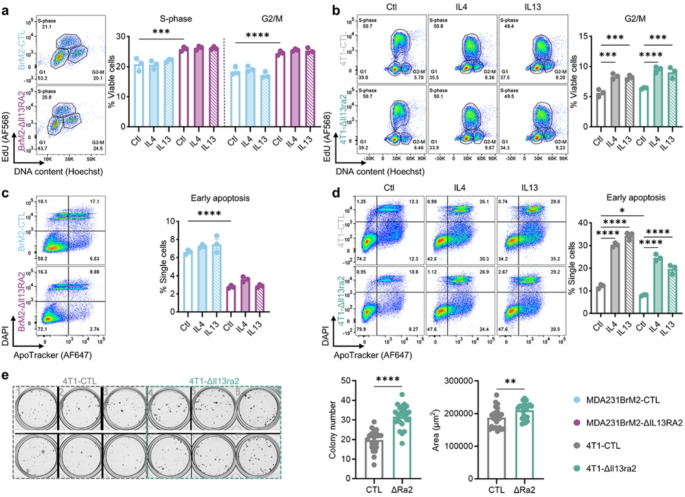
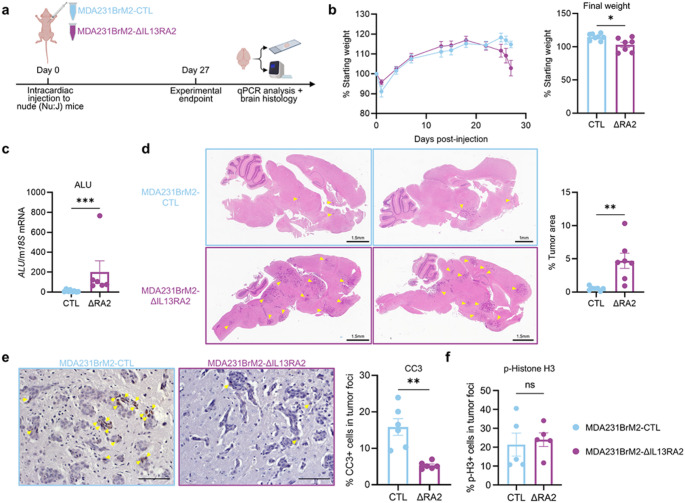
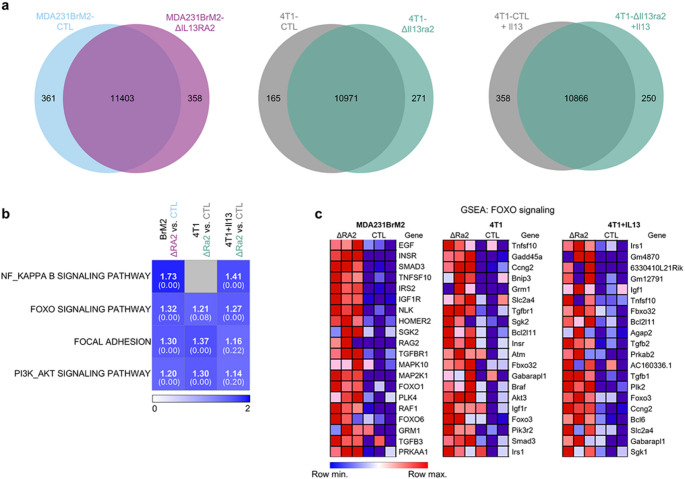
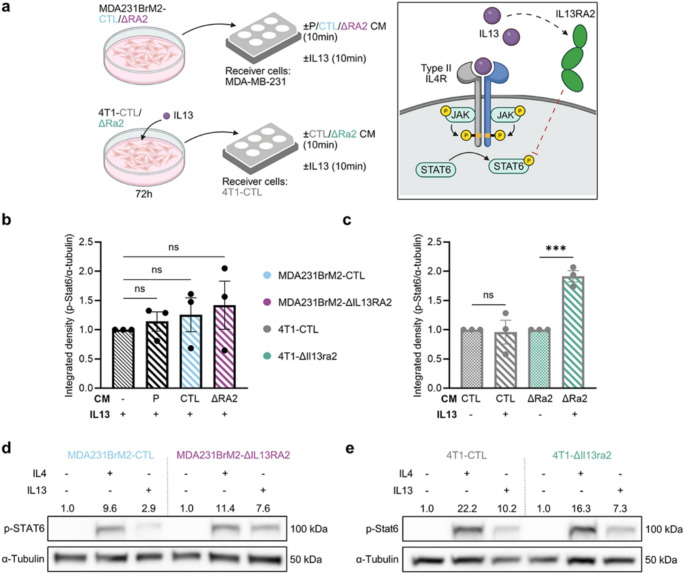
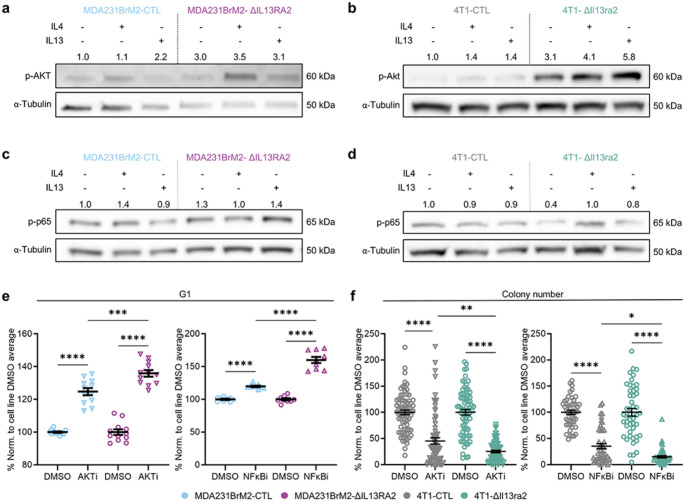
Triple-negative breast cancer is associated with poor patient prognosis and high rates of distant metastasis. These patients are at elevated risk of brain metastasis, which remains a major therapeutic challenge. IL13RA2, a high-affinity receptor for IL13, is highly expressed in primary brain cancers, many extracranial solid tumors, and in lung- and brain-seeking metastatic variant cell lines. However, the relationship between IL13RA2 and patient prognosis is variable, and the biological function of this receptor in cancer remains controversial. We sought to define the role of IL13RA2 in triple-negative breast cancer growth and metastasis, with an emphasis on breast-to-brain metastasis. We generated IL13RA2-CRISPR knockout derivatives of the human brain-seeking breast cancer cell line MDA231BrM2, as well as murine 4T1 cells, and evaluated changes in gene expression, proliferation, survival, and metastatic growth in vivo. Both IL13RA2-deficient models demonstrate enhanced cell survival in vitro, as well as augmented metastatic tumor growth and worsened animal survival in intracardiac models of brain metastasis. Concordantly, elevated IL13RA2 mRNA expression is positively correlated with overall survival in patients with basal-like breast cancer. Mechanistically, IL13RA2-deficient cells exhibit increased AKT and NF-κB signaling. These cells are sensitive to inhibition of either pathway, but especially AKT, which may represent a clinically useful vulnerability for patients with IL13RA2-low tumors. Our data suggest that inhibition of IL13RA2, though promising in other tumor contexts, may be deleterious in metastatic triple-negative breast cancer.

Keywords: AKT; Brain metastasis; IL13RA2; NF-κB; Signaling; Triple-negative breast cancer.


Conflict of interest statement

Declarations. Ethics approval: All animal studies were approved by Vanderbilt’s Institutional Animal Care and Use Committee (protocol M2300038-00). Competing interests: Barbara Fingleton is a member of the editorial board for Clinical and Experimental Metastasis.

Figures

Fig. 1
Fig. 1
IL13RA2 is elevated in brain-seeking TNBC cells, conditionally expressed in a murine model of TNBC, and can be successfully deleted from both cell lines. a Comparison of transcript levels of IL13RA2, type I IL4 receptor components, and type II IL4 receptor components in MDA231BrM2-CTL, a brain-seeking TNBC line, and non-brain-seeking MDA-MB-231. Data shown as unnormalized averages from three separate experiments. Statistical significance was determined by an unpaired t-test with *p < 0.05 (n = 3). Non-significant comparisons omitted for clarity. b Comparison of IL13RA2 protein levels in MDA231BrM2-CTL (IL13RA2+: 92.6%) and MDA-MB-231 (IL13RA2+: 2.83%). Representative data (n = 4). c Comparison of Il13ra2 transcript levels in wild-type 4T1 (4T1-WT) cells following stimulation with IL4 or IL13. Representative data from three internal biological replicates shown (n = 1 independent experiment in 4T1-WT; phenotype re-confirmed in 4T1-CTL, see (f)). d Validation of IL13RA2 deletion in MDA231BrM2-ΔIL13RA2 by Western blot (inset, n = 2) and flow cytometry (n = 3). IL13RA2+: 92.6% in MDA231BrM2-CTL; 0.060% in MDA231BrM2-ΔIL13RA2. e Validation of Il13ra2 deletion in 4T1-ΔIl13ra2 by qPCR. Statistical significance was determined by an unpaired t-test with ****p < 0.0001 (n = 4). f Evaluation of IL13RA2 transcript levels in MDA231BrM2-CTL and MDA231BrM2–ΔIL13RA2 following IL4/IL13 stimulation. g Evaluation of Il13ra2 transcript levels in 4T1-CTL vs. 4T1-ΔIl13ra2 following IL4/IL13 stimulation. f, g Representative data shown (n = 3 independent experiments). IL4, 10ng/mL; IL13, 20ng/mL, 48 h. Statistical significance was determined by one-way ANOVA with Šídák’s multiple comparisons test with ****p < 0.0001 and ns, non-significant (p > 0.05). All error bars show SEM
Fig. 2
Fig. 2
Loss of IL13RA2 confers a survival and growth advantage to TNBC cells in vitro. a Representative flow plots (left) and quantification (right) of the percentage of MDA231BrM2-CTL and ΔIL13RA2 in S-phase and G2/M by EdU/DNA-content stain after 72 h incubation in 2% media ± IL4 (10 ng/mL) or IL13 (20 ng/mL). Representative data (3 wells/group, n = 3 independent experiments). b Representative flow plots (left) and quantification (right) of the percentage of 4T1-CTL and ΔIl13ra2 in G2/M by EdU/DNA-content stain after 72 h incubation in 2% media ± IL4 (10 ng/mL) or IL13 (20 ng/mL). Representative data (3 wells/group, n = 3). c Representative flow plots (left) and quantification (right) of MDA231BrM2-CTL and ΔIL13RA2 in early apoptosis as measured by ApoTracker assay after 72 h incubation in 2% media ± IL4 (10 ng/mL) or IL13 (20 ng/mL). Representative data (3 wells/group, n = 3). d Representative flow plots (left) and quantification (right) of 4T1-CTL and ΔIl13ra2 in early apoptosis as measured by ApoTracker assay after 72 h incubation in 2% media ± IL4 (10 ng/mL) or IL13 (20 ng/mL). Representative data (3 wells/group, n = 3). In (a–d), statistical significance was determined by one-way ANOVA with Šídák’s multiple comparisons test with ****p < 0.0001, ***p < 0.001, and *p < 0.05. Non-significant comparisons omitted for clarity. e Comparison of colony formation by 4T1-CTL and 4T1-ΔIl13ra2. 200 cells/well seeded in 2% media and cultured for 6 days. Representative data shown; each dot represents an individual well (12–24 wells/group, n = 2 independent experiments). Statistical significance was determined by an unpaired t-test with ****p < 0.0001 and **p < 0.01. All error bars show SEM
Fig. 3
Fig. 3
Tumor cell IL13RA2 deficiency increases mouse weight loss and brain metastatic burden following intracardiac injection. a Schematic of experimental workflow. b (Left) Comparison of animal weight loss (as percentage of starting weight) over time between MDA231BrM2-CTL and MDA231BrM2-ΔIL13RA2-injected animals (CTL: n = 8; ΔIL13RA2: n = 7). (Right) Comparison of animal weight loss (as percentage of starting weight) at the experimental endpoint (CTL: n = 8; ΔIL13RA2: n = 7). c Quantification of brain tumor burden at experimental endpoint by qPCR detection of human-specific ALU sequence (CTL: n = 8; ΔIL13RA2: n = 6). d (Left) Representative images of brain metastases in MDA231BrM2-injected mice; tumor foci are indicated with yellow arrowheads. Right, quantification of percent tumor area (CTL: n = 7; ΔIL13RA2: n = 7). e Representative images (left) and quantification (right) of cleaved caspase-3 (CC3) in MDA231BrM2-CTL and MDA231BrM2-ΔIL13RA2 brain metastases (n = 6 mice per group). CC3-positive cells are indicated with yellow arrowheads. f Quantification of phospho-histone H3 (p-H3) in MDA231BrM2-CTL and MDA231BrM2-ΔIL13RA2 brain metastases (n = 5 mice per group). Scale bars, 100 μm. Statistical significance was determined by Mann–Whitney tests with *p < 0.05, **p < 0.01, and ***p < 0.001. All error bars show SEM
Fig. 4
Fig. 4
Bulk RNA-Seq identifies enrichment of survival-related pathways in IL13RA2-deficient cells. a A subset of genes is differentially expressed in ΔIL13RA2 cells as compared to their respective controls. b Heatmap showing normalized enrichment scores (NES) for the top 4 signaling pathways identified in ΔIL13RA2 cells across the three tested models (MDA231BrM2, 4T1 ± IL13) by gene set enrichment analysis (GSEA). The nominal p-value for each pathway is indicated in parentheses under the NES. Heatmap generated using Morpheus (https://software.broadinstitute.org/morpheus). Absolute color scale (0–2). c Heatmap showing relative gene enrichment levels for the top 20 genes in the FOXO pathway identified by GSEA in each dataset
Fig. 5
Fig. 5
IL13RA2 has minimal decoy effect despite production of soluble decoy receptor by 4T1. a (Left) Schematic depicting experimental design to interrogate the contribution of soluble IL13RA2 to our system. CM, conditioned media. Lysates were collected and probed for p-STAT6 as a readout of IL13 signaling through type II IL4R. (Right) If soluble decoy IL13RA2 is present, IL13-induced p-STAT6 signal will be reduced. b Quantification of p-STAT6 signal intensity in MDA-MB-231 treated ± conditioned media taken from MDA231BrM2-CTL (CTL) or MDA231BrM2-ΔIL13RA2 (ΔRA2) for 10 min followed by IL13 (20ng/mL) for 10 min where indicated (n = 3). p-STAT6 normalized to α-tubulin and compared to signal strength in IL13-only condition. c Quantification of p-Stat6 signal intensity in 4T1-CTL treated ± conditioned media taken from IL13-treated 4T1-CTL (CTL) or 4T1-ΔIl13ra2 (ΔRa2) for 10 min followed by IL13 (20ng/mL) for 10 min where indicated (n = 3). p-Stat6 normalized to α-tubulin. Due to presence of residual IL13 in the conditioned media, signal strength in CM + IL13 condition is compared against the matching CM-only condition. b, c Statistical significance was determined by unpaired t-tests with ***p < 0.001 and ns, p > 0.05. Error bars show SEM. d p-STAT6 signal in IL4/IL13-treated MDA231BrM2-CTL and ΔIL13RA2. e p-Stat6 signal in IL4/IL13 treated 4T1-CTL and ΔIl13ra2. IL4, 10ng/mL; IL13, 20ng/mL; 20 min. p-STAT6 normalized to α-tubulin and compared to signal strength in respective untreated CTL. Representative blots (n = 3 per cell line)
Fig. 6
Fig. 6
NF-κB and AKT signaling is altered in IL13RA2-deficient cells. a p-AKT signal in IL4/IL13-treated MDA231BrM2-CTL and ΔIL13RA2. Global image maxima of p-AKT blots were decreased to visualize bands for quantification due to faint signal; blot used for quantification shown. Normalized band intensities are shown above each lane. Representative blots (n = 3). b p-AKT signal in IL4/IL13-treated 4T1-CTL and ΔIl13ra2. Global image maxima of p-AKT blots were decreased to visualize bands for quantification due to faint signal; quantified images shown. Normalized band intensities are shown above each lane. Representative blots (n = 3). c p-p65 signal in IL4/IL13-treated MDA231BrM2-CTL and ΔIL13RA2. Normalized band intensities are shown above each lane. Representative blots (n = 2). d p-p65 signal in IL4/IL13-treated 4T1-CTL and ΔIl13ra2. Normalized band intensities are shown above each lane. Representative blots (n = 2). a–d IL4, 10ng/mL; IL13, 20ng/mL, 20 min. Band intensity normalized to α-tubulin and compared to signal strength in respective untreated CTL line. e Percentage of cells in G1 by EdU/DNA content stain as normalized to the average of the corresponding cell line vehicle control after 72 h exposure to ipatasertib (AKTi,15µM), BMS-345,541 (NF-κBi, 1µM), or DMSO (vehicle). Each point represents an individual well (3 wells/group; ipatasertib, n = 4 independent experiments; BMS-345541, n = 3). f Colony formation by 4T1-CTL and 4T1-ΔIl13ra2 in presence of ipatasertib (AKTi, 2.5µM), BMS-345,541 (NF-κBi, 1µM), or DMSO (vehicle). Data normalized to average of the corresponding cell line vehicle control. 200 cells/well seeded in 2% media and cultured for 6 days. Each point represents an individual well (24 wells/group; ipatasertib, n = 3; BMS-345541, n = 2). e, f Statistical significance was determined by one-way ANOVA with Šídák’s multiple comparisons test with ****p < 0.0001, ***p < 0.001, **p < 0.01, *p < 0.05. All error bars show SEM

Similar articles

References

    1. Cancer Stat Facts: Female Breast Cancer Subtypes (SEER 22 2017–2021) National Cancer institute. https://www.seer.cancer.gov. Accessed 5 December 2024
    1. Triple Negative Breast Cancer (2021) PathologyOutlines.com. https://www.pathologyoutlines.com/topic/breastmalignanttripleneg.html. Accessed 15 February 2025
    1. Costa RLB, Gradishar WJ (2017) Triple-negative breast cancer: current practice and future directions. J Oncol Pract 13(5):301–303. 10.1200/jop.2017.023333 - PubMed
    1. Wu X, Baig A, Kasymjanova G, Kafi K, Holcroft C, Mekouar H et al (2016) Pattern of local recurrence and distant metastasis in breast cancer by molecular subtype. Cureus 8(12):e924. 10.7759/cureus.924 - PMC - PubMed
    1. Ostrom QT, Wright CH, Barnholtz-Sloan JS (2018) Chap. 2: brain metastases: epidemiology. In: Schiff D, Van den Bent MJ (eds) Handbook of clinical neurology. Elsevier, pp 27–42 - PubMed

MeSH terms

Substances

LinkOut - more resources