. 2025 Jul 15;10(16):e193091.
doi: 10.1172/jci.insight.193091. eCollection 2025 Aug 22.

Elevated tumor NOS2/COX2 promotes immunosuppressive phenotypes associated with poor survival in ER- breast cancer

Affiliations

Elevated tumor NOS2/COX2 promotes immunosuppressive phenotypes associated with poor survival in ER- breast cancer

Lisa A Ridnour et al. JCI Insight. .

Abstract

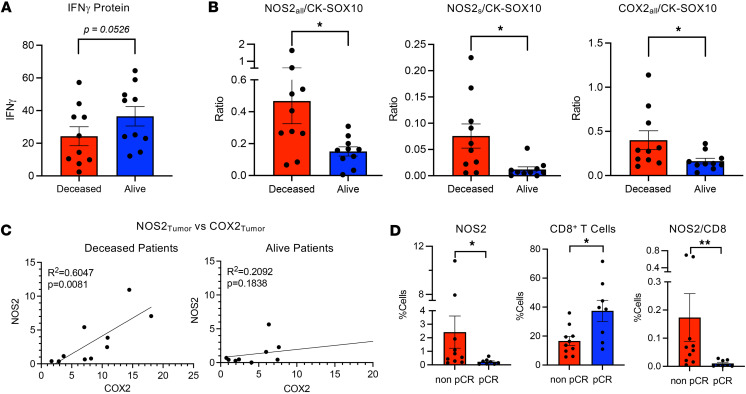
Tumor immunosuppression affects survival and treatment efficacy. Tumor NOS2/COX2 coexpression strongly predicts poor outcome in estrogen receptor-negative (ER-) breast cancer by promoting metastasis, drug resistance, cancer stemness, and immune suppression. Herein, a spatially distinct NOS2/COX2 and CD3+CD8+PD1- T effector (TEff) cell landscape correlated with poor survival in ER- tumors. NOS2 was primarily expressed at the tumor margin, whereas COX2 together with B7H4 was associated with immune desert regions lacking TEff cells, where a higher ratio of tumor NOS2 or COX2 to TEff cells predicted poor survival. Also, programmed cell death ligand 1/programmed cell death 1, regulatory T cells (TRegs), and IDO1 were primarily associated with stroma-restricted TEff cells. Regardless of the survival outcome, CD4+ T cells and macrophages were primarily in stromal lymphoid aggregates. Finally, in a 4T1 model, COX2 inhibition led to increased CD8+ TEff/CD4+ TReg ratio and CD8+ TEff infiltration while Nos2 deficiency had no significant effect, thus reinforcing our observations that COX2 is an essential component of immunosuppression through CD8+ TEff cell exclusion from the tumor. Our study indicates that tumor NOS2/COX2 expression plays a central role in tumor immune evasion, suggesting that strategies combining clinically available NOS2/COX2 inhibitors with immune therapy could provide effective options for the treatment of aggressive and drug-resistant ER- breast tumors.

Keywords: Adaptive immunity; Inflammation; Oncology; T cells.


Figures

Figure 1
Figure 1. Survival analysis of tumor NOS2, COX2, and IFN-γ at 5 years after diagnosis.
Annotated viable tumor was analyzed for survival effects of (A) IFN-γ and (B) tumor NOS2 and COX2 normalized to CK-SOX10 tumor biomarker in tumors from deceased (n = 10) and alive (n = 10) ER breast cancer patients at 5 years after diagnosis. (C) Pearson’s correlation analysis of NOS2 and COX2 in tumors from deceased and alive ER breast cancer patients. (D) Effect of tumor NOS2 and CD8+ T cells on complete pathological response (non pCR n = 10, pCR n = 8) in biopsies from patients in the neoadjuvant KEYNOTE 522 (K522) clinical trial who received the PD1 inhibitor pembrolizumab and chemotherapy. *P < 0.05, **P = 0.0031, Mann-Whitney test.
Figure 2
Figure 2. Cytokine-induced NOS2 and COX2 expression.
(A) Gene expression (left) and Western blot (right) showing temporal NOS2 and COX2 expression in MDA-MB-231 breast cancer cells treated with IFN-γ + IL-1β + TNF-α (CM) at 24 and 48 hours. ****P < 0.0001 Mann-Whitney test for both NOS2 (top) and COX2 (bottom); 2-way ANOVA + Fisher’s least significant difference *P < 0.05, **P = 0.0012, or Šídák's multiple-comparison test ***P = 0.0006. MWM, molecular weight marker. (B) NOS2s/IFN-γ ratio is significantly elevated in tumors from deceased ER patients at 5 years after diagnosis. ***P = 0.0007 Mann-Whitney test. (C) Pearson’s correlation showing significance between NOS2s and COX2all versus IFN-γ in tumors from deceased and alive patients at 5 years after diagnosis. (D) The significance of the NOS2/IFNG and COX2/IFNG relationships are validated in National Center for Biotechnology Information (NCBI) Gene Expression Omnibus (GEO) datasets found in https://www.ncbi.nlm.nih.gov/geo/ Gehan-Breslow-Wilcoxon survival analysis and Mantel-Haenszel hazard ratio analysis were used. Top graphs validate survival using cohort data from this study, while lower graphs are from combined GEO datasets (n = 796) generated using https://kmplot.com/analysis
Figure 3
Figure 3. Tumor COX2 promotes immune cold regions.
(A) Schematic showing immunosuppressive mediators and abated CD8+ TEff cell infiltration. Pearson’s correlation analysis showing significance between CD8+ TEff cells versus immunosuppressive phenotypes normalized to COX2 tumor expression, where (B) CD8+ TReg, CD4+ TReg, and CD8+ TEx cells, as well as (C) COX2-expressing macrophages but not PDL1-expressing tumor macrophages correlated significantly.
Figure 4
Figure 4. Unsupervised spatial S-UMAP analysis validates the predictive value of NOS2+/COX2+ tumor clusters.
(A) S-UMAP of the clustering cellular phenotypes revealing distinct clustering regions (yellow circles) and (B) the differential cluster distribution analysis of the of %deceased normalized to %alive (red and blue circles) patient tumors at 5 years after diagnosis. (C) Nearest neighborhood analyses show distance-dependent changes in cellular phenotypes that are predictive of poor patient survival. Importantly, density-dependent clustering gradients are demonstrated for NOS2Tumor and COX2Tumor phenotypes. (D) Moderately increased clustering of CD8+ TEx and PDL1Macrophage phenotypes is predictive of improved patient survival. For C and D the first bar is 25 µm.
Figure 5
Figure 5. Regional placement of cellular phenotypes within the tumor.
The %cells of predictive phenotypes including (A) CD8+ and (B) CD4+ (C) tumor and (D) macrophage phenotypes are shown. Ordinary 1-way ANOVA *P < 0.05, **P ≤ 0.0061, ***P ≤ 0.0004, ****P < 0.0001. Sat, satellites.
Figure 6
Figure 6. Progression of CD8+ T cell exclusion during the formation of tumor immune deserts.
Distinct classes of CD8+ T cell exclusion were observed. (A) Type I: inflamed but stroma-restricted CD8+ T cells (orange) with NOS2 (red) expression at the tumor margin and high COX2 (green) expression deeper into tumor core. Type II: abated CD8+ T cells, low NOS2 expression at the tumor margin, and high COX2 expression deeper into tumor core. Type III: absence of CD8+ T cells with abated NOS2 expression at the tumor margin and low, sparse COX2 expression deeper into tumor core. (B) Differential penetration of CD4+ versus CD8+ T cells into high NOS2/COX2-expressing tumors of deceased patients where both CD4+ and CD8+ T cells remain in the tumor stroma, as shown in fluorescence image, spatial animation (middle), and density heatmap (right). (C) In contrast, CD4+ T cells remain in the tumor stroma while CD8+ T cells penetrate deep into low NOS2/COX2-expressing tumor core of alive patients.
Figure 7
Figure 7. Analysis of immune phenotypes in lymphoid aggregates of ER tumors.
(A) CD8+ TEff/CD4+ TEff and CD8+ TEff/PDL1Macrophage ratios are significantly higher in tumors from alive patients. Statistical outliers were excluded based upon mathematical analysis using Prism software ROUT method. (B) CD8+ TEff/CD4+ TReg and CD8+ TEff/PDL1Macrophage ratios are significantly higher in indomethacin-treated 4T1 tumors when compared with WT control. (C) Validation of the predictive value of elevated CD8a/FOXP3 using the GEO database. *P < 0.05, ***P = 0.001 Mann-Whitney test. Survival analysis was performed using Gehan-Breslow-Wilcoxon test, and hazard ratio was determined using Mantel-Haenszel test.
Figure 8
Figure 8. Density heatmap distributions of immunosuppressive TReg, PDL1, IDO1, B7H4, and tumor NOS2 and COX2 phenotypes.
Stroma (orange) as well as viable (green) and necrotic (purple) annotated tumor regions are shown in each panel (left). Density heatmap distributions with low-to-high scale are shown for CD3+CD8+ T cells, CD4+FOXP3+TReg, PDL1Tumor, IDO1, B7H4, NOS2Tumor, and COX2Tumor in NOS2/COX2-high tumors from deceased patients with (A) type I stroma-restricted CD8+ T cells with high NOS2 expression at the tumor margin and high COX2 expression deeper into tumor core and (B) type II immune deserts with abated CD8+ T cells, low NOS2 expression at the tumor margin, and high COX2 expression deeper into tumor core. (C) NOS2/COX2-low tumor from alive patient with high CD3+CD8+ T cell infiltration into the tumor. B and C show the same tumors as in Figure 6A (type III immune desert) and Figure 6C (alive patient).
Figure 9
Figure 9. Summary of immunosuppressive signaling progression.
Stroma-restricted CD8+ TEff cells secrete IFN-γ/TNF-α that induces tumor NOS2 and COX2 expression near tumor margin, leading to type I TEff restricted regions. Tumor COX2-expressing type II immune deserts with limited TEff infiltration progress to type III immune desert regions with abated NOS2 and COX2 tumor expression. IDO1 and PDL1Macrophage are expressed in tumor stroma along with increased TReg populations in lymphoid aggregates.

Similar articles

References

    1. Shiravand Y, et al. Immune checkpoint inhibitors in cancer therapy. Curr Oncol. 2022;29(5):3044–3060. doi: 10.3390/curroncol29050247. - DOI - PMC - PubMed
    1. Kleponis J, et al. Fueling the engine and releasing the break: combinational therapy of cancer vaccines and immune checkpoint inhibitors. Cancer Biol Med. 2015;12(3):201–208. doi: 10.7497/j.issn.2095-3941.2015.0046. - DOI - PMC - PubMed
    1. Liu J, et al. Cancer vaccines as promising immuno-therapeutics: platforms and current progress. J Hematol Oncol. 2022;15(1):28. doi: 10.1186/s13045-022-01247-x. - DOI - PMC - PubMed
    1. Vajari MK, et al. Breast cancer vaccination: latest advances with an analytical focus on clinical trials. Int Immunopharmacol. 2023;123:110696. doi: 10.1016/j.intimp.2023.110696. - DOI - PubMed
    1. Leowattana W, et al. Immunotherapy for advanced gastric cancer. World J Methodol. 2023;13(3):79–97. doi: 10.5662/wjm.v13.i3.79. - DOI - PMC - PubMed

MeSH terms