. 2025 Jul 15;135(18):e183093.
doi: 10.1172/JCI183093. eCollection 2025 Sep 16.

NFAT5 dictates crosstalk between intestinal epithelial regenerative capacity and microbiota in murine colitis models

Affiliations

NFAT5 dictates crosstalk between intestinal epithelial regenerative capacity and microbiota in murine colitis models

Se-Hyeon Park et al. J Clin Invest. .

Abstract

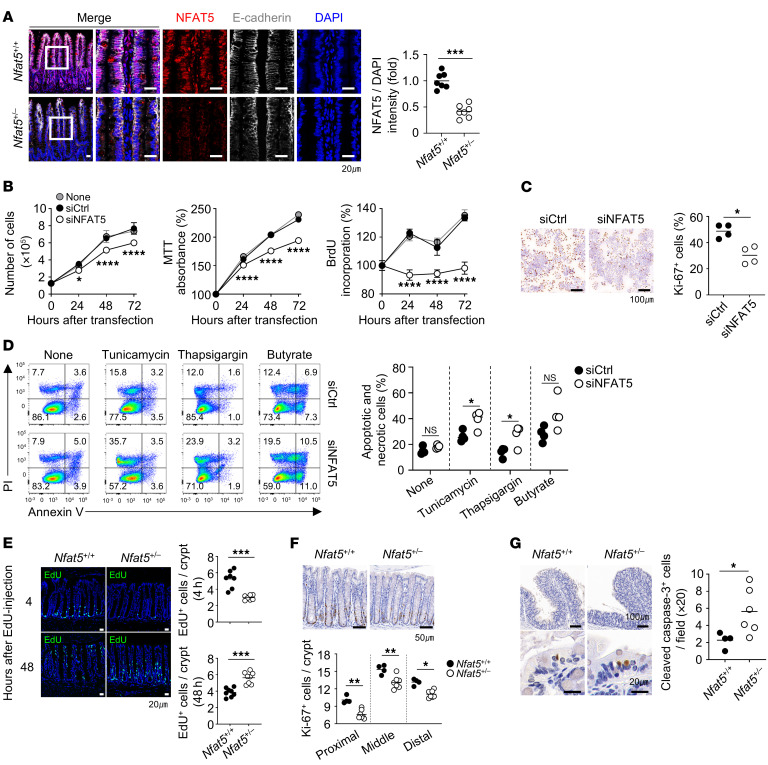
Hypertonic and hyperosmolar stimuli frequently pose challenges to the intestinal tract. Therefore, a resilient epithelial barrier is essential for maintaining gut homeostasis in the presence of osmotic perturbations. Nuclear factor of activated T cells 5 (NFAT5), an osmosensitive transcription factor, primarily maintains cellular homeostasis under hypertonic conditions. However, the osmoprotective role of NFAT5 in enterocyte homeostasis is poorly understood. Here, we demonstrate that NFAT5 was critical for the survival and proliferation of intestinal epithelial cells (IECs) and that its deficiency accelerated chemically induced or spontaneous colitis in mice. Mechanistically, NFAT5 promoted the survival of IECs and the renewal of intestinal stem cells, thereby regulating the production of mucus and antimicrobial compounds, including RegIII and lysozyme, which consequently shape the gut microbial composition to prevent colitis. Transcriptome analysis identified HSP70 as a key downstream target of NFAT5 in epithelial regeneration. Loss- and gain-of-function experiments involving HSP70 revealed that NFAT5 mitigated experimental colitis through IEC Hsp70, which protected stem cells from inflammation-induced injury and maintained barrier function. In conclusion, our study demonstrates what we believe to be a previously unknown role for NFAT5 in dictating the crosstalk between intestinal stem cells and the microbiota, underscoring the importance of the NFAT5/HSP70 axis in maintaining epithelial regeneration related to gut barrier function, balancing microbial composition, and subsequently preventing colitis progression.

Keywords: Gastroenterology; Immunology; Inflammatory bowel disease.


Figures

Figure 1
Figure 1. NFAT5 promotes the proliferation and survival of IECs.
(A) Representative images and a corresponding graph of immunofluorescence staining of ileal tissue from Nfat5+/+ and Nfat5+/– mice for NFAT5 (red) and E-cadherin (white). Nuclei are counterstained with DAPI (blue). Scale bars: 20 μm. (B and C) Proliferation of HT-29 cells transfected with siCtrl or siNFAT5 was assessed at the indicated time points using trypan blue exclusion (left), MTT (middle), and BrdU incorporation assays (right) (B). Representative images of Ki-67 immunocytochemistry and quantification of Ki-67+ cells after 48 hours of transfection with siCtrl or siNFAT5 are shown (C). Scale bars: 100 μm. (D) Flow cytometric analysis of annexin V and PI staining of HT-29 cells transfected with siCtrl or siNFAT5 for 48 hours, followed by 24 hours of treatment with thapsigargin, tunicamycin, or butyrate. The total frequency of apoptotic and necrotic cells is shown (annexin V/PI, live cells; annexin V/PI+, necrotic cells; annexin V+/PI, early apoptotic cells; annexin V+/PI+, late apoptotic cells). (E and F) Proliferating cells in distal colonic tissues of Nfat5+/+ and Nfat5+/– mice were assessed by EdU-incorporation assay (E) and Ki-67 IHC (F). EdU+ cells were detected after intraperitoneal injection of 1 mg EdU at the indicated time points. Representative images and quantified data are shown. Scale bars: 20 μm (E) and 50 μm (F). (G) Apoptotic cells were determined by cleaved caspase 3 IHC in proximal colonic tissues of Nfat5+/+ and Nfat5+/– mice after 3 days of DSS treatment. Representative images and quantification of cleaved caspase 3+ cells are shown. Scale bars: 100 μm (top panels) and 20 μm (bottom panels). Each dot represents an individual mouse, and the means are displayed as a line (A and EG). Data are presented as the mean ± SD (B) and as a line indicating the mean (C). *P < 0.05, **P < 0.01, ***P < 0.001, and ****P < 0.0001 by Mann-Whitney U test (A, C, and EG) and 2-way, repeated-measures ANOVA with Šídák’s multiple-comparison test (between cells transfected with siCtrl and siNFAT5; B and D). Data shown in AG are representative of at least 2 independent experiments.
Figure 2
Figure 2. NFAT5 protects mice against DSS-induced colitis.
Nfat5+/+ and Nfat5+/– mice were given ad libitum access to water containing DSS for 5 days, after which fresh water was made available for the remainder of the experimental period. (A and B) Body weight changes and the DAI were monitored for 14 days after the initial DSS treatment (A), and on day 14, macroscopic images and colon lengths on day 14 were analyzed (n = 10 per group) (B). One Nfat5+/– mouse died on day 13. DAI scores were determined in accordance with the criteria outlined in Supplemental Table 1. (C) H&E staining of the distal colonic tissues collected on day 5 after DSS treatment. Representative H&E images are shown, and the histological score was calculated, as shown in Supplemental Table 3. Scale bars: 50 μm. (D) Relative mRNA expression of Il1b, Il6, Il17a, and Tnfa in whole colonic tissues at the indicated time points were determined by qRT-PCR. Gapdh mRNA levels were used as an internal control. (EH) IHC staining was performed on colonic tissues harvested on day 5 to evaluate the presence of TNF-α+ (E), IL-17+ (F), Ki-67+ (G), and Alcian blue+ (mucin-producing) (H) cells. Representative images of the distal colon and the corresponding graphs are shown (scale bars: 50 μm). TNF-α+ and IL-17+ cells were counted in at least 5 fields of the distal colon per mouse. Ki-67+ cells and Alcian blue+ cells were counted in at least 20 crypts per mouse. Data are presented as the mean ± SEM. Each dot represents an individual mouse, and the means are displayed as lines. Data in AH are representative of at least 2 independent experiments. *P < 0.05, **P < 0.01, ***P < 0.001, and ****P < 0.0001, by 2-way, repeated-measures ANOVA with Šídák’s multiple-comparison test (A) and Mann-Whitney U test (BH).
Figure 3
Figure 3. Fecal microbiota are indispensable for driving the progression of colitis associated with NFAT5 deficiency.
Mice were given ad libitum access to water supplemented with DSS for 5 days, followed by fresh drinking water for the duration of the experimental period. (AF) Body weight changes and DAI scores of separately housed (A) and cohoused (D) Nfat5fl/fl and Nfat5IEC-KO mice. Day-14 macroscopic images of separately housed (B) and cohoused (E) Nfat5fl/fl and Nfat5IEC-KO mice, along with analyses of colon lengths. On day 5, H&E staining was performed on colonic tissues from separately housed (C) and cohoused (F) Nfat5fl/fl and Nfat5IEC-KO mice, and corresponding histological scores were assessed, as detailed in Supplemental Table 3. (GL) Recipient mice were pretreated ad libitum with an antibiotic cocktail for 3 weeks and then transplanted 3 times, every other day, with feces obtained from donor mice. DSS was then provided ad libitum for 5 days, followed by fresh drinking water for 9 days. Body weight changes and the DAI were assessed for Nfat5+/+ and Nfat5+/– recipient mice (G), which were transplanted with feces derived from Nfat5+/– donor mice. (H) Macroscopic images and colon lengths were analyzed on day 14. (I) H&E-staining of distal colonic tissues collected on day 5, along with corresponding histological scores were evaluated. (JL) Body weight changes and the DAI in different combinations (shown in indices) of donor mouse feces and FMT recipient mice were evaluated for the indicated durations. Data are presented as the mean ± SEM (A, D, G, and JL). Data shown in AL are representative of at least 2 independent experiments. Each dot represents an individual mouse, with mean values indicated by lines (B, C, E, F, H, and I). Scale bars: 1,000 μm and 50 μm (enlarged insets) (C and I). *P < 0.05, **P < 0.01, ***P < 0.001, and ****P < 0.000, by 2-way, repeated-measures ANOVA with Šídák’s multiple-comparison test (A, D, G, and JL) and Mann-Whitney U test (B, C, E, F, H, and I).
Figure 4
Figure 4. Gut permeability and the expression of tight-junction molecules are modulated by Nfat5 deficiency and exposure to feces from Nfat5+/– mice.
(A and B) Results of a gut permeability assay in Nfat5+/+ and Nfat5+/– mice housed separately (A) or cohoused (B). Mice were fasted for 12 hours, after which FITC-dextran (average molecular weight ≈4 kDa) was administered to the mice via oral gavage. Four hours later, fluorescence signals were measured in sera of the mice. (C and D) Relative expression levels of Tjp1 (ZO-1) mRNA and protein in small IECs from separately housed Nfat5+/+ and Nfat5+/– mice were determined by qRT-PCR and immunoblotting, respectively. Gapdh (C) and β-actin (D) were used as internal controls, respectively. (E) ZO-1 expression in the ileal tissues of separately housed Nfat5+/+ and Nfat5+/– mice was assessed by immunostaining with anti-ZO-1 (green) and anti–E-cadherin (red) antibodies. Nuclei were counterstained with DAPI (blue). Representative merged images and corresponding graphs are shown. Scale bars: 20 μm. (F and G) Relative Tjp1 (ZO-1) mRNA and protein expression levels in small IECs of cohoused Nfat5+/+ and Nfat5+/– mice by qRT-PCR and immunoblotting, respectively. Gapdh (F) and β-actin (G) were used as internal controls for normalization, respectively. (HJ) Recipient mice were pretreated 5 times, every other day with an antibiotic cocktail for 3 weeks and transplanted with feces obtained from donor mice (shown in indices). A gut permeability assay was performed on Nfat5+/+ and Nfat5+/– recipient mice transplanted with fecal microbiota derived from Nfat5+/– (H) and Nfat5+/+ donors (I). Fluorescence signals were measured in their sera after oral gavage of FITC-dextran. The expression of ZO-1 in the ileal tissues of Nfat5+/– mice, following fecal transplantation from either Nfat5+/+ or Nfat5+/– donors, was assessed by immunostaining using anti–ZO-1 (green) and anti–E-cadherin (red) antibodies (J). Scale bars: 20 μm. Nuclei were counterstained with DAPI (blue). Representative merged images and corresponding graphs are shown. Each dot represents an individual mouse, and the means are displayed as lines (AJ). *P < 0.05, **P < 0.01, and ***P < 0.001, by Mann-Whitney U test. Data shown in AJ are representative of 2 independent experiments.
Figure 5
Figure 5. NFAT5 deficiency alters the gut microbiome.
(AF) The fecal microbiome of separately housed Nfat5+/+ or Nfat5+/– mice (n = 6 per group) was analyzed by 16S rRNA amplicon sequencing. Relative abundance of fecal bacteria at the genus level (A), observed features, Simpson’s and Shannon’s indices for α-diversity (B), PCOA plot at amplicon sequence variant level for β-diversity (C), LEfSe analysis (D) (LDA score >3), random forest analysis at the genus level (E), and the relative abundance of each taxon highly suggested from the results of A and D (F and G). Pseudo-F and P values in C were analyzed by PERMANOVA. Data in B are presented as box-and-whisker plots (minimum to maximum, with a line at the median). Each dot in G represents an individual mouse, with mean values indicated by lines. *P < 0.05 and **P < 0.01, by Mann-Whitney U test.
Figure 6
Figure 6. NFAT5 facilitates mucin and antimicrobial compound production in goblet and Paneth cells by regulating epithelial regenerative capacity.
(A) Mucin 2–expressing cells in the ileal tissues of separately housed Nfat5+/+ and Nfat5+/– mice were assessed by IHC staining. Representative images and the corresponding graph are presented. Scale bars: 50 μm. (B and C) Muc 2 mRNA expression was analyzed using qPCR in large IECs (L-IECs) and small IECs (S-IECs) from separately housed Nfat5+/+ and Nfat5+/– mice (B). Additionally, mRNA expression levels of Reg3g, Reg3b, Defa5, and Lyz1 were assessed in S-IECs from mice of both groups (C), with Gapdh mRNA serving as the internal control. (D) Lysozyme-expressing cells in the ileal tissues of separately housed Nfat5+/+ and Nfat5+/– mice were assessed. Representative images and their corresponding graph are presented. Scale bars: 100 μm. (EJ) Expression levels of mucin 2, lysozyme, LGR5, and OLFM were determined by qRT-PCR and immunostaining. Muc2 (E), Lyz1 (G), Lgr5, and Olfm4 (I) mRNA expression levels were measured in S-IECs of separately housed Nfat5fl/fl and Nfat5IEC-KO mice by qRT-PCR; Gapdh was used as an internal control for normalization. Mucin 2+ (F), lysozyme+ (H), and OLFM4+ (J) cells were analyzed in the ileal tissues of separately housed Nfat5fl/fl and Nfat5IEC-KO mice to assess their expression patterns. Representative staining images and the corresponding graphs are shown. Scale bars: 100 μm. (K and L) Organoids derived from small intestinal crypts from either separately housed (K) or cohoused (L) Nfat5fl/fl and Nfat5IEC-TG mice. Crypts isolated from a single mouse were seeded and cultured in Matrigel for 5 days. Representative images of organoid culture wells and the corresponding graphs are shown. Scale bars: 200 μm. Each dot in AJ represents an individual mouse, and the means are displayed as lines. Data in K and L are presented as box-and-whisker plots (minimum-to-maximum, line at the median). Data shown in AL are representative of at least 2 independent experiments. *P < 0.05, **P < 0.01, ***P < 0.001, and ****P < 0.0001, by Mann-Whitney U test (AJ) and unpaired, 2-tailed Student’s t test (K and L).
Figure 7
Figure 7. The NFAT5/HSP70 axis mediates the survival and proliferation of IECs.
(AC) Transcriptome analysis was performed using microarray on L-IECs and S-IECs isolated from Nfat5fl/fl and Nfat5IEC-KO mice (n = 3 per group). Volcano plots (A) and heatmaps (B) illustrate the fold change and significance and the z scores of DEGs, respectively. Red indicates genes upregulated in Nfat5IEC-TG versus Nfat5fl/fl IECs along with their z scores, and blue represents downregulated genes and their respective z scores. (C) Top 18 GOBPs enriched among downregulated DEGs in S-IECs from Nfat5IEC-TG mice compared with Nfat5fl/fl mice. Terms related to stem cells are highlighted in red. The count on the x axis indicates the number of enriched DEGs for each term. (D) Uniform manifold approximation and projection (UMAP) visualization of epithelial cell subsets with high NFAT5 signature scores (z score ≥0.2) in the human colonic epithelium. The color metric indicates the distribution of cells with high NFAT5 signature scores. (E) Relative expression levels of Hspa1b mRNA in L-IECs and S-IECs from Nfat5fl/fl and Nfat5IEC-KO mice were measured. Hspa1b expression levels were normalized to Gapdh mRNA. (F) HSP70 expression in colonic tissues from Nfat5fl/fl and Nfat5IEC-KO mice was assessed using IHC. Representative IHC images are shown, with enlarged views of the boxed areas in the lower panel. Scale bars: 100 μm and 20 μm. The corresponding graph illustrates the relative expression of HSP70 in the 2 groups. Each dot represents an individual mouse, and the mean values are displayed as lines (E and F). Data shown in E and F are representative of 2 independent experiments. *P < 0.05, **P < 0.01, ***P < 0.001, and ****P < 0.0001, by Mann-Whitney U test (E and F).
Figure 8
Figure 8. The NFAT5/HSP70 axis prevents DSS-induced colitis in mice.
(A and B) Relative expression levels of HSPA1B mRNA (A) as well as of HSP70 and NFAT5 protein (B) were assessed in HT-29 cells exposed to 100 mM NaCl (hyperosmotic stimuli) for the specified durations (A) or for 24 hours (B) following transfection with either control siRNA (siCtrl) or NFAT5-targeting siRNA (siNFAT5) for 48 hours. Gapdh mRNA and GAPDH protein served as internal controls. (C) The proliferation of HT-29 cells transfected with either siCtrl or HSP70-targeting siRNA (siHSP70) was evaluated at the indicated time points using MTT and BrdU incorporation assays. (D and E) Body weight changes and the DAI (D) were monitored over 14 days following initial DSS treatment in separately housed Hsp70WT Nfat5+/– and Hsp70IEC-TG Nfat5+/– mice. Representative images of the colons and their respective lengths (E) on day 14 are presented. (F) Representative IHC images and quantification of lysozyme+ cells in ileal tissues from separately housed Hsp70WT Nfat5+/– and Hsp70IEC-TG Nfat5+/– mice are shown. Scale bars: 50 μm. (G) 3D intestinal organoids were established by culturing small intestinal crypts isolated from separately housed Nfat5+/+, Nfat5+/–, and Hsp70IEC-TG Nfat5+/– mice in Matrigel for 5 days. Representative images of organoids, along with graphical analyses of their number and surface area, are presented. Scale bars: 200 μm. (H) Relative mRNA expression levels of TNFA, NFAT5, and HSPA1B were analyzed by qRT-PCR in HT-29 cells that were either left untreated or treated for 4 hours with fecal microbiota derived from Nfat5+/+ and Nfat5+/– mice. Data are presented as the mean ± SD (A and C), the mean ± SEM (D), a line indicating the mean (H), or as box-and-whiskers plots (minimum-to-maximum, median indicated by a line (G). Each dot represents an individual mouse, with the mean values indicated by lines. Data shown in AH are representative of at least 2 independent experiments. *P < 0.05, **P < 0.01, ***P < 0.001, and ****P < 0.0001, by 2-way, repeated-measures ANOVA with Šídák’s multiple-comparison test (A and C [between cells transfected with siCtrl versus siNFAT5 or siHSP70], D, G, and H) and Mann-Whitney U test (E and F).
Figure 9
Figure 9. NFAT5 protects Il10-deficient mice from spontaneous colitis.
(AF) Il10–/– Nfat5+/+ and Il10–/– Nfat5+/– mice were either housed separately by genotype (AC) or cohoused in a mixed-genotype setting (DF). DAI scores for separately housed (A) or cohoused (D) Il10–/– Nfat5+/+ and Il10–/– Nfat5+/– mice were monitored for the indicated duration following weaning, after which their colons were collected. Monitoring of separately housed mice was stopped when mice were 10 weeks of age due to severe rectal prolapse, while the cohoused mice were monitored until 12 weeks of age. DAI scores were determined on the basis of the criteria outlined in Supplemental Table 2. Colon lengths of separately housed (B) and cohoused (E) Il10–/– Nfat5+/+ and Il10–/– Nfat5+/– mice were measured and analyzed. Representative H&E images and corresponding histological score graphs of separately housed (C) or cohoused (F) Il10–/– Nfat5+/+ and Il10–/– Nfat5+/– mice are presented. Histological scoring was conducted on the basis of the criteria in Supplemental Table 4. (GI) Il10–/– Nfat5fl/fl and Il10–/– Nfat5IEC-KO mice were housed separately by genotype. DAI scores were monitored until 8 weeks of age, at which point monitoring was stopped due to severe rectal prolapse (G and H). Representative H&E images of colons and corresponding histological score graphs are presented (I). Scale bars: 100 μm and 1,000 μm (C and I). Data in A, D, and G represent the mean ± SEM. Data points in B, C, E, F, and I represent individual mice, and group means are depicted as horizontal bars. Data shown in AG and I are representative of at least 2 independent experiments. *P < 0.05 and **P < 0.01, by 2-way, repeated-measures ANOVA with Šídák’s multiple-comparison test (A, D, and G) and Mann-Whitney U test (B, C, E, F, and I).
Figure 10
Figure 10. NFAT5 deficiency exacerbates spontaneous colitis in Il10-deficient mice by influencing gut microbiota composition and impairing epithelial regenerative capacity.
(A) Relative expression levels of Hspa1b mRNA in L-IECs and S-IECs from separately housed 10-week-old Il10–/– Nfat5+/+ and Il10–/– Nfat5+/– mice were quantified by qRT-PCR and normalized to Gapdh mRNA. (BE) IHC staining for HSP70 (B) and mucin 2 (C) in colonic tissues, as well as mucin 2 (D) and lysozyme (E) in ileal tissues, was carried out for separately housed Il10–/– Nfat5+/+ and Il10–/– Nfat5+/– mice at 10 weeks of age. Representative images are and the corresponding graphs are shown. (F) Organoids were generated by culturing intestinal crypts isolated from separately housed Il10–/– Nfat5+/+ and Il10–/– Nfat5+/– mice in Matrigel for 5 days. Crypts were isolated from the small intestine of individual mice, and the efficiency of organoid formation was assessed by measuring both the number and surface area of organoids generated per well. Multiple images were acquired from each well, and the surface area of all organoids within these images was quantified. Representative images of the formed organoids are shown. Each dot represents an individual mouse, with group means indicated by horizontal lines (AE). Data shown in AE are representative of at least 2 independent experiments; data in F are representative of 3 independent experiments and are presented as box-and-whiskers plots (minimum-to-maximum, line at median). *P < 0.05 and **P < 0.01, and ***P < 0.001 by Mann-Whitney U test (AE) and unpaired, 2-tailed Student’s t test (F). Scale bars: 100 μm and 1,000 μm (C, F, and I).

References

    1. Kobayashi T, et al. Ulcerative colitis. Nat Rev Dis Primers. 2020;6(1):74. doi: 10.1038/s41572-020-0205-x. - DOI - PubMed
    1. Zou J, et al. Cross talk between gut microbiota and intestinal mucosal immunity in the development of ulcerative colitis. Infect Immun. 2021;89(9):e0001421. doi: 10.1128/IAI.00014-21. - DOI - PMC - PubMed
    1. Khor B, et al. Genetics and pathogenesis of inflammatory bowel disease. Nature. 2011;474(7351):307–317. doi: 10.1038/nature10209. - DOI - PMC - PubMed
    1. Peterson LW, Artis D. Intestinal epithelial cells: regulators of barrier function and immune homeostasis. Nat Rev Immunol. 2014;14(3):141–153. doi: 10.1038/nri3608. - DOI - PubMed
    1. Patankar JV, Becker C. Cell death in the gut epithelium and implications for chronic inflammation. Nat Rev Gastroenterol Hepatol. 2020;17(9):543–556. doi: 10.1038/s41575-020-0326-4. - DOI - PubMed

MeSH terms

LinkOut - more resources