. 2025 Jul 28;12(7):ENEURO.0143-25.2025.
doi: 10.1523/ENEURO.0143-25.2025. Print 2025 Jul.

Reinforced Odor Representations in the Anterior Olfactory Nucleus Can Serve as Memory Traces for Conspecifics

Affiliations

Reinforced Odor Representations in the Anterior Olfactory Nucleus Can Serve as Memory Traces for Conspecifics

Christiane Linster et al. eNeuro. .

Abstract

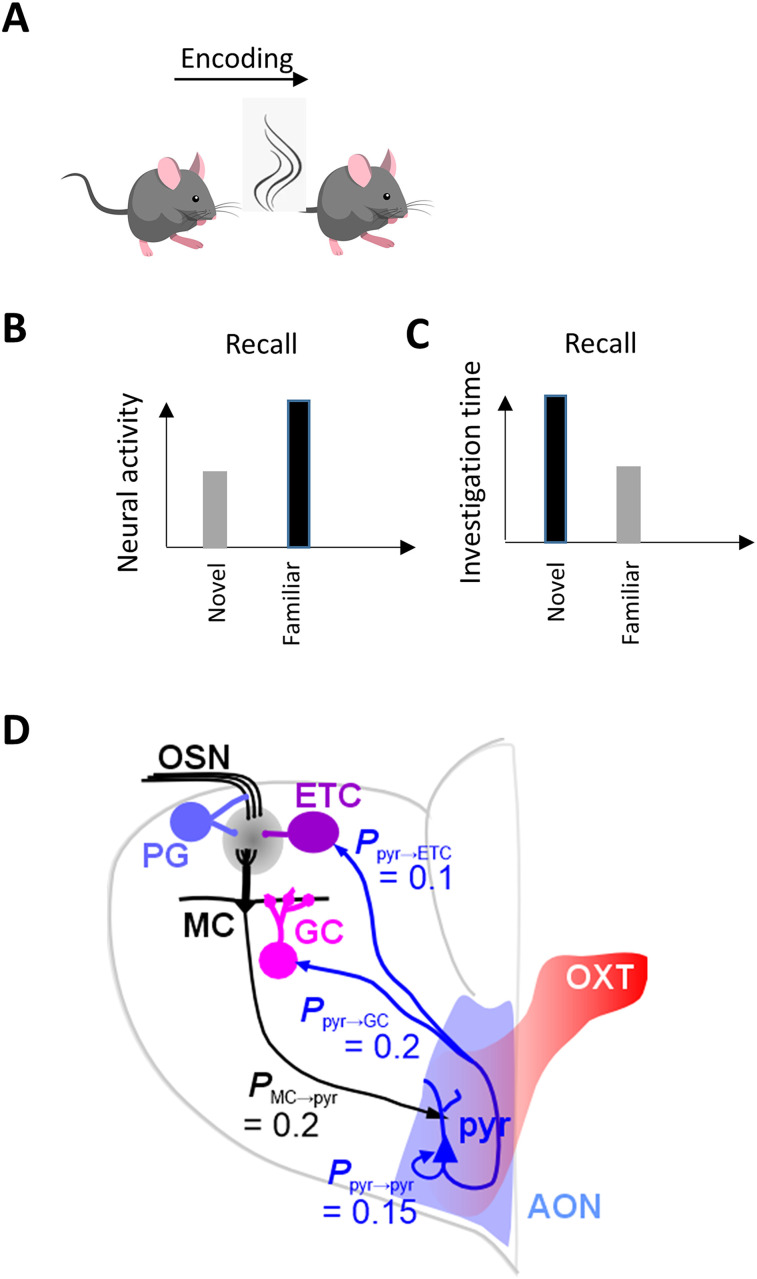
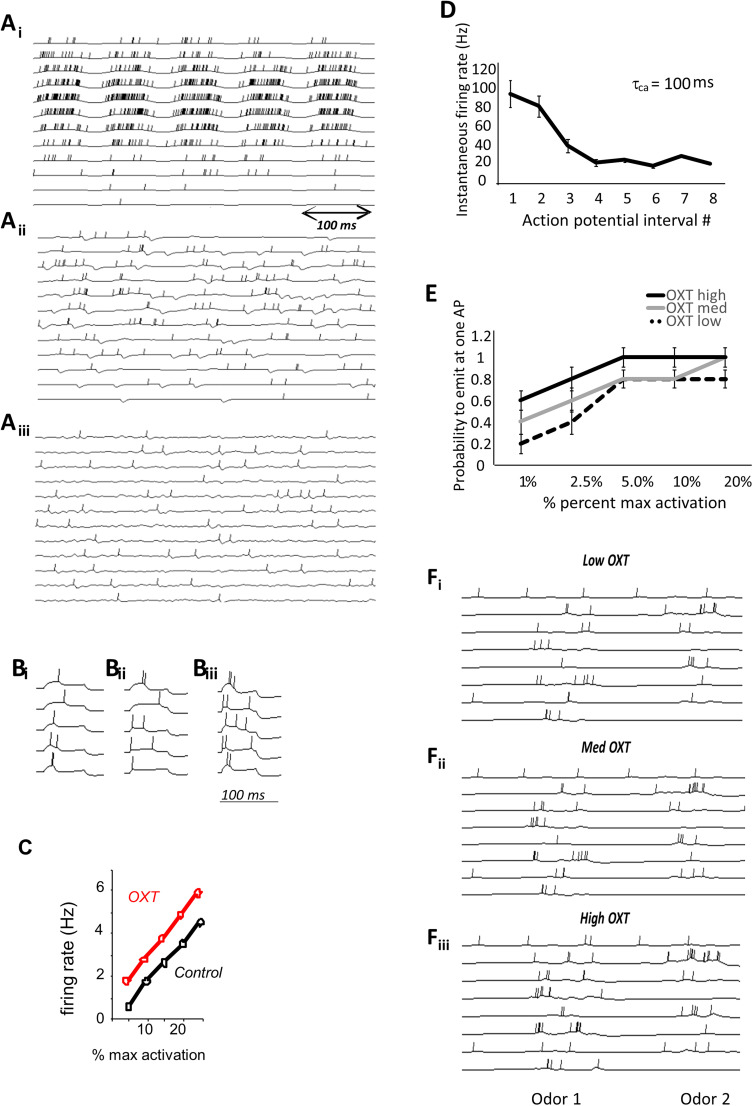
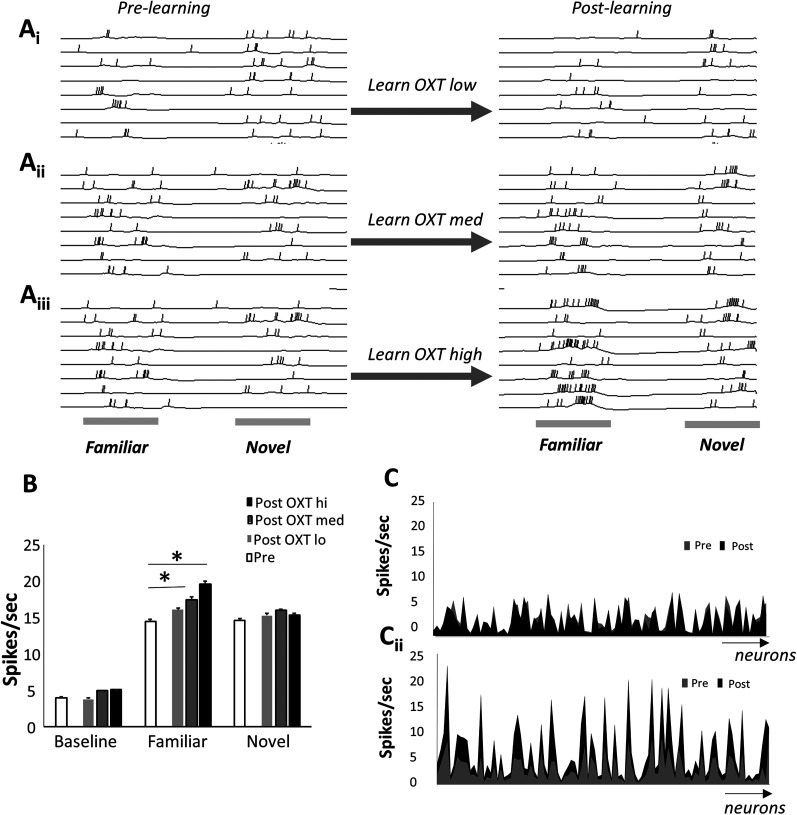
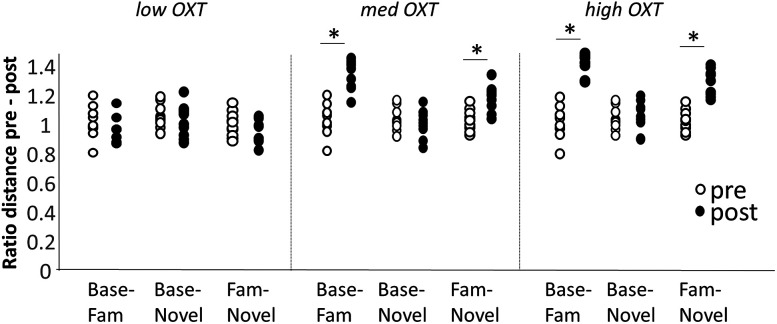
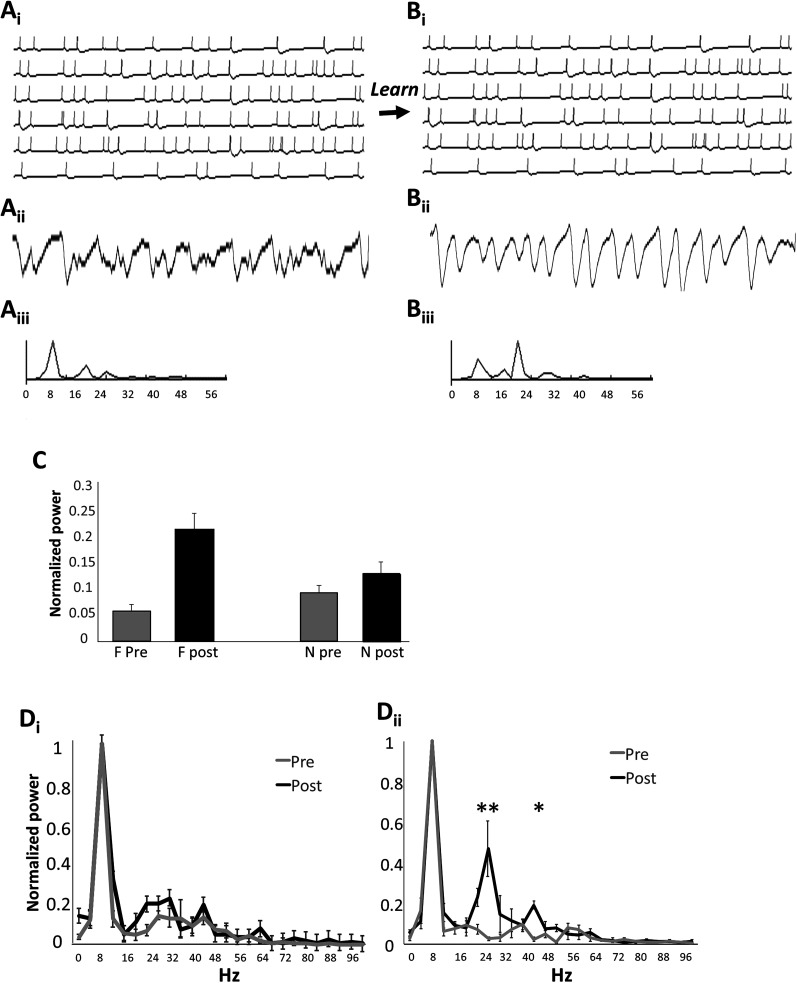
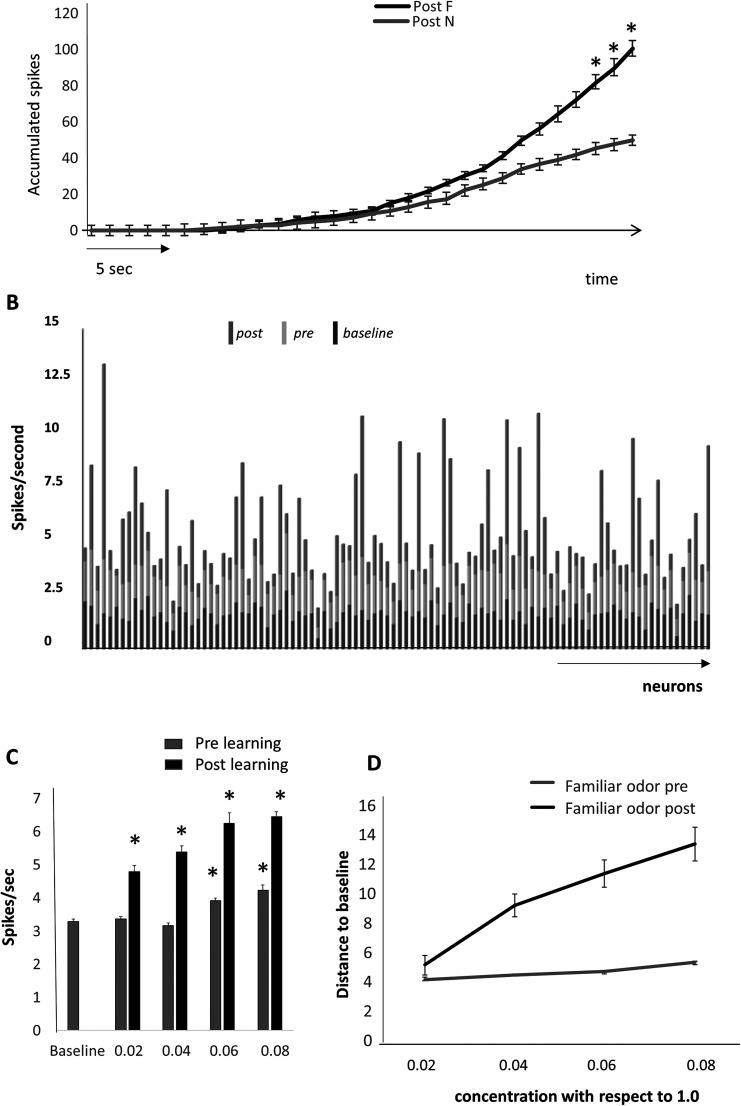
Recognition of conspecific individuals in mammals is an important skill, thought to be mediated by a distributed array of neural networks, including those processing olfactory cues. Recent data from our groups have shown that social memory can be supported by olfactory cues alone and that interactions with an individual lead to increased neural representations of that individual in the anterior olfactory nucleus, an olfactory network strongly modulated by the neuropeptide oxytocin. We here show, using a computational model, how enhanced representations in the AON can easily arise during the encoding phase, how they can be modulated by OXT, and how a dynamic memory signature in the form of enhanced oscillations in the beta range arises from the architecture of the neural networks involved. These findings have implications for our understanding how social memories are formed and retrieved and generate further hypotheses that can be tested experimentally.

Keywords: computation; conspecific; learning; memory; olfactory; oxytocin.


Conflict of interest statement

The authors declare no competing financial interests.

Figures

Figure 1.
Figure 1.
Schematic representation of experimental findings (Wolf et al., 2024). After encoding of a conspecific odor (A), neural activity in response to the familiar odor is increased (B), while investigation of that familiar odor is decreased compared with that of a novel odor not encountered (C). D, Schematic network setup. The computational model includes sensory neurons (OSNs) projecting to OB periglomerular (PG), external tufted (ET), and mitral cells (MC). These cells are connected in a glomerular network with PGs inhibiting ETs, ETs exciting MCs, and ETs exciting each other in a small surround. This network performs normalization on the incoming odor information (Cleland and Sethupathy, 2006; Cleland et al., 2007). MCs are reciprocally connected to granule cells (GCs) with MCs exciting a random subset of 25% existing GCs and GCs inhibiting only the MC closest to it. MCs make excitatory connections with a subset of 20% randomly chosen pyramidal (pyr) in the AON network. AON pyr cells form a loose association network by connecting to each other with a 15% connectivity. Pyrs project back to OB cells with the same connectivity described before (Linster and Kelsch, 2019). Table 1 details all the parameters chosen for the present simulations.
Figure 2.
Figure 2.
A, Examples of OB neural responses in the model OSNs (Ai), MCs (Aii), and GCs (Aiii). B, Simulated responses of AON pyramidal cells to a short (100 ms) stimulation above the rheobase under low OXT (Bi), medium OXT (Bii), and high OXT (Biii) parameters. OXT affects response thresholds in the model with more OXT leading to lower spike thresholds (Oettl et al., 2016). C, AON pyramidal cell firing rates as a function of activation currents under high OXT (OXT) and medium OXT (control) conditions. D, Instantaneous firing rate in simulated AON pyramidal cells as a function of action potential interval number. These simulations served to adjust the time constant for calcium accumulation that governs the spike rate adaptation as measured in McGinley and Westbrook (2011). Ten instantiations of a pyramidal cell were run and average instantaneous frequency computed for the first 8 action potentials emitted by the cell to adjust the time constant for spike rate adaptation. The graph shows average instantaneous frequencies for the parameters chosen (tau = 100; compare with the graph shown in McGinley and Westbrook, 2011). ANOVA with frequency as dependent variable and action potential number as factor shows a significant overall effect of action potential number (F(7,72) = 38.895; p < 0.001) as well as a significant negative correlation between action potential number and frequency (R = −0.733; p = 0.01). E, Rheobase modulation by simulated OXT levels. The graph shows the probability to emit at least one action potential as a function of activation levels for AON pyramidal cells under the three OXT conditions. The probability to emit an action potential was calculated over 10 repeated simulations using a range of artificial activation values. ANOVA with probability as dependent variable and input and OXT levels as main effects shows a significant effect of input level (F(4,135) = 9.952; p = 0.001) and OXT level (F(2,135) = 6.404; p = 0.002). F, Examples of neural responses of a small group of simulated AON cells to stimulation with 200 ms of two conspecific odors when OXT is low (Fi), medium (Fii), or high (Fiii).
Figure 3.
Figure 3.
Learning increases odor responses to the learned odor. A, Example of neural activity in the model pyramidal cells to the familiar and novel odor before and after learning the familiar odor with low OXT (Ai), medium OXT (Aii), and high OXT (Aiii). B, Average firing rates in model pyramidal cells (spikes per second) during baseline activity and odor-evoked activity before and after learning of the familiar odor under three OXT conditions. To obtain these data, 10 instantiations of the model were run through the following simulations: baseline activity, odor F, and odor N each for 0.5 s with medium OXT. Odor F was then presented for 5 s with plasticity turned on (learning rate > 0.0). After that, baseline, odor F, and odor N were presented for 0.5 s again and the average number of spikes were recorded. Each of set of 10 simulations was run three times with plasticity under low, medium, and high OXT levels. The number of spikes in response to each odor was compared pre- and postlearning using paired t tests with alpha < 0.01 to account for multiple comparisons. Responses to the familiar odor F were significantly higher after learning under medium and high OXT as compared with prelearning (p < 0.001). Responses to odor N were not changed by learning of odor F (p > 0.2 in all comparisons). C, Example average activity levels of pyramidal cells on response to novel (Ci) and familiar (Cii) odors before and after learning. Note that neurons with higher firing rate responses are more likely to find their responses enhanced. Neurons from 1 to 100 are shown on the x-axis with average firing rates on the y-axis.
Figure 4.
Figure 4.
Euclidean distances between odors and baseline as well as learned odors and novel odors before and after learning. The graph shows distributions of distances between baseline-familiar, baseline-novel, and familiar-novel neural activities pre (white dots) and post (black dots) learning. Simulations were run as described in Figure 3B. All data are normalized by the average distance before learning to facilitate comparison. Pre- and postlearning distances were compared using repeated measures in SPSS. Low OXT: baseline-familiar F(1,9) = 5.112; p = 0.054; baseline-novel F(1,9) = 0.002; p = 0.961; familiar-novel: F(1,9) = 2.212; p = 0.175. Medium OXT: baseline-familiar F(1,9) = 38.242; p < 0.001; baseline-novel F(1,9) = 0.155; p = 0.704; familiar-novel: F(1,9) = 1.611, p = 0.236. High OXT: baseline-familiar F(1,9) = 89.072; p < 0.001; baseline-novel F(1,9) = 1.611, p = 0.236; familiar-novel: F(1,9) = 49.211; p < 0.001.
Figure 5.
Figure 5.
Beta range dynamics in response to learning in the pyramidal cell network. A, Familiar odor prelearning and B, familiar odor postlearning. Example pyramidal cell activity in response to the familiar odor before learning (Ai) and after learning (Bi), with accompanying LFP traces (Aii and Bii), simulated respiration (Aiii and Biii) and power spectrum (Aiv and Biv). C, Power in the beta range (normalized to peak power) pre- and postlearning of odor F. Simulations were run by first presenting odors F and N for 0.5 s (pre), then presenting odor F for 5 s with plasticity on followed by a second presentation of odors F and N for 0.5 s (post). Power spectra were calculated from the simulated LFP during pre- and postlearning odor stimulations. Power was normalized to the highest peak (8 Hz) and power in the beta range was averaged (12–30 Hz). Simulations were run four times with new network instantiations. Analysis of variance with power as dependent variable and odor (F/N) and state (pre/post) as factors showed a significant effect of state (F(1,12) = 20.769; p = 0.001) as well as a significant interaction between odor and state (F(1,12) = 7.882; p = 0.016). Further post hoc comparisons (Tukey HD) showed a significant difference between odors postlearning (p = 0.048) but not prelearning (p = 0.117). A significant effect or learning was observed in the familiar (p = 0.004) but not the novel odor (p = 0.201). D, Average power spectrum of the AON network pre- and postlearning of the familiar odor in response to the novel (Di) and familiar (Dii) odor. Simulations were those described above for C. Analysis of variance with power as the dependent variable and frequency and state (pre/post) as factors showed a significant effect of frequency (F(25,156) = 56.932; p < 0.001) and state (F(1,156) = 9.061; p = 0.003) but no interaction (F(25,156) = 1.171; p = 0.275) for the novel odor (Dii). In contrast, frequency, state, and their interaction were significant for the familiar odor (F(25,156) = 93.547; p < 0.001; F(1,156) = 93.547; p < 0.001; F(25,156) = 7.789; p < 0.001). Post hoc comparisons showed that after learning, the power in response to the familiar odor is significantly higher in the beta range (p = 0.018 at 24 Hz, p = 0.001 at 28 Hz) and low gamma range (p ≤ 0.001 at 44 Hz).
Figure 6.
Figure 6.
Effects of learning on neural representations. A, Accumulation of action potentials in response to a familiar and a novel odor shows that a significant difference is reached ∼25–30 s simulation time. We ran five iterations of a network that first learned during 5 s of presentations of odor F (5 s presentation) and then tested the network responses to a 60 s presentation of each odor without plasticity. We here show and analyze responses to the first 30 s of these presentations. Over the course of 30 s, the number of spikes accumulated is significantly different in responses to odors F and N (F(1,210) = 28.366; p < 0.001) with a significant interaction between the presentation step and the odor (F(1,210) = 2.080; p = 0.002). Post hoc tests (Tukey HD) then shows a significant difference between the number of accumulated spikes after 27 s of presentation time (p = 0.049, 0.032 and 0.018 for 28, 29, and 30 s). B, Responses to below threshold odor concentrations. The graph shows average activity in the network of pyramidal cells for a below threshold odor before (0.02 of max activation; pre) and after (post) learning of that odor as well as the baseline activity for comparison. C, Average numbers of action potentials over 10 runs of the model at different low odor concentrations (concentrations are given as ratio of the concentration used for learning) before (pre) and after (post) learning the odor. There is an overall effect of concentration for both conditions (F(1,41) = 7.428; p < 0.001 and F(1,46) = 22.299; p < 0.001) with all concentrations significantly different from baseline after learning (p ≤ 0.02 in all cases using Tukey HD). Before learning, only the two higher concentrations were significantly different from baseline (p < 0.001 in both cases). D, Average Euclidean distance to baseline activity for low concentration familiar odors before and after learning of the familiar odor. Distances were computed from data shown in C.

Similar articles

References

    1. Barkai E, Hasselmo ME (1994) Modulation of the input/output function of rat piriform cortex pyramidal cells. J Neurophysiol 72:644–658. 10.1152/jn.1994.72.2.644 - DOI - PubMed
    1. Bolding KA, Franks KM (2017) Complementary codes for odor identity and intensity in olfactory cortex. Elife 6:e22630. 10.7554/eLife.22630 - DOI - PMC - PubMed
    1. Brennan PA, Kendrick KM (2006) Mammalian social odours: attraction and individual recognition. Philos Trans R Soc Lond B Biol Sci 361:2061–2078. 10.1098/rstb.2006.1931 - DOI - PMC - PubMed
    1. Chaudhury D, Manella L, Arellanos A, Escanilla O, Cleland TA, Linster C (2010) Olfactory bulb habituation to odor stimuli. Behav Neurosci 124:490–499. 10.1037/a0020293 - DOI - PMC - PubMed
    1. Cleland TA, Sethupathy P (2006) Non-topographical contrast enhancement in the olfactory bulb. BMC Neurosci 7:7. 10.1186/1471-2202-7-7 - DOI - PMC - PubMed

LinkOut - more resources