. 2025 Jul 25;12(7):ENEURO.0229-25.2025.
doi: 10.1523/ENEURO.0229-25.2025. Print 2025 Jul.

Disrupted Neuronal Dynamics of Reward Encoding in the Medial Prefrontal Cortex and the Ventral Tegmental Area after Episodic Social Stress

Affiliations

Disrupted Neuronal Dynamics of Reward Encoding in the Medial Prefrontal Cortex and the Ventral Tegmental Area after Episodic Social Stress

Hannah Harris et al. eNeuro. .

Abstract

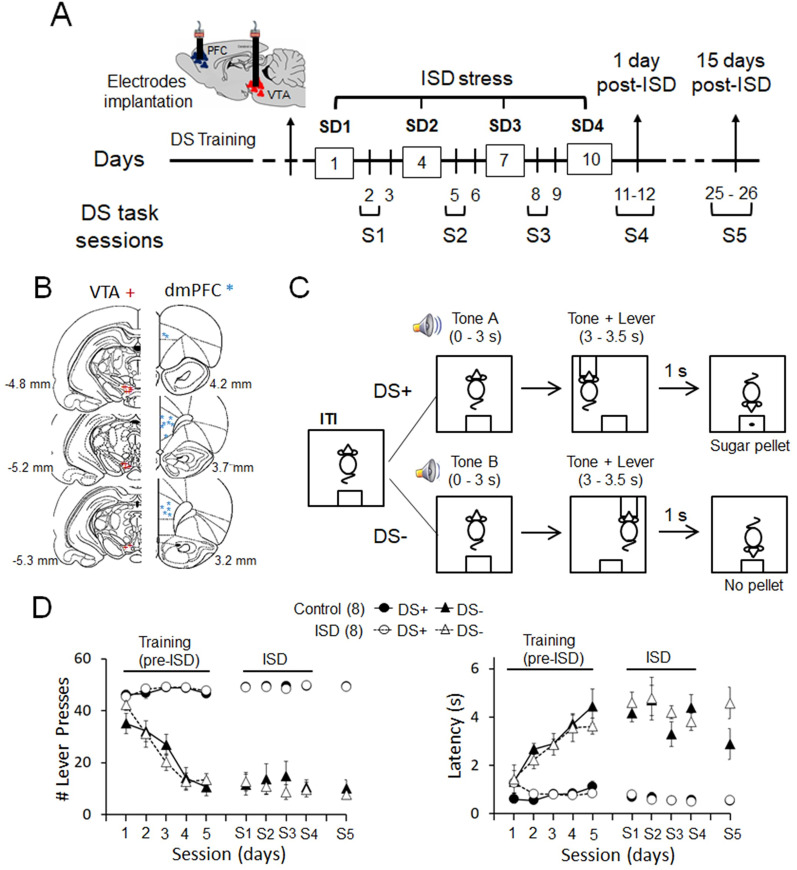
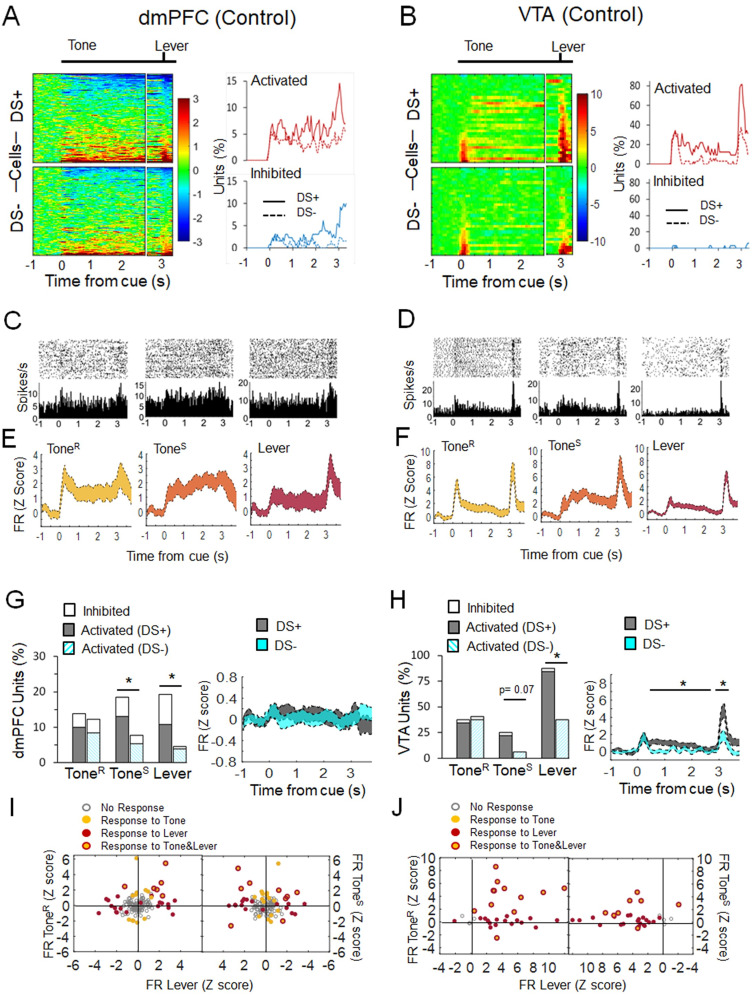
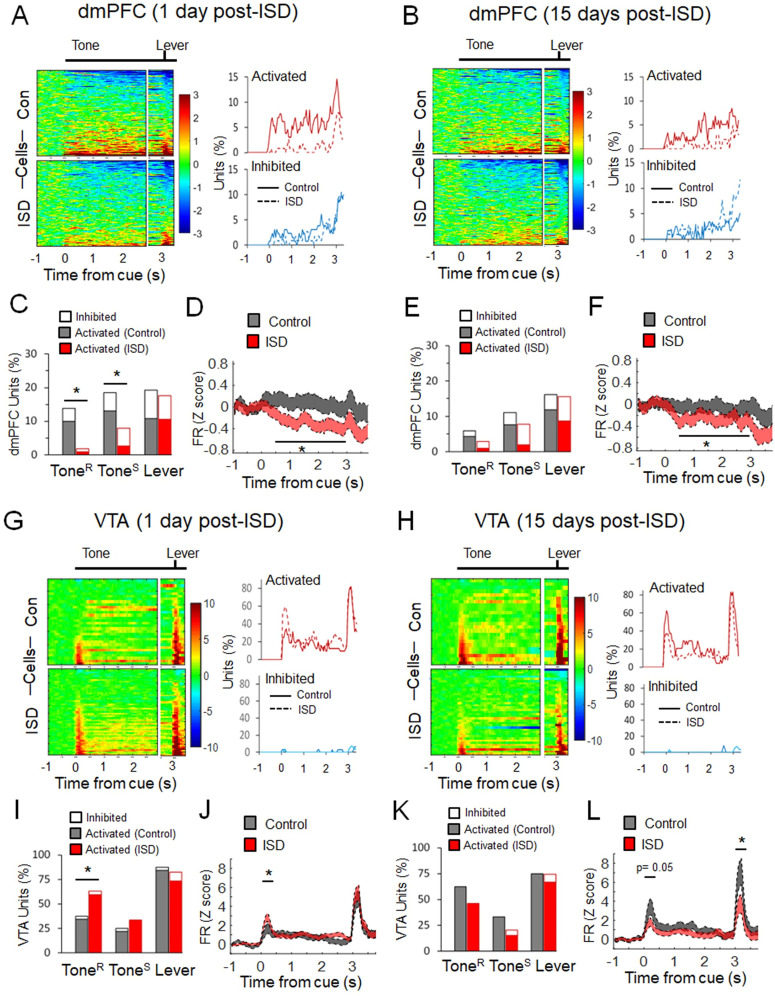
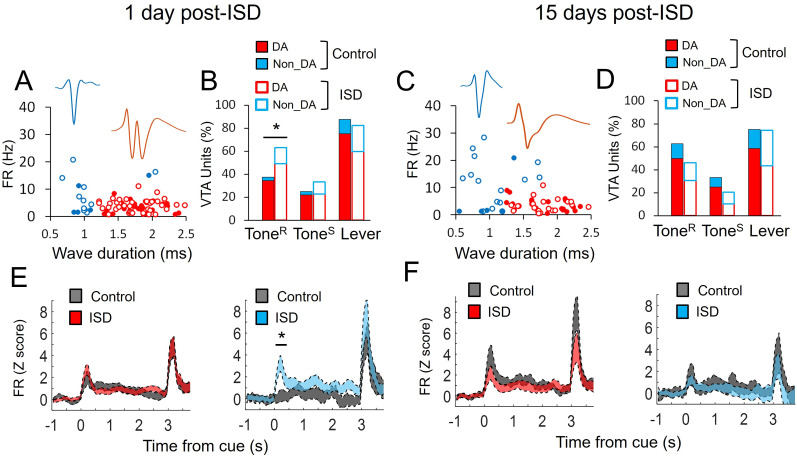
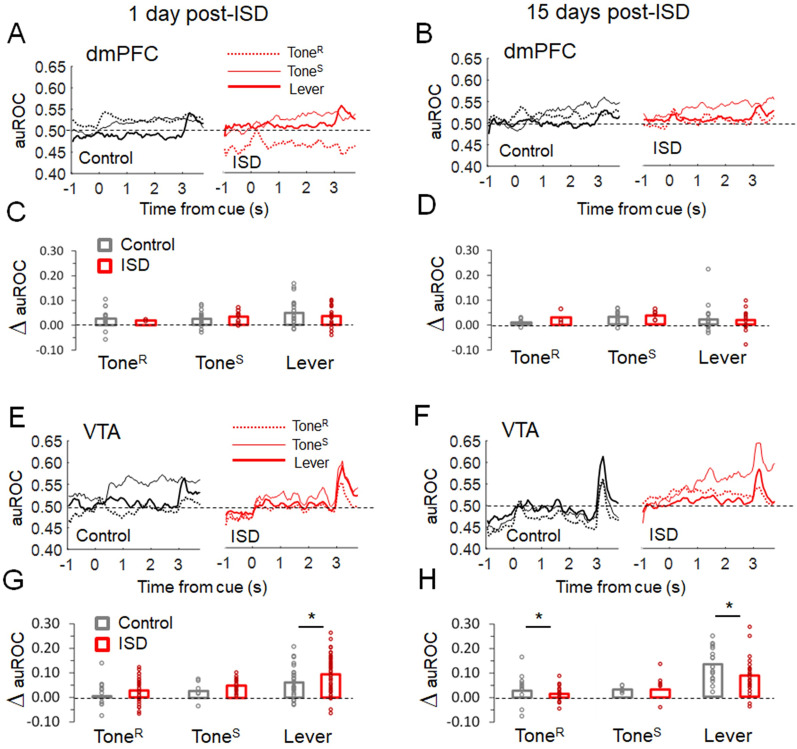
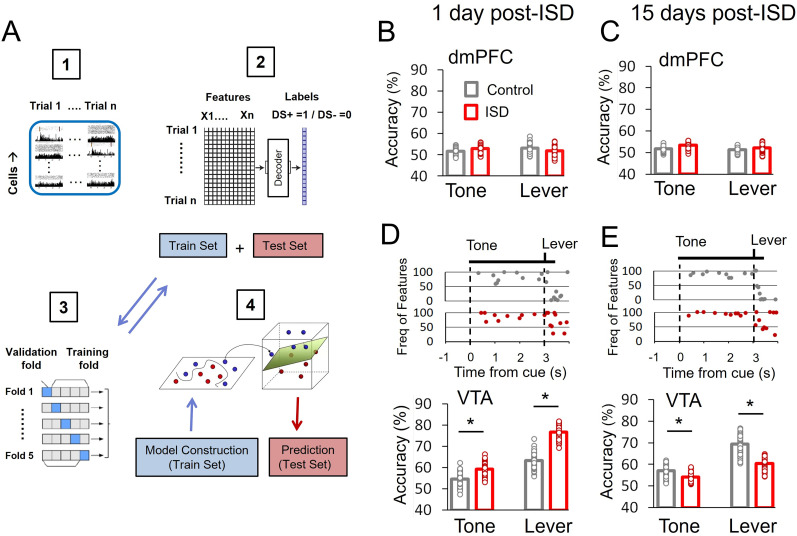
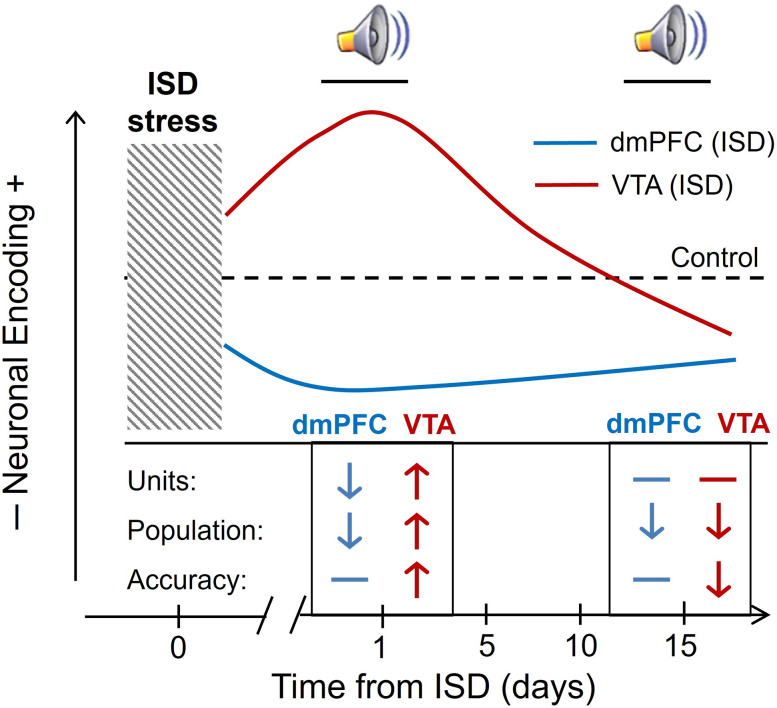
Previous research suggests that stress predisposes individuals to develop substance use disorders by disrupting the brain processing of rewards. Yet, how stressful experiences disrupt the brain processing of reward-related cues at the neuronal level is poorly understood. Intermittent social defeat (ISD) is a stress animal model that increases reward-seeking behavior, drug self-administration, and choice impulsivity up to several weeks after stress. We tested the hypothesis that ISD disrupts the neuronal encoding of reward cues in key areas of the brain that regulate reward-seeking. We examined in vivo neuronal dynamics in response to reward cues in the dorsal medial prefrontal cortex (dmPFC) and the ventral tegmental area (VTA) simultaneously, and longitudinally, in control and stressed Long-Evans male rats during a discriminative stimulus reward-seeking task. In the dmPFC, ISD decreased cue-evoked neuronal activity 1 and 15 d after stress, which indicates a long-term degradation of outcome anticipation-related processing. In the VTA, ISD increased cue-evoked neuronal activity 1 d after stress but decreased cue-evoked activity 15 d after stress. Moreover, decoding analysis in single neurons and populations showed parallel increases and decreases in reward discrimination accuracy in the VTA which points to time-dependent changes in incentive salience after stress. These results demonstrate that ISD differently disrupts the neuronal encoding of reward cues in the dmPFC and the VTA and identify novel neurofunctional signatures that underlie a higher predisposition to seek out rewards after stress.

Keywords: neuronal population; rat; reward-seeking behavior; single neurons; sustained activity; vulnerability.


Conflict of interest statement

The authors declare no competing financial interests.

Figures

Figure 1.
Figure 1.
Experimental protocol, electrode placement, and DS task performance. A, After training in the DS task, animals were implanted with electrode arrays in the dmPFC and the VTA and then exposed to ISD (n = 8 rats; or handling, control animals, n = 8 rats). Behavior (S1–S5) and recording sessions (S4 and S5) were carried out the days in between social defeat episodes and after ISD. B, Representation of the histological placement of electrodes in the dmPFC and the VTA. C, Diagram illustrating the DS task protocol used in this study. D, Graphs represent the number of lever presses (mean ± SEM) and latency (mean ± SEM) during the training sessions (1–5, before ISD) and after starting ISD stress (and handling; S1–S5). Neuronal recordings were carried out during sessions S4 (1 d post-ISD) and S5 (15 d post-ISD). During the training sessions, animals learned to discriminate DS+ against DS− reflected by a decrease in the number of lever presses (trial type × session: F(4,40) = 31.25, p < 0.001, three-way ANOVA) and an increase in latency (trial type × session: F(4,24) = 8.78, p < 0.001) in DS− trials across sessions. ISD did not change DS task performance during or after ISD.
Figure 2.
Figure 2.
dmPFC and VTA neurons differently respond to reward and nonreward cues during the DS task. A, B, Heat plots represent changes in the baseline-normalized firing rate (z scores) for each unit from dmPFC (A, n = 130 units) and VTA (B, n = 32 units) in response to the cue (Tone) and lever presentation events (n = 6–7 rats). Each row is the average activity of a single unit in 200 ms windows that advanced in 50 ms steps from −1 to 3.5 s around the cue onset. Rows are aligned to corresponding task events and sorted from lowest to highest average firing rate. The line graphs are the percentage of neurons activated and inhibited by these events during DS+ and DS− trials. Units were categorized as responsive, activated, or inhibited, over time based on whether their averaged activity by 200 ms time windows was significantly different from baseline activity. C, D, Peristimulus histogram and spike raster plot examples of representative units responding during ToneR (0–0.4 s), ToneS (0.5–3 s), and Lever (3–3.4 s) in the dmPFC (C) and the VTA (D). E, F, Average of the population of responsive units activated during ToneR, ToneS, and Lever in the dmPFC (E) and the VTA (F). G, H, Bar graphs represent the percentage of units significantly activated and inhibited during ToneR, ToneS and, Lever in DS+ and DS− trials. In the dmPFC (G), there were more units responding to ToneS (χ2(2) = 6.63, p = 0.036) and Lever (χ2(2) = 14.17, p < 0.001), but not ToneR (χ2(2) = 0.18, p = 0.912), in DS+ compared with DS− trials. In the VTA (H), there were more units responding to Lever (χ2(1) = 14.76, p < 0.001), but not ToneR (χ2(1) = 0.06, p = 0.794) or ToneS (χ2(1) = 3.23, p = 0.072), in DS+ compared with DS− trials. Line graphs represent the average population activity (mean ± SEM). In the dmPFC, there were no differences between DS+ and DS− trials. In the VTA, the population activity was higher during DS+ compared with DS− trials in response to ToneS (t(31) = 3.56, p = 0.001) and Lever (t(31) = 4.62, p < 0.001, Welch's t test). I, J, Representation of single units according to their response to ToneR, ToneS, and/or Lever in the dmPFC (I) and the VTA (J). The response is the average normalized (z-score) firing rate (FR) during these task events. The graph highlights the units that respond to more than one task event.
Figure 3.
Figure 3.
ISD changes the neuronal response to reward cues in the dmPFC and the VTA. A, B, Heat plots represent changes in the baseline-normalized firing rate (z scores) for each unit from the dmPFC of control (top, n = 7 rats) and ISD (bottom, n = 7 rats) in response to cue (Tone) and lever presentation events during DS+ trials, 1 d (A; top, n = 130 units, bottom, n = 114 units) and 15 d (B; top, n = 118 units, bottom, n = 103 units) post-ISD. Each row represents the same as in Figure 2. The line graphs are the percentage of neurons activated and inhibited by these events during DS+ trials. C, E, Bar graphs represent the percentage of dmPFC units significantly activated and inhibited during ToneR, ToneS, and Lever in DS+ trials for control and ISD, 1 d (C) and 15 d (E) post-ISD. ISD decreased the number of units responding to ToneR (χ2(2) = 11.95, p = 0.002) and ToneS (χ2(2) = 8.87, p < 0.001), but not Lever (χ2(2) = 0.18, p = 0.911), 1 d post-ISD. D, F, Average population activity (mean ± SEM) in the dmPFC of control and ISD, 1 d (D) and 15 d post-ISD (F). ISD decreased dmPFC population activity 1 d (t(242) = 3.15, p = 0.001) and 15 d (t(219) = 2.03, p = 0.043, independent t test, as the average activity in response to ToneS) post-ISD. G, H, Heat plots and line graphs represent the same as in A, B, but for each unit from the VTA of control (top, n = 6 rats) and ISD (bottom, n = 6 rats) in response to cue (Tone) and lever presentation events during DS+ trials, 1 d (G; top, n = 32 units, bottom, n = 57 units) and 15 d (H; top, n = 24 units, bottom, n = 39 units) post-ISD. I, K, Bar graphs represent the percentage of VTA units significantly activated and inhibited during ToneR, ToneS, and Lever in DS+ trials for control and ISD, 1 d (I) and 15 d (K) post-ISD. ISD increased the number of units responding to ToneR (χ2(1) = 5.23, p = 0.022), but not ToneS (χ2(1) = 1.30, p = 0.253) or Lever (χ2(1) = 1.34, p = 0.246), 1 d post-ISD. J, L, Average population activity (mean ± SEM) in the VTA of control and ISD, 1 d (J) and 15 d post-ISD (L). ISD increased VTA population activity during ToneR (t(61) = 2.17, p = 0.033, Welch's t test) 1 d post-ISD, but decreased VTA population activity during ToneR (t(34) = 2.01, p = 0.050) and Lever (t(44) = 2.14, p = 0.037, Welch's t test) 15 d post-ISD. *p < 0.05 compared with Control.
Figure 4.
Figure 4.
ISD effects on VTA units characterized as putative dopamine (DA) and nondopamine (non-DA) cells. A, C, Electrophysiological characterization of the VTA units shown in this figure as putative DA and non-DA according to their basal firing rate (FR) and wave form duration, in control (n = 6 rats) and ISD (n = 6 rats), 1 d (A) and 15 d (C) post-ISD. B, D, Bar graphs represent the percentage of DA and non-DA units significantly activated during ToneR, ToneS, and Lever in DS+ trials for control and ISD, 1 d (B) and 15 d (D) post-ISD. ISD increased the number of DA and non-DA units responding to ToneR (χ2(2) = 6.10, p = 0.047), 1 d post-ISD. E, F, Average population activity (mean ± SEM) of DA and non-DA cells in control and ISD, 1 d (E) and 15 d post-ISD (F). ISD increased the population activity of non-DA cells in response to ToneR (t(13) = 3.71, p = 0.002, Welch's t test), but not DA cells (t(53) = 1.35, p = 0.180, Welch's t test), 1 d post-ISD. *p < 0.05 compared with Control.
Figure 5.
Figure 5.
ISD modulates the selectivity of VTA, but not dmPFC, units for reward cues. A, B, Temporal profile of average auROC values for responsive neurons in the dmPFC during ToneR, ToneS, and Lever, 1 d (A) and 15 d (B) post-ISD. C, D, Bars represent the average increase of auROC (compared with baseline) in the dmPFC for units responsive during ToneR, ToneS, and Lever in control (n = 7 rats) and ISD (n = 7 rats), 1 d (C) and 15 d (D) post-ISD. E, F, Temporal profile of the average auROC values for responsive neurons in the VTA during ToneR, ToneS, and Lever, 1 d (E) and 15 d (F) post-ISD. G, H, Bars represent the average increase of auROC (compared with baseline) in the VTA for units responsive during ToneR, ToneS, and Lever in control (n = 6 rats) and ISD (n = 6 rats), 1 d (G) and 15 d (H) post-ISD. Dots represent individual single units's auROC increases. *p < 0.05 compared with Control, after Welch's t test.
Figure 6.
Figure 6.
ISD differently modulates decoding accuracy of neuronal populations in the dmPFC and the VTA. A, Diagram depicting the decoding procedure. (1) For each cell at a given trial, the population activity was aligned around the cue onset time and extended to 1 s after the lever presentation (from −1 to 4 s). An example dataset from one animal consisting of n trials is shown. (2) Time stamps of average population activity for each trial were used as features to discern when neuronal populations better predicted the value of the cue. Each trial was given a label based on the value of the cue, 1 for DS+ and 0 for DS−. Then data across all animals and trials were combined to construct a full dataset with n features (100 features = 100 of 50 ms time bins) and n labels, where n was the number of all the trials across animals in each session (50 DS+ and 50 DS− trials per animal). (3) Next, the full dataset was split into training and testing sets and hyperparameters of the decoder optimized using a fivefold cross-validation within the training set. (4) After optimization, the decoder was retrained based on the full training set. Finally, the trained model was applied on testing sets to obtain decoding accuracy. This process was repeated 100 times, using different training sets, and the 10 most frequent features were selected to calculate mean accuracies for cue (Tone) and lever presentation (Lever) events during the task. B, C, Decoding accuracy in the dmPFC for control (n = 7 rats) and ISD (n = 7 rats), 1 d (B) and 15 d (C) post-ISD. D, E, Frequency of the best 10 selected features (top) and decoding accuracy (bottom) in the VTA for control (n = 6 rats) and ISD (n = 6 rats), 1 d (D) and 15 d (E) post-ISD. *p < 0.05 compared with Control, after independent t test.
Figure 7.
Figure 7.
Summary of main findings. ISD stress differently disrupts neuronal dynamics of reward encoding in the dmPFC and the VTA. The line graph is an ideal representation of the observed cue-evoked neuronal activity changes (i.e., neuronal encoding) produced by ISD, compared with Control (dashed line), 1 and 15 d after ISD. The graph includes a table (bottom) that shows the direction of the neuronal changes in both areas of the brain 1 and 15 d after stress, considering Units (% change of single units), Population (average population activity), and Accuracy (discrimination accuracy). The graph highlights the hypothesis that stress-induced vulnerability to substance abuse is a dynamic state that involves time-dependent disruptions of different reward encoding features in the dmPFC (i.e., outcome anticipation-related processing) and the VTA (i.e., salience attribution; see text).

Similar articles

References

    1. Akalin A (2020) Computational genomics with R, Ed 1. New York: CRC Press LLC.
    1. Amlung M, Marsden E, Holshausen K, Morris V, Patel H, Vedelago L, Naish KR, Reed DD, McCabe RE (2019) Delay discounting as a transdiagnostic process in psychiatric disorders: a meta-analysis. JAMA Psychiatry 76:1176–1186. 10.1001/jamapsychiatry.2019.2102 - DOI - PMC - PubMed
    1. Baik JH (2020) Stress and the dopaminergic reward system. Exp Mol Med 52:1879–1890. 10.1038/s12276-020-00532-4 - DOI - PMC - PubMed
    1. Barthas F, Hu MY, Siniscalchi MJ, Ali F, Mineur YS, Picciotto MR, Kwan AC (2020) Cumulative effects of social stress on reward-guided actions and prefrontal cortical activity. Biol Psychiatry 88:541–553. 10.1016/j.biopsych.2020.02.008 - DOI - PMC - PubMed
    1. Beckmann JS, Marusich JA, Gipson CD, Bardo MT (2011) Novelty seeking, incentive salience and acquisition of cocaine self-administration in the rat. Behav Brain Res 216:159–165. 10.1016/j.bbr.2010.07.022 - DOI - PMC - PubMed

LinkOut - more resources