. 2025 Aug;57(8):1872-1880.
doi: 10.1038/s41588-025-02250-x. Epub 2025 Jul 15.

Germline genetic variation impacts clonal hematopoiesis landscape and progression to malignancy

Affiliations

Germline genetic variation impacts clonal hematopoiesis landscape and progression to malignancy

Jie Liu et al. Nat Genet. 2025 Aug.

Abstract

With age, clonal expansions occur pervasively across normal tissues yet only in rare instances lead to cancer, despite being driven by well-established cancer drivers. Characterization of the factors that influence clonal progression is needed to inform interventional approaches. Germline genetic variation influences cancer risk and shapes tumor mutational profile, but its influence on the mutational landscape of normal tissues is not well known. Here we studied the impact of germline genetic variation on clonal hematopoiesis (CH) in 731,835 individuals. We identified 22 new CH-predisposition genes, most of which predispose to CH driven by specific mutational events. CH-predisposition genes contribute to unique somatic landscapes, reflecting the influence of germline genetic backdrop on gene-specific CH fitness. Correspondingly, somatic-germline interactions influence the risk of CH progression to hematologic malignancies. These results demonstrate that germline genetic variation influences somatic evolution in the blood, findings that likely extend to other tissues.


Conflict of interest statement

Competing interests: K.L.B. reports research grants and personal fees from Servier. E.P. is the co-founder of and holds a fiduciary role in Isabl Inc. P.N. reports research grants from Allelica, Amgen, Apple, Boston Scientific, Genentech or Roche and Novartis; personal fees from Allelica, Apple, AstraZeneca, Blackstone Life Sciences, Bristol Myers Squibb, Creative Education Concepts, CRISPR Therapeutics, Eli Lilly & Co, Esperion Therapeutics, Foresite Capital, Foresite Labs, Genentech or Roche, GV, HeartFlow, Magnet Biomedicine, Merck, Novartis, Novo Nordisk, TenSixteen Bio and Tourmaline Bio; equity in Bolt, Candela, Mercury, MyOme, Parameter Health, Preciseli and TenSixteen Bio; and spousal employment at Vertex Pharmaceuticals, all unrelated to the present work. R.L.L. is on the Supervisory Board of QIAGEN (compensation or equity), a co-founder of or board member at Ajax (equity) and a scientific advisor to Mission Bio, Kurome, Anovia, Bakx, Syndax, Scorpion, Zentalis, Auron, Prelude and C4 Therapeutics; for each of these entities he receives equity or compensation. He has received research support from the Cure Breast Cancer Foundation, Calico, Zentalis and Ajax, and has consulted for Jubilant, Goldman Sachs, Incyte, AstraZeneca and Janssen. A.G.B. reports personal fees and equity in TenSixteen Bio, all unrelated to this work. The other authors declare no competing interests.

Figures

Fig. 1
Fig. 1. Germline and CH mutational landscape of the UKBB.
a, Distribution of pathogenic germline variants by mutation type for the top-10 most-mutated dominant and recessive germline genes. Genes were classified as to whether they have been linked to any cancer in the heterozygous state (dominant) or whether they have been linked to cancer only when biallelic (recessive). b, Prevalence of CH-heme and mCA-auto by age among people stratified by germline carrier status. CH-heme stands for CH in genes with known relevance to hematologic malignancy and mCA-auto for autosomal mosaic chromosomal alterations. Data are presented as the CH prevalence fitted using polynomial regression of degree 2 (center line) ± 95% CI for the fitted line (error bands). ORs with 95% CIs were calculated using a multivariable logistic regression model comparing the odds of having CH between people with dominant (n = 33,106) or recessive (n = 43,981) germline variants in reference and those without a germline variant (n = 354,774) after adjustment for age at blood draw, the first three genetic PCs and exome sequencing batch. c, Prevalence of CH-heme in specific genes and mCA-auto types by germline carrier status.mCAs are labeled by chromosome arm and alteration type: gain (+), loss (–), or copy-neutral loss of heterozygosity (=). Multivariable logistic regression adjusted for the above covariates was performed to test for differences in the prevalence of specific CH mutations between people with (n = 73,756) and those without (n = 354,774) germline variants. *P < 0.05, **P < 0.01, ***P < 0.001. The two-sided P value is not corrected for multiple testing (see Supplementary Table 10 for exact P values).
Fig. 2
Fig. 2. Germline predisposition to CH.
a, Within the UKBB, we identified 14 cancer predisposition genes that were associated with CH-heme (red) or mCA-auto (blue). Data are presented as OR (dot) ± 95% CI (whiskers). Black diamonds indicate ORs and 95% CIs from a fixed-effects meta-analysis in our replication cohorts, which include the All of Us (n = 192,003), MGBB (n = 49,941), the Washington University CCDG (n = 37,184), TCGA (n = 7,161) and MSK-IMPACT (n = 17,016) cohorts. b, Heatmap showing the log(OR) within the UKBB between CH-heme in specific genes and germline genes that were statistically significantly (FDR-corrected P < 0.05) associated with higher risk of overall CH-heme. c, Heatmap showing the log(OR) between specific mCA-auto types and germline genes that significantly increased overall mCA-auto. The color scale is the same for b and c. Pair-wise associations that were statistically significant (P < 0.05, two sided with no correction for multiple testing) are shown in the black box in our replication cohort (solid line) and those that were directionally consistent (dashed line). For all analyses, the OR for CH was calculated using multivariable, Firth’s bias-reduced, logistic regression comparing germline carriers with individuals without germline variants, adjusted for age at blood draw, the first three genetic PCs and exome sequencing batch. *q (FDR-corrected P) < 0.05, **q < 0.01, ***q < 0.001.
Fig. 3
Fig. 3. Association between CH-predisposition genes and hematologic malignancy in the UKBB.
Germline CH-predisposition genes are shown that were also associated with the risk of hematologic malignancy (HM). Data are presented as HR ± 95% CI for myeloid (n = 1,303) or lymphoid (n = 3,963) malignancies that were calculated using Cox’s regression adjusted for age at blood draw, the first three genetic PCs and exome sequencing batch. *P < 0.05, **P < 0.01, ***P < 0.001. The two-sided P value has no correction for multiple testing. See Supplementary Table 14 for exact P values.
Fig. 4
Fig. 4. Germline–CH interactions stratify the risk of hematologic malignancy.
a, HRs (center dot) and 95% CIs for myeloid or lymphoid malignancy among people with pathogenic variants in germline genes that predispose to both CH and hematologic malignancy (HM) stratified by the presence of any CH (including any CH-heme and mCA-auto). Differences between the risk of hematologic cancer across CH-positive and CH-negative germline carriers were calculated using Firth’s bias-reduced logistic regression limited to germline variant carriers. *P < 0.1, **P < 0.01, ***P < 0.001. The two-sided P value has no correction for multiple testing (see Supplementary Table 17 for exact P values). b, Predicted distribution of 25-year absolute risk of myeloid malignancies among UKBB individuals aged 50–74 years with CHEK2 (n = 3,012), ATM (n = 1,592) or no pathogenic germline variants (n = 269,050). Analyses in both a and b were performed using Cox’s regression adjusted for age at blood draw, first three genetic PCs and exome sequencing batch. c, Comparison of distribution of 25-year absolute risk of myeloid malignancy among people at the top percentiles of risk across people with CHEK2 (n = 30), ATM (n = 14) or no germline variant (n = 2,690). The center line represents the median, the box limits the upper and lower quartiles and the whiskers 1.5× the interquartile range (IQR).
Fig. 5
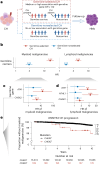
Fig. 5. Risk of CH progression to hematologic cancer varies by germline background.
a, Graphic illustration describing our analysis studying the impact of germline-selected CH on risk of hematologic cancer. We defined germline-selected CH in a given germline carrier as the presence of a CH mutation showing evidence of enrichment in that specific germline gene. bd, Risks for myeloid or lymphoid malignancy among individuals with germline-selected CH (red) compared with those with germline-nonselected CH (blue) calculated using Cox’s regression adjusted for age at blood draw, the first three genetic PCs and exome sequencing batch. Data are presented as HRs ± 95% CIs. b, HRs among all germline carriers. c,d, HRs for myeloid (c) and lymphoid (d) malignancies among specific germline gene carriers. The number of samples is as follows: germline carriers (n = 73,781), CHEK2 (n = 3,337), ATM (n = 1,736) and NTHL1 (n = 1,608). *P < 0.05, **P < 0.01, ***P < 0.001 (see Supplementary Table 18 for exact P values). e, Kaplan–Meier plot for 10-year, myeloid malignancy-free survival probability among people with DNMT3A CH mutation stratified by CHEK2 germline carrier status. The P value was derived from Cox’s regression limited to DNMT3A CH carriers, testing for a difference in the HR for developing myeloid malignancies between CHEK2 germline carriers and noncarriers. All P values are two-sided with no correction for multiple testing. Icons in a created with BioRender.com.
Extended Data Fig. 1
Extended Data Fig. 1. Distribution of CH by germline carrier status in the UK Biobank.
a. Prevalence by age for CH in gene with known relevance to both myeloid and lymphoid malignancies, only myeloid malignancies, only lymphoid malignancies or solid tumors (left), and mCA in autosomal chromosomes, loss of X chromosome, or loss of Y chromosome (right). Data are presented as the CH prevalence fitted using polynomial regression of degree 2 (center line) ± 95% confidence interval (CI) for the fitted line (error bands). b. Shown in red and blue are the odds ratios (center dot) and 95% CI (error bars) for CH categories were calculated using multivariable Firth’s bias-reduced logistic regression among people with dominant (n = 33,106) or recessive (n = 43,981) germline variant compared to those without germline variant (n = 354,774) after adjustment for age at blood draw, the first three genetic principal components, and exome sequencing batch. *Q value (FDR-corrected P value) < 0.05, **Q < 0.01, ***Q < 0.001. See Supplementary Table 9 for exact Q values. c. Comparison of the proportion of people with 1, 2 or 3 + CH and the distribution of maximum variant allele frequency between people with dominant germline variant (n = 33,106) and people with no germline variant (n = 354,774). P values for the associations between the number of CH and having dominant germline variant were derived from logistic regression and P values for the association between the maximum VAF of CH and having dominant germline variant were derived from linear regression, with adjustment for the above covariates. Center line represents median. Box limits represent upper and lower quartiles. Whiskers represent 1.5x interquartile range. Cell fractions of mCA-auto were not included due to inaccuracy. *P < 0.05, **P < 0.01, ***P < 0.001. Two-sided P values not corrected for multiple hypothesis testing.
Extended Data Fig. 2
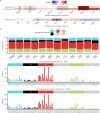
Extended Data Fig. 2. CH characteristics by germline status in the UK Biobank.
a. Heatmap showing the beta coefficients for associations between the number and maximum logVAF of CH mutations and germline genes that significantly increased overall CH-heme or mCA-auto. Shown are the coefficients from linear regression adjusted for age at blood draw, the first three genetic principal components, and exome sequencing batch. *P value < 0.05. Two-sided P value is not corrected for multiple hypothesis testing. b. Comparison of single base substitutions composition (top) and trinucleotide context (middle and bottom) for CH by germline status. Shown are genes/pathways with at least 10 SNVs. NER: Nucleotide Excision Repair, BER: Base excision repair, MMR: mismatch repair.
Extended Data Fig. 3
Extended Data Fig. 3. Association between germline predisposition genes and subtypes of hematologic malignancies in the UK Biobank.
Heatmap showing the log hazard ratio for hematologic malignancy subtypes among germline pathogenic variants carriers of genes that predispose to both CH and hematologic malignancies compared to non-carriers. ‘Secondary’ refers to hematologic cancers occurring after a solid tumor diagnosis. Hazard ratios were obtained from Cox regression adjusted for age at blood draw, the first three genetic principal components, and exome sequencing batch. *P < 0.05. Two-sided P value is not corrected for multiple hypothesis testing. AML, acute myeloid leukemia; MPN, myeloproliferative neoplasms; MDS, myelodysplastic syndromes; CML, chronic myelogenous leukemia; NHL, non-Hodgkin’s lymphoma; HL, Hodgkin’s lymphoma; CLL, chronic lymphocytic leukemia; MM, multiple myeloma.
Extended Data Fig. 4
Extended Data Fig. 4. Association of CHEK2 and ATM germline carrier status with CH and hematologic malignancies by germline variant type in the UK Biobank.
a. Shown in red and blue are the odds ratios (center dot) and 95% confidence intervals (error bars) for CH-heme and mCA-auto among people with germline CHEK2 loss of function variants, CHEK2 missense variants, ATM loss of function variants or ATM missense variants compared to non-carriers. The odds ratios were calculated using multivariable Firth’s bias-reduced logistic regression adjusted for age at blood draw, the first three genetic principal components, and exome sequencing batch. b. Shown in red and blue are the hazard ratios (center dot) and 95% confidence intervals (error bars) for myeloid and lymphoid malignancies by CHEK2 or ATM germline variant type. The hazard ratios were calculated using Cox regression adjusted for the same covariates as above. The number of individuals for above analyses are as follows: germline CHEK2 loss of function variant carriers (n = 2,670), CHEK2 missense variant carriers (n = 1,318), ATM loss of function variant carriers (n = 1,564) and ATM missense variant carriers (n = 535). *P < 0.05, **P < 0.01, ***P < 0.001. Two-sided P value is not corrected for multiple hypothesis testing. See Supplementary Tables 15, 16 for exact P values.

References

    1. Alexandrov, L. B. et al. The repertoire of mutational signatures in human cancer. Nature578, 94–101 (2020). - PMC - PubMed
    1. Nik-Zainal, S. et al. Landscape of somatic mutations in 560 breast cancer whole-genome sequences. Nature534, 47–54 (2016). - PMC - PubMed
    1. Campbell, P. J. et al. Pan-cancer analysis of whole genomes. Nature578, 82–93 (2020). - PMC - PubMed
    1. Middlebrooks, C. D. et al. Association of germline variants in the APOBEC3 region with cancer risk and enrichment with APOBEC-signature mutations in tumors. Nat. Genet.48, 1330–1338 (2016). - PMC - PubMed
    1. Nik-Zainal, S. et al. Association of a germline copy number polymorphism of APOBEC3A and APOBEC3B with burden of putative APOBEC-dependent mutations in breast cancer. Nat. Genet.46, 487–491 (2014). - PMC - PubMed

LinkOut - more resources