. 2025 Aug;27(8):1367-1380.
doi: 10.1038/s41556-025-01709-7. Epub 2025 Jul 15.

Differentiation, ageing and leukaemia alter the metabolic profile of human bone marrow haematopoietic stem and progenitor cells

Affiliations

Differentiation, ageing and leukaemia alter the metabolic profile of human bone marrow haematopoietic stem and progenitor cells

Maria-Eleni Lalioti et al. Nat Cell Biol. 2025 Aug.

Abstract

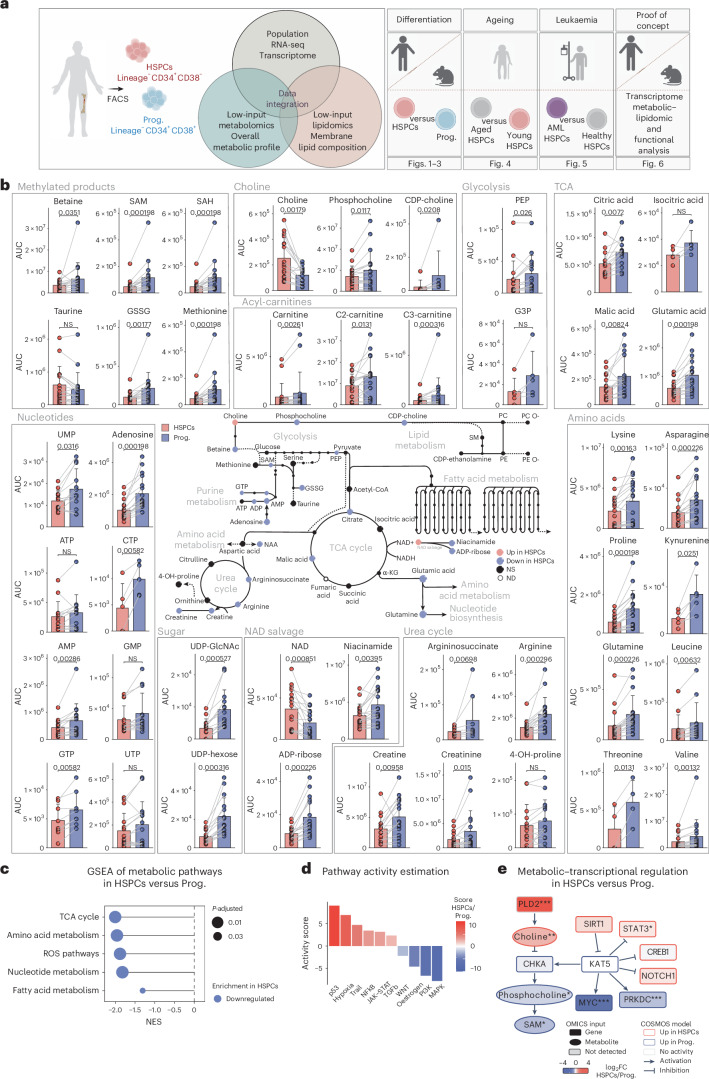
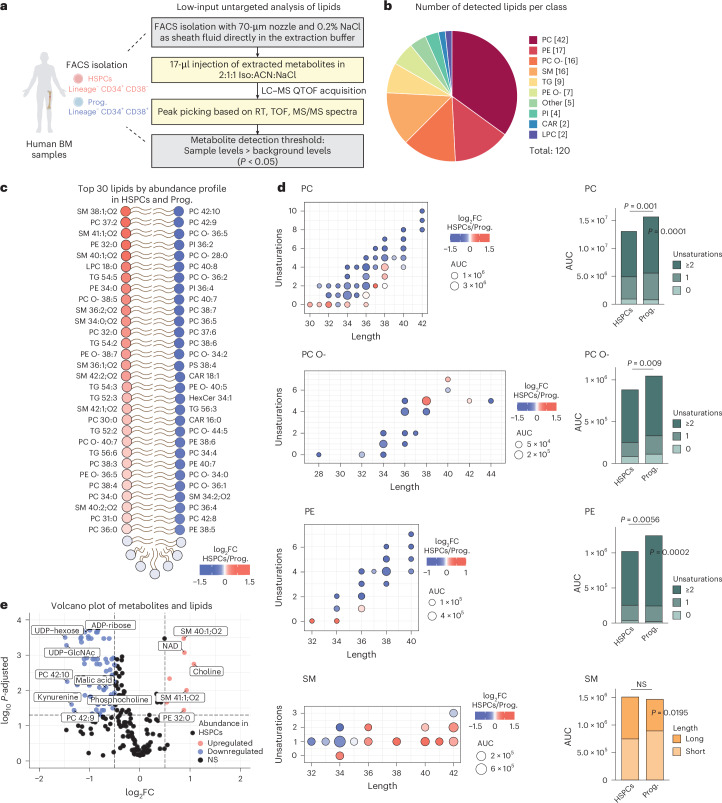
Metabolic cues are crucial for regulating haematopoietic stem and progenitor cells (HSPCs). However, the metabolic profile of human HSPCs remains poorly understood due to the limited number of cells and the scarcity of bone marrow samples. Here we present the integrated metabolome, lipidome and transcriptome of human adult HSPCs (lineage-, CD34+, CD38-) upon differentiation, ageing and acute myeloid leukaemia. The combination of low-input targeted metabolomics with our newly optimized low-input untargeted lipidomics workflow allows us to detect up to 193 metabolites and lipids from a starting material of 3,000 and 5,000 HSPCs, respectively. Among other findings, we observe elevated levels of the essential nutrient choline in HSPCs compared with downstream progenitors, which decline upon ageing and further decrease in acute myeloid leukaemia. Functionally, we show that choline supplementation fuels lipid production in HSPCs and enhances stemness. Overall, our study provides a comprehensive resource identifying metabolic changes that can be utilized to promote and enhance human stem cell function.


Conflict of interest statement

Competing interests: J.S.-R. reports funding from GSK, Pfizer and Sanofi and fees/honoraria from Travere Therapeutics, Stadapharm, Astex, Owkin, Pfizer and Grunenthal. A.D. reports funding from Pfizer. G.G. received research funds from Abbvie Inc., Kinomica Inc., Menarini Richerche Inc. and Arcellx. The other authors declare no competing interests.

Figures

Fig. 1
Fig. 1. Metabolic profile of human BM HSPCs and their downstream progenitors.
a, The experimental study design depicting the generated datasets and their respective figure numbers. Created with BioRender.com. b, A schematic summary of the metabolomics results per pathway in human HSPCs and progenitors. Quantification bar plots as mean ± standard deviation show raw intensity values per biological replicate. Paired samples are linked by grey lines. Differentially abundant metabolites are depicted as coloured dots in the scheme. n = 17. P-adjusted value after paired two-sided Student’s t-test or Wilcoxon test is shown. NS, not significant; ND, not detected. c, GSEA of metabolic pathways on RNA-seq of human HSPCs versus progenitors. n = 4. d, Pathway activity score estimated by decoupleR in HSPCs versus progenitors RNA-seq. Differentially activated pathways are shown (P < 0.05). e, A subnetwork representing the COSMOS mechanistic hypothesis of metabolic and transcriptomic regulation of choline pathway, based on HSPCs versus progenitors metabolomics and RNA-seq datasets. Each node represents a gene or metabolite. The border colour depicts the estimated activity by the model. The arrow shape corresponds to the type of regulation based on ground knowledge. The fill colour of elements shows their level of differential expression or abundance in our measured data. P-adjusted value; *P < 0.05, **P < 0.01, ***P < 0.001. In b and c, n indicates the number of biological replicates per condition. For b, ten independent experiments were performed. NAA, N-acetylaspartic acid; α-KG, alpha-ketoglutarate; PEP, 2-phosphoenolpyruvate; GSSG, glutathione disulfide.
Fig. 2
Fig. 2. Lipid composition of human HSCs and their progenitors.
a, The workflow of the method and analysis of low-input untargeted lipidomics in human HSPCs and progenitors. Created with BioRender.com. b, A pie chart depicting the number of detected lipids per class, with the total number per class indicated in square brackets. c, Lipheat depicting the top 30 detected lipids in HSPCs or progenitors ranked by log2FC value. n = 14. d, Left: dot plots depicting the total number of carbons (length) and double bonds (unsaturations) in the acyl chains of detected lipids, categorized by class. Colour shows the log2FC abundance in HSPCs versus progenitors. The dot size corresponds to the mean signal intensity of the detected peaks per lipid across all biological replicates. Right: bar plots of the summed signal intensity of lipids per class in HSPCs and progenitors. Subclasses were based on unsaturation levels (saturated (0 unsaturation), monounsaturated (1 unsaturation) and polyunsaturated (≥2 unsaturations)) or acyl-chain length (short (<36 carbons) and long (≥36 carbons)). Significantly different abundances per class and subclass are shown. Paired two-sided Student’s t-test or Wilcoxon test. e, A volcano plot of differentially abundant detected metabolites and lipids between HSPCs and progenitors. P-adjusted value after paired Student’s t-test or Wilcoxon test. NS, not significant. In c, n indicates the number of biological replicates per condition. For bd, eight independent experiments were performed. Iso, isopropanol; CAR, carnitines; LPC, lyso-PC; PI, phosphatidylinositol; TG, triacylglyceride.
Fig. 3
Fig. 3. Metabolic and lipidomic profile of mouse HSCs and progenitors.
a, The experimental design to characterize the metabolome of mouse HSCs and progenitors. The input material per sample, number and type of detected metabolites and genes are indicated. b, A schematic summary of metabolomics results per pathway in mouse HSCs and progenitors. Quantification bar plots as mean ± standard deviation show raw values per biological replicate. Paired samples are linked by grey lines. Differentially abundant metabolites are depicted as coloured dots in the scheme. n = 13. P-adjusted value after paired two-sided Student’s t-test or Wilcoxon test is shown. c, The experimental design to characterize the lipidome of mouse HSCs and progenitors. The input material per sample, number and type of detected lipids are indicated. d, Bar plots of the summed signal intensity of lipids per class in HSCs and progenitors. Subclasses were based on unsaturation levels or acyl-chain length. Significantly different abundances per class and subclass are shown. Paired two-sided Student’s t-test or Wilcoxon test. e, Lipheat depicting the detected lipids in HSCs versus progenitors ranked by log2FC value. n = 10. In b and d, n indicates the number of biological replicates per condition. For b, four independent experiments were performed. For d and e, three independent experiments were performed. Panels a and c created with BioRender.com.
Fig. 4
Fig. 4. Metabolic and lipidomic profile of human HSPCs upon ageing.
a, The experimental design to characterize the metabolome of aged and young human HSPCs. b, A schematic summary of metabolomics results per pathway in human young and aged HSPCs. Quantification bar plots as mean ± standard deviation show raw values per biological replicate. Differentially abundant metabolites are depicted as coloured dots in the scheme. n = 14–17. P-adjusted value after unpaired two-sided Student’s t-test or Wilcoxon test is shown. c, Pearson correlation between metabolite abundance and age in patients in which these data were provided. Linear model, correlation coefficient and P value are depicted. d, The experimental design to characterize the lipidome of aged and young human HSPCs. e, Lipheat depicting the detected lipids in HSPCs versus progenitors ranked by log2FC value. n = 6–10. f, Left: dot plots depicting the total number of carbons (length) and double bonds (unsaturations) in the acyl chains of detected lipids, categorized by class. Colour shows the log2FC abundance in aged versus young HSPCs. Dot size corresponds to the mean signal intensity of the detected peaks per lipid across all biological replicates. Right: bar plots of the summed signal intensity of lipids per class in aged and young HSPCs. Subclasses were based on unsaturation levels or acyl-chain length. Significantly different abundances per class and subclass are shown. Paired two-sided Student’s t-test or Wilcoxon test. g, Metabolograms integrating metabolomics, lipidomics and transcriptomics data on selected KEGG pathways or modules. Colour represents the log2FC between aged and young HSPCs. Inner circles indicate the average tendencies, and outer circles show individual genes or metabolites and lipids. P-adjusted value; *P < 0.05, **P < 0.01, ***P < 0.001. In b and e, n indicates the number of biological replicates per condition. For b, 13 independent experiments were performed. For e and f, nine independent experiments were performed. Panels a and d created with BioRender.com.
Fig. 5
Fig. 5. Metabolic profile of AML HSPCs.
a, The experimental design to characterize the metabolome and transcriptome of HSPCs (lineage CD34+ CD38) from healthy participants and patients with AML. The input material per sample and number of detected metabolites and genes are indicated. Created with BioRender.com. b, A heat map of all detected metabolites passing quality thresholds in human targeted metabolomics of AML and healthy HSPCs. The log2FC values between each AML biological replicate and the average of healthy HSPCs are depicted. n = 15–17; 2-HG, 2-hydroxyglutarate. c, PCA of AML HSPC samples normalized to their healthy counterparts based on all detected metabolites. Colour depicts the categorization of patients based on their common mutations. Lines represent two groups based on the amino acids levels compared with healthy participants. d, A volcano plot of transcriptome differentially expressed genes (DEGs) in TET2-mutated AML versus healthy HSPCs. P-adjusted value. n = 3–7. e, GSEA of cellular amino acid metabolic process GO term in TET2-mutated AML versus healthy HSPC RNA-seq. P-adjusted value. f, A heat map representing the relative expression of differentially expressed KEGG enzymes in TET2-mutated AML versus healthy HSPCs (log2FC threshold of 1, P-adjusted < 0.05), classified in their respective metabolic pathways. In bd, n indicates the number of biological replicates per condition. For b, 12 independent experiments were performed. PC, principal component.
Fig. 6
Fig. 6. Choline supplementation fuels lipid composition and preserves HSPC function.
a, The experimental design to characterize the effect of choline on mouse HSCs. HSCs were treated with 5 mM choline (or control treatment) for 48 h before functional analysis or subsequently FACS sorted for metabolomics and lipidomics. b, A schematic summary illustrating the detected metabolites and lipid classes in choline-treated versus control HSCs. Coloured dots represent log2FC values. n = 6. c, Bar plots of the summed signal intensity of lipids per class in choline-treated and control HSCs. Subclasses were based on unsaturation levels or acyl-chain length. Significantly different abundances per class and subclass are shown. Paired two-sided Student’s t-test or Wilcoxon test. d, Single-cell (SiC) division assay after 48 h in vitro treatment of mouse HSCs with 5 mM choline (or control treatment). The percentage of cells is shown. n = 11. e, CFU assay of mouse HSCs treated with 5 mM choline (or control treatment). The total number of colonies is depicted. n = 6. f, The experimental design to characterize the effect of choline on human HSPCs. Human HSPCs were treated with 10 mM choline (or control treatment) for 48 h before functional analysis or subsequently FACS sorted for population RNA-seq and metabolomics and lipidomics after stable isotope labelling. g, A schematic representation depicting the incorporation of 13C-labelled choline in metabolomics and lipidomics after 72 h treatment in human HSPCs. Pie charts show the ratio of 13C-labelled lipid species per class based on unsaturation levels and acyl-chain length. n = 6. h, GSEA of selected metabolic pathways in RNA-seq of choline-treated versus control HSPCs. n = 3. i, A volcano plot of transcriptome DEGs in choline-treated versus control HSPCs. j, The TF activity score estimated by decoupleR in choline-treated versus control HSPC RNA-seq. The top seven differentially activated pathways per condition are shown (P < 0.05). k, The GSEA profile of HSC signature in choline-treated versus control HSPC RNA-seq. l, SiC division assay after 48 h in vitro treatment of human HSPCs with 10 mM choline (or control treatment). The percentage of cells is shown. n = 6. m, CFU assay of human HSPCs treated with 10 mM choline (or control treatment). The total number of colonies is depicted. n = 12. n, The experimental design to characterize the effect of choline on aged human HSPCs. HSPCs were treated with 10 mM choline (or control treatment) for 48 h before functional analysis or population RNA-seq. o, GSEA profile of HSC signature in choline-treated versus control aged HSPCs RNA-seq. n = 3. p, CFU assay of human aged HSPCs treated with 10 mM choline (or control treatment). The total number of colonies is depicted. n = 8. In d, e, l, m and p, data are presented as mean ± s.d. For d and l, statistical significance was determined using two-way ANOVA; for e, m and p statistical significance was determined using paired Student’s t-test. n indicates the number of biological replicates per condition. For b, c and g, two independent experiments were performed. For m and p, five and four independent experiments were performed, respectively. Panels a, f and n created with BioRender.com. Source data
Extended Data Fig. 1
Extended Data Fig. 1. Metabolic profile of human BM HSPCs and their downstream progenitors.
a, Experimental design and gating to characterize the targeted metabolomics and transcriptome of human HSPCs and progenitors. The input material per sample, number and type of detected metabolites and genes are indicated. b, Workflow of method and downstream analysis of low input targeted polar metabolomics in human HSPCs and progenitors. c, Venn diagram representing the detected metabolites above threshold with an input material of 1,000, 3,000, or 5,000 HSPCs. Number of metabolites per dataset is shown. n = 6. d, Representative example of metabolomics peaks in HSPCs, progenitors and background levels (Negative Control). Signal intensity was assessed by picking peaks with the same retention times as their respective qualifiers (green and blue lines). AUC, area under the curve. e, Metabolomics Principal component analysis (PCA) of HSPCs and progenitors isolated under different freezing conditions and from various sources as quality control. Conditions included samples with and without prior freezing; sources included commercially available samples (Stem Cell Technology; SCT) or hospital-derived samples. The analysis was based on significantly variable metabolites. n = 7. f, PCA of HSPCs and progenitors RNA-seq samples based on the top 500 most variable genes. n = 4. g, Volcano plot of differentially expressed genes (DEGs) in HSPCs vs progenitors RNA-seq. P-adjusted value. NS, not significant. h, Heatmap representing relative expression of differentially expressed KEGG enzymes in HSPCs vs progenitors (log2FC threshold = 1, p-adjusted < 0.05), classified in their respective metabolic pathways. i, Gene Set Enrichment Analysis (GSEA) of selected Gene Ontology (GO) processes on RNA-seq of HSPCs vs progenitors. P-adjusted value. NES, Normalized Enrichment Score. j, TF activity score estimated by decoupleR in HSPCs vs progenitors RNA-seq. Top 12 differentially activated TFs per condition are shown (p-value < 0.05). (c, e, f) n indicates the number of biological replicates per condition. For (c), 4 independent experiments were performed. For (e), 5 independent experiments were performed.
Extended Data Fig. 2
Extended Data Fig. 2. Metabolic profile of human BM HSPCs and their downstream progenitors.
a, Pearson correlation between enzyme expression and metabolite abundance per sample in selected KEGG pathways. Color and size of the dots represent the correlation coefficients. n = 4. Correlation p-value; *p < 0.05. b, Metabolograms integrating metabolomics and transcriptomics data on selected KEGG pathways. Color represents the log2FC between HSPCs and progenitors. Inner circles indicate the average tendencies, and outer circles show individual genes/metabolites. P-adjusted value; *p < 0.05, **p < 0.01, ***p < 0.001. c, Subnetwork representing the COSMOS mechanistic hypotheses of metabolic/transcriptomic regulation of multiple connected pathways, based on HSPCs vs progenitors metabolomics and RNA-seq datasets. Each node represents a gene or metabolite. The border color depicts the estimated activity by the model. Arrow shape corresponds to the type of regulation based on ground knowledge. The fill color of elements shows their level of differential expression or abundance in our measured data. P-adjusted value; *p < 0.05, **p < 0.01, ***p < 0.001. (a) n indicates the number of biological replicates per condition.
Extended Data Fig. 3
Extended Data Fig. 3. Lipid composition of human HSPCs and progenitors.
a, Experimental design and gating to characterize the lipidome of human HSPCs and progenitors. The input material per sample, number and type of detected lipids are indicated. b, Example of extracted ion chromatogram (EIC) peak. c, Lipidomics PCA of HSPCs and progenitors isolated under different freezing conditions and from various sources as quality control. Conditions included samples with and without prior freezing; sources included commercially available samples (Stem Cell Technology; SCT) or hospital-derived samples. The analysis was based on significantly variable lipids. n = 9. d, Heatmap of all detected lipids passing quality thresholds in human untargeted lipidomics of HSPCs and progenitors. The log2FC values between paired HSPCs and progenitors per individual are depicted. n = 14. ND, not detected. e, Barplots of the summed signal intensity of lipids per class in HSPCs and progenitors. Subclasses were based on unsaturation levels [saturated (0 unsaturation), monounsaturated (1 unsaturation) and polyunsaturated (≥2 unsaturations)] or acyl-chain length [short (<36 carbons) and long (≥36 carbons)]. Significantly different abundances per class and subclass are shown. Paired two-sided Student’s t test or Wilcoxon test. NS, not significant; AUC, area under the curve. (c) n indicates the number of biological replicates per condition. For (c), 5 independent experiments were performed. For (d, e), 8 independent experiments were performed.
Extended Data Fig. 4
Extended Data Fig. 4. Lipid composition of human HSPCs and progenitors.
a, Metabolograms integrating metabolomics/lipidomics and transcriptomics data on selected KEGG pathways or modules. Color represents the log2FC between HSPCs and progenitors. Inner circles indicate the average tendencies, and outer circles show individual genes and metabolites/lipids. P-adjusted value; *p < 0.05, **p < 0.01, ***p < 0.001. b, PCA of HSPCs and progenitors based on metabolomics and lipidomics. The analysis was based on significantly variable metabolites and lipids. n = 24. NS, not significant. (b) n indicates the number of biological replicates per condition.
Extended Data Fig. 5
Extended Data Fig. 5. Metabolic and lipidomic profile of mouse HSCs and progenitors.
a, Representative FACS gating scheme of mouse HSCs (LSK CD150+ CD48-) and progenitors (LS-K). b, Heatmap of all detected metabolites passing quality thresholds in both mouse and human targeted metabolomics of HSCs/HSPCs and progenitors. The log2FC values between paired HSCs/HSPCs and progenitors per individual are depicted. n = 13 and 17 for mouse and human, respectively. (b) n indicates the number of biological replicates per condition.
Extended Data Fig. 6
Extended Data Fig. 6. Metabolic and lipidomic profile of human HSPCs upon aging.
a, Experimental design to characterize the metabolome and transcriptome of young and aged human HSPCs. The input material per sample is indicated. b, PCA of young and aged HSPCs RNA-seq samples based on the top 500 most variable genes. n = 4–7. c, Volcano plot of transcriptome DEGs in young vs aged HSPCs. P-adjusted value. NS, not significant. d, Heatmap representing relative expression of differentially expressed KEGG enzymes in young vs aged HSPCs (log2FC threshold = 1, p-adjusted < 0.05), classified in their respective metabolic pathways. e, GSEA of selected GO processes on RNA-seq of aged vs young HSPCs. P-adjusted value. f, GSEA of selected metabolic pathways on RNA-seq of aged vs young HSPCs. P-adjusted value. g, Pathway activity score estimated by decoupleR in young vs aged HSPCs RNA-seq. Differentially activated pathways are shown (p-value < 0.05). h, Heatmap of all detected metabolites passing quality thresholds in human targeted metabolomics of aged and young HSPCs. The log2FC values between each aged biological replicate and the average of young HSPCs are depicted. n = 14–17. ND, not detected. (b, h) n indicates the number of biological replicates per condition. For (h), 13 independent experiments were performed.
Extended Data Fig. 7
Extended Data Fig. 7. Metabolic and lipidomic profile of human HSPCs upon aging.
a, Experimental design to characterize the lipidome of young and aged human HSCs. The input material per sample is indicated. b, Heatmap of all detected lipids passing quality thresholds in untargeted lipidomics of human aged and young HSPCs. The log2FC values between each aged biological replicate and the average of young HSPCs are depicted. n = 6–10. ND, not detected. c, Left, dotplots depicting the total number of carbons (length) and double bonds (unsaturations) in the acyl-chains of detected lipids, categorized by class. Color shows the log2FC abundance in aged vs young HSPCs. Dot size corresponds to the mean signal intensity of the detected peaks per lipid across all biological replicates. Right, barplots of the summed signal intensity of lipids per class in aged and young HSPCs. Subclasses were based on unsaturation levels or acyl-chain length. Differential abundances per class and subclass are shown. Paired two-sided Student’s t test or Wilcoxon test. NS, not significant; AUC, area under the curve. d, PCA of aged and young HSPCs based on metabolomics and lipidomics. The analysis was based on significantly variable metabolites and lipids. n = 14–17. e, Volcano plot of differentially abundant metabolites and lipids in aged and young HSPCs. P-adjusted value. NS, not significant. (b, d) n indicates the number of biological replicates per condition. For (b, c), 8 independent experiments were performed.
Extended Data Fig. 8
Extended Data Fig. 8. Metabolic profile of AML-HSPCs.
a, PCA of AML and healthy HSPCs RNA-seq samples based on the top 500 most variable genes. n = 3–7. b, GSEA of GO processes on RNA-seq of TET2 mutated AML vs healthy HSPCs. P-adjusted value. c, GSEA of selected metabolic processes on RNA-seq of TET2 mutated AML vs healthy HSPCs. P-adjusted value. (a) n indicates the number of biological replicates per condition.
Extended Data Fig. 9
Extended Data Fig. 9. Choline supplementation modulates lipid composition and preserves HSPC function.
a, Gating scheme for apoptosis quantification by Annexin V and DAPI staining. b, Apoptosis quantification in mouse HSCs after 48 h choline treatment using Annexin V and DAPI staining. c, Heatmap of all detected lipids passing quality thresholds in untargeted lipidomics of choline-treated and control HSCs. The log2FC values between paired choline-treated and control HSCs per individual are depicted. n = 6. d, Barplots of the summed signal intensity of lipids per class in choline-treated and control HSCs. Subclasses were based on unsaturation levels or acyl-chain length. Paired two-sided Student’s t test or Wilcoxon test. e, Representation of incorporation of 13C-labelled choline in metabolomics and lipidomics after 72 h treatment in human HSPCs. Pie charts depict the ratio of 13C-labelled metabolites or lipid species per class based on unsaturation levels and acyl-chain length. Size in lipid pie charts represents signal intensity. n = 6. AUC, area under the curve. f, GSEA of selected GO processes on choline vs control treated human HSPCs. P-adjusted value. n = 3. g, Volcano plot of transcriptome depicting SREBF1 (left) and SREBF2 (right) target genes in choline vs control treated HSPCs by decoupleR. Color shows the regulation of targets by the respective TF. P-adjusted value. h, i-cisTarget prediction of TF regulatory motifs in up-regulated genes in choline vs control treated human HSPCs. TF logo is depicted. NES, Normalized Enrichment Score. i, Apoptosis quantification in human CD34+ cells after 48 h choline treatment using Annexin V and DAPI staining. j, GSEA of selected GO processes on choline vs control treated human aged HSPCs. P-adjusted value. n = 3. (b) Data are presented as mean ± SD. (c, e, f and i) n indicates the number of biological replicates per condition. For (ce), 2 independent experiments were performed. Source data

References

    1. Walter, D. et al. Exit from dormancy provokes DNA-damage-induced attrition in haematopoietic stem cells. Nature520, 549–552 (2015). - PubMed
    1. Cabezas-Wallscheid, N. et al. Vitamin A–retinoic acid signaling regulates hematopoietic stem cell dormancy. Cell169, 807–823 (2017). - PubMed
    1. Wilson, A. et al. Hematopoietic stem cells reversibly switch from dormancy to self-renewal during homeostasis and repair. Cell135, 1118–1129 (2008). - PubMed
    1. Laurenti, E. et al. CDK6 levels regulate quiescence exit in human hematopoietic stem cells. Cell Stem Cell16, 302–313 (2015). - PMC - PubMed
    1. Takayama, N. et al. The transition from quiescent to activated states in human hematopoietic stem cells is governed by dynamic 3D genome reorganization. Cell Stem Cell28, 488–501 (2021). - PubMed

MeSH terms