. 2025 Aug;17(8):2137-2162.
doi: 10.1038/s44321-025-00268-6. Epub 2025 Jul 15.

Cold exposure promotes the progression of osteoarthritis through downregulating APOE in cartilage

Affiliations

Cold exposure promotes the progression of osteoarthritis through downregulating APOE in cartilage

Yueqi Zhang et al. EMBO Mol Med. 2025 Aug.

Abstract

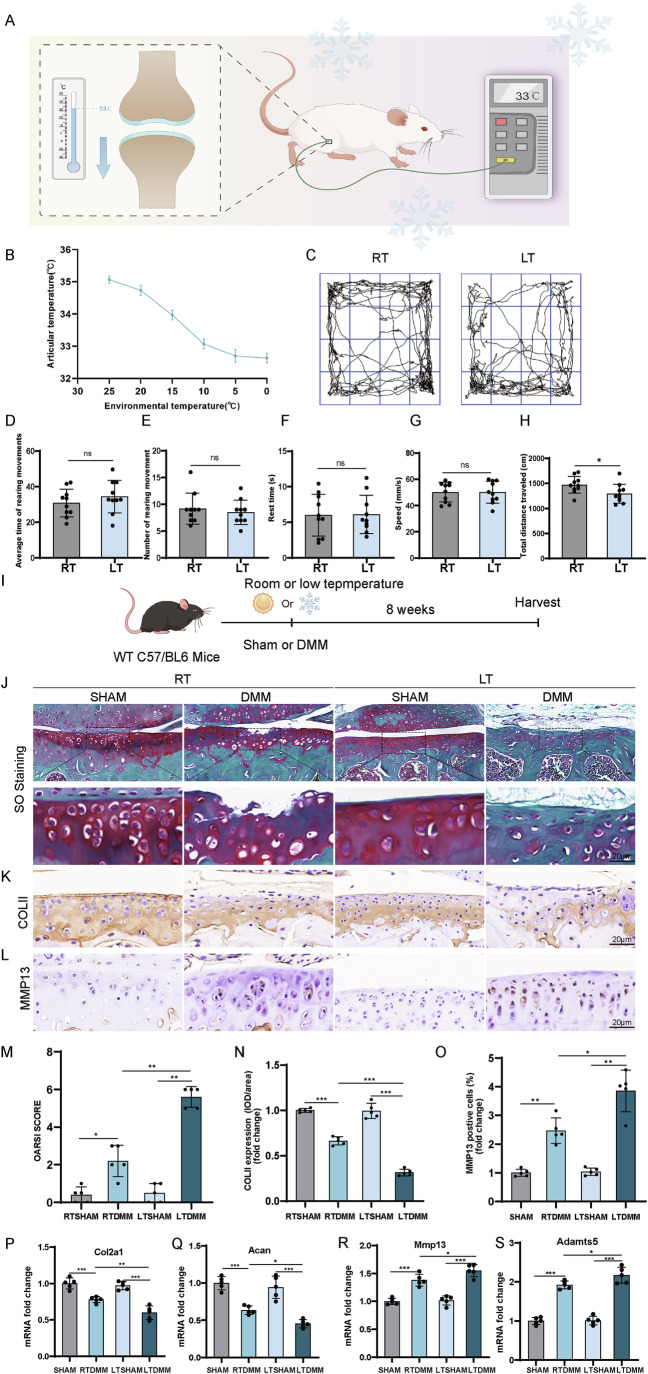
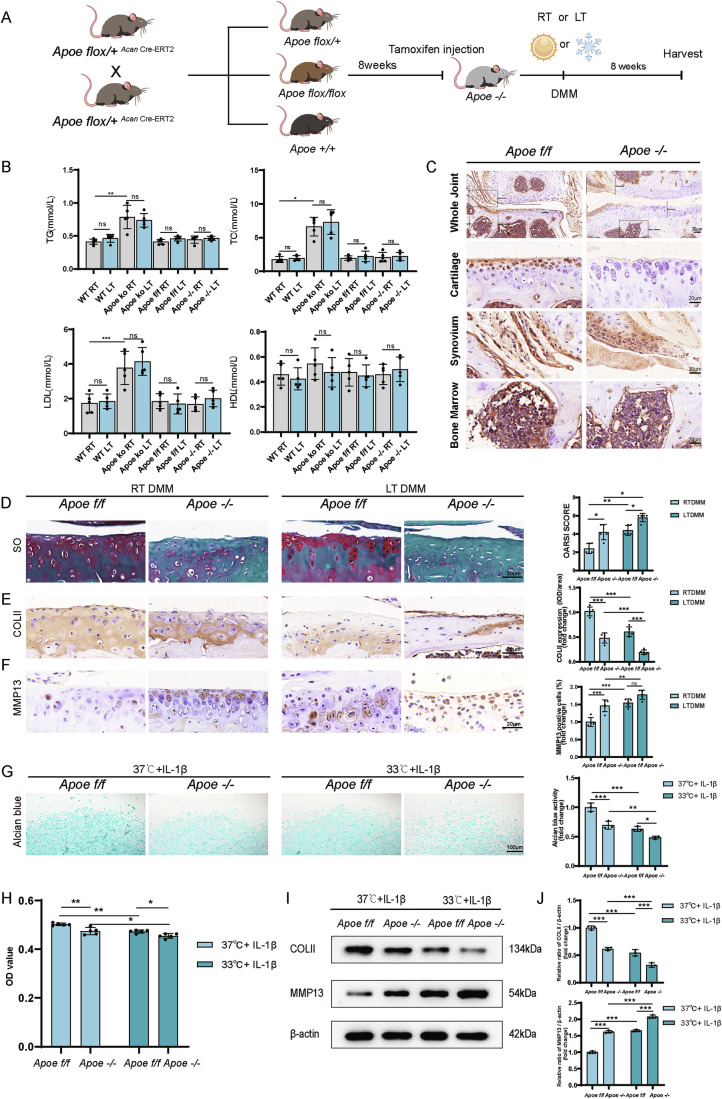
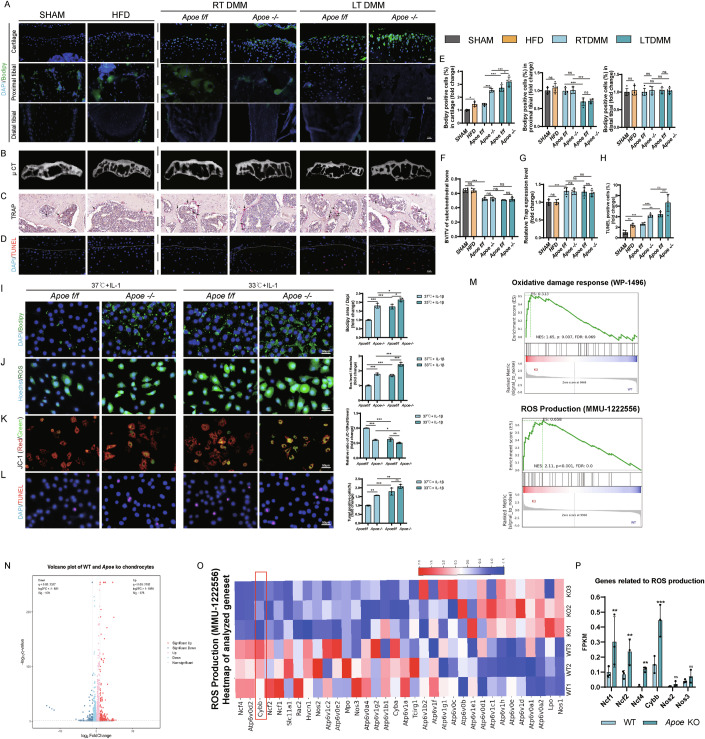
Osteoarthritis (OA) is a degenerative joint disease with limited effective therapies. Cold weathers have been shown to affect joint pain in OA patients. However, the impact of cold climate on OA progression is debated, with the underlying mechanisms not fully understood. This study aims to elucidate the role of Apolipoprotein E (Apoe) in chondrocytes in relation to OA progression under cold exposure. Both human chondrocytes RNA sequencing and DMM mice OA model revealed that lower temperatures significantly downregulated Apoe expression, correlating with OA exacerbation. Conditional knockout of Apoe in cartilage aggravated cartilage degeneration, leading to lipid accumulation, increased ROS production, mitochondrial dysfunction, and elevated chondrocyte apoptosis. Treatment with RGX-104, an LXRβ agonist, reversely restored APOE expression, mitigated aberrant lipid accumulation and countered the detrimental effects of cold exposure on OA progression. These results suggest that targeting lipid transfer and metabolism, especially through Apoe modulation, may offer therapeutic strategies for OA patients residing in colder climates, such as those at high altitudes and latitudes, and even winter season.

Keywords: Apolipoprotein E; Cold Exposure; Lipid Accumulation; Osteoarthritis; ROS.


Conflict of interest statement

Disclosure and competing interests statement. The authors declare no competing interests.

Figures

Figure 1
Figure 1. Low temperature exacerbated the progression of OA in DMM mouse model.
(A) Scheme of measurement of articular temperature of the mice. (B) Curve of articular temperature changing with ambient temperature (n = 3 for each ambient temperature). (C) Pathway image of the open test of mice at different temperatures. (D) Average time of rearing movements (n = 10). (E) Number of rearing movement (n = 10). (F) Rest time (n = 10). (G) Speed (n = 10). (H) Total distance traveled (n = 10). P = 0.0401. (I) Schematic illustration showing the design of DMM surgery of mice and exposure of room or low temperature. (J) Safranin O/Fast Green staining of the mice knee joints. (K) Immunohistochemistry staining of COLII in the mice knee joints. (L) Immunohistochemistry staining of MMP13 in the mice knee joints. (M) OARSI score of the mice knee joints (n = 5). P = 0.0159 (RTSHAM vs. RTDMM), P = 0.0079 (RTDMM vs. LTDMM), P = 0.0079 (LTSHAM vs. LTDMM). (N) Analysis of COLII level (n = 5). P < 0.0001 (RTSHAM vs. RTDMM), P < 0.0001 (RTDMM vs. LTDMM), P < 0.0001 (LTSHAM vs. LTDMM). (O) Analysis of MMP13 level (n = 5). P = 0.0041 (RTSHAM vs. RTDMM), P = 0.0349 (RTDMM vs. LTDMM), P = 0.0028 (LTSHAM vs. LTDMM). (P) mRNA fold change of Col2a1 (n = 5). P = 0.0006 (RTSHAM vs. RTDMM), P = 0.0039 (RTDMM vs. LTDMM), P < 0.0001 (LTSHAM vs. LTDMM). (Q) mRNA fold change of Acan (n = 5). P < 0.0001 (RTSHAM vs. RTDMM), P = 0.0376 (RTDMM vs. LTDMM), P < 0.0001 (LTSHAM vs. LTDMM). (R) mRNA fold change of Mmp13 (n = 5). P < 0.0001 (RTSHAM vs. RTDMM), P = 0.0423 (RTDMM vs. LTDMM), P < 0.0001 (LTSHAM vs. LTDMM). (S) mRNA fold change of Adamts5 (n = 5). P < 0.0001 (RTSHAM vs. RTDMM), P = 0.0467 (RTDMM vs. LTDMM), P < 0.0001 (LTSHAM vs. LTDMM). Statistical analysis was performed using Student’s t test (D, FH), Mann–Whitney test (E, M), and one-way ANOVA test (NS). Data are shown as mean ± SD (error bar) (*P < 0.05, **P < 0.01,***P < 0.001). Source data are available online for this figure.
Figure 2
Figure 2. Apoe was identified as a protective gene in OA which was downregulated by cold temperature.
(A) The volcano plot of DEGs between 37 °C OA and 33 °C OA group (n = 3 patients per group). (B) The Wayne plot showed the overlapping temperature-relevant DEGs in both OA groups and non-OA groups. (C) The heatmap showed the expression level of the temperature-relevant DEGs (top 30) in 33 °C OA and 37 °C OA group. (D) KEGG analysis of DEGs related to lipid metabolism. (E) Immunohistochemistry analysis of APOE expression in the knee joint of mice. (F) Protein expression of APOE in the murine chondrocytes with IL-1β treatment and exposure of 33 °C. (G) Statistical analysis of APOE expression in mice cartilage (n = 5). P < 0.0001 (SHAM vs. RTDMM), P < 0.0001 (SHAM vs. LTSHAM), P = 0.0022 (RTDMM vs. LTDMM), P = 0.0080 (LTSHAM vs. LTDMM). (H) Protein analysis of APOE in chondrocytes (n = 3 each). P = 0.0009 (33 °C + IL-1 vs. 37 °C + IL-1), P = 0.0002 (33 °C vs. 33 °C + IL-1). (I) Map of average temperature in China from December, 2019 to February, 2020. (J) Immunohistochemistry staining of APOE, COLII, MMP13 and Safranin O/Fast Green staining of medial and lateral compartments of human knee joints from Southern or Northern China. (K) Latitude-temperature trend plot showing the relationship between knee temperature in osteoarthritis (OA) patients, ambient environmental temperature, and geographic latitude across northern and southern regions of China (n = 4 for Guangzhou, n = 6 for Shanghai, n = 4 for Jinan, n = 4 for Beijing and n = 2 for Shenyang). (L) Statistical analysis of articular temperature from Northern and Southern cities (n = 10 each). P < 0.0001. (M) Mankin score of human knee cartilage (n = 10). P < 0.0001 (LC in South vs. MC in South), P = 0.0264 (MC in South vs. MC in North), P < 0.0001 (LC in North vs. MC in North). (N) Immunohistochemistry analysis of COLII level in human cartilage (n = 10). P < 0.0001 (LC in South vs. MC in South), P = 0.4458 (MC in South vs. MC in North), P < 0.0001 (LC in North vs. MC in North). (O) Immunohistochemistry analysis of MMP13 level in human cartilage (n = 10). P < 0.0001 (LC in South vs. MC in South), P = 0.0349 (MC in South vs. MC in North), P < 0.0001 (LC in North vs. MC in North). (P) Immunohistochemistry analysis of APOE level in human cartilage (n = 10). P = 0.2498 (LC in South vs. MC in South), P < 0.0001 (LC in South vs. LC in North), P < 0.0001 (MC in South vs. MC in North), P = 0.0356 (LC in North vs. MC in North). Statistical analysis was performed using the Wald test within the DESeq2 framework (A), one-way ANOVA test (G, NP), Mann–Whitney test (M), and Student’s t test (H, L). Data are shown as mean ± SD (error bar) (*P < 0.05, **P < 0.01, ***P < 0.001). Source data are available online for this figure.
Figure 3
Figure 3. Apoe deficiency led to exacerbation of OA in vivo and in vitro.
(A) Scheme of generation of Apoe−/− mice and following establishment of OA mice model at room and low temperature. (B) Level of TG, TC, LDL and HDL in different type of mice exposed at room or low temperature (n = 5). P = 0.0090 (TG: WT RT vs. Apoe ko RT), P = 0.0270 (TC:WT RT vs. Apoe ko RT), P = 0.0002 (LDL: WT RT vs. Apoe ko RT). (C) Immunohistochemistry validation of conditional knock out of Apoe in mice cartilage. (D) Safranin O/Fast Green staining and OARSI score of the knee joints of Apoef/f and Apoe−/− mice at RT or LT (n = 5). P = 0.0238 (RTDMM Apoef/f vs. RTDMM Apoe−/−), P = 0.0238 (LTDMM Apoef/f vs. LTDMM Apoe−/−), P = 0.0079 (RTDMM Apoef/f vs. LTDMM Apoef/f), P = 0.0238 (RTDMM Apoe−/− vs. LTDMM Apoe−/−). (E) Immunohistochemistry staining and analysis of COLII level in mice cartilage (n = 5). P < 0.0001 (RTDMM Apoe f/f vs. RTDMM Apoe−/−), P < 0.0001 (LTDMM Apoef/f vs. LTDMM Apoe−/−), P < 0.0001 (RTDMM Apoef/f vs. LTDMM Apoef/f), P = 0.0005 (RTDMM Apoe−/− vs. LTDMM Apoe−/−). (F) Immunohistochemistry staining and analysis of MMP13 level in mice cartilage (n = 5). P = 0.0003 (RTDMM Apoef/f vs. RTDMM Apoe−/−), P = 0.0633 (LTDMM Apoef/f vs. LTDMM Apoe−/−), P < 0.0001 (RTDMM Apoef/f vs. LTDMM Apoef/f), P = 0.0096 (RTDMM Apoe−/− vs. LTDMM Apoe−/−). (G) Alcian blue staining and analysis of chondrocytes (n = 3). P = 0.0006 (37 °C + IL-1β Apoef/f vs. 37 °C + IL-1β Apoe−/−), P = 0.0415 (33 °C + IL-1β Apoef/f vs. 33 °C + IL-1β Apoe−/−), P = 0.0002 (37 °C + IL-1β Apoef/f vs. 33 °C + IL-1β Apoef/f), P = 0.0064 (37 °C + IL-Apoe−/− vs. 33 °C + IL-1β Apoe−/−). (H) CCK8 assay of the chondrocytes (n = 5). P = 0.0015 (37 °C + IL-1β Apoef/f vs. 37 °C + IL-1β Apoe−/−), P = 0.0392 (33 °C + IL-1β Apoef/f vs. 33 °C + IL-1β Apoe−/−), P = 0.0010 (37 °C + IL-1β Apoef/f vs. 33 °C + IL-1β Apoef/f), P = 0.0250 (37 °C + IL-Apoe−/− vs. 33 °C + IL-1β Apoe−/−). (I) Result of western blot of COLII and MMP13 of the chondrocytes. (J) Protein analysis of COLII and MMP13 (n = 3). P < 0.0001 (COLII: 37 °C + IL-1β Apoef/f vs. 37 °C + IL-1β Apoe−/−), P = 0.0009 (COLII: 33 °C + IL-1β Apoef/f vs. 33 °C + IL-1β Apoe−/−), P < 0.0001 (COLII: 37 °C + IL-1β Apoef/f vs. 33 °C + IL-1β Apoef/f), P = 0.0001 (COLII:37 °C + IL-1β Apoe−/− vs. 33 °C + IL-1β Apoe−/−), P < 0.0001 (MMP13: 37 °C + IL-1β Apoef/f vs. 37 °C + IL-1β Apoe−/−), P < 0.0001 (MMP13: 33 °C + IL-1β Apoef/f vs. 33 °C + IL-1β Apoe−/−), P < 0.0001 (MMP13: 37 °C + IL-1β Apoef/f vs. 33 °C + IL-1β Apoef/f), P < 0.0001 (MMP13:37 °C + IL-1β Apoe−/− vs. 33 °C + IL-1β Apoe−/−). Statistical analysis was performed using Kruskal–Wallis test (TG, TC, HDL in (B)), Mann–Whitney test (D), and one-way ANOVA test (LDL in (B, EG, H, J)). Data are shown as mean ± SD (error bar) (*P < 0.05, **P < 0.01, ***P < 0.001). Source data are available online for this figure.
Figure 4
Figure 4. Downregulation of Apoe in cold exposure induced lipid accumulation, generated ROS and increased apoptosis in chondrocytes.
(A) BODIPY staining of cartilage, proximal and distal tibial of different types of DMM mice housed at RT or LT. (B) μCT of subchondral cartilage in mice. (C) TRAP staining of subchondral cartilage in mice. (D) TUNEL staining of cartilage in mice. (E) Statistical analysis of BODIPY staining in mice (n = 5). P = 0.0216 (Cartilage: Sham vs. HFD), P < 0.0001 (Cartilage: RTDMM Apoef/f vs. RTDMM Apoe−/−), P = 0.0130 (Cartilage: LTDMM Apoef/f vs. LTDMM Apoe−/−), P < 0.0001 (Cartilage: RTDMM Apoef/f vs. LTDMM Apoef/f), P = 0.0005 (Cartilage: RTDMM Apoe−/− vs. LTDMM Apoe−/−), P = 0.0005 (Proximal tibial: RTDMM Apoef/f vs. LTDMM Apoef/f), P = 0.0005 (Proximal tibial: RTDMM Apoe−/− vs. LTDMM Apoe−/−). (F) BV/TV analysis of subchondral cartilage in mice (n = 5). P < 0.0001 (SHAM vs. RTDMM Apoef/f). (G) Analysis of TRAP level in subchondral cartilage of mice (n = 5). P = 0.0001 (SHAM vs. RTDMM Apoef/f). (H) Analysis of TUNEL expression in cartilage of mice (n = 5). P = 0.0023 (Sham vs. HFD), P = 0.0008 (SHAM vs. RTDMM Apoef/f), P = 0.0004 (RTDMM Apoef/f vs. RTDMM Apoe−/−), P = 0.1892(LTDMM Apoef/f vs. LTDMM Apoe−/−), P = 0.0021(RTDMM Apoef/f vs. LTDMM Apoef/f), P = 0.1364 (RTDMM Apoe−/− vs. LTDMM Apoe−/−). (I) BODIPY staining and analysis of chondrocytes (n = 3). P < 0.0001 (37 °C + IL-1β Apoef/f vs. 37 °C + IL-1β Apoe−/−), P = 0.0104 (33 °C + IL-1β Apoef/f vs. 33 °C + IL-1β Apoe−/−), P = 0.0001 (37 °C + IL-1β Apoef/f vs. 33 °C + IL-1β Apoef/f), P = 0.0239 (37 °C + IL-Apoe−/− vs. 33 °C + IL-1β Apoe−/−). (J) ROS detection and analysis of chondrocytes (n = 3). P < 0.0001 (37 °C + IL-1β Apoef/f vs. 37 °C + IL-1β Apoe−/−), P < 0.0001 (33 °C + IL-1β Apoef/f vs. 33 °C + IL-1β Apoe−/−), P < 0.0001 (37 °C + IL-1β Apoe f/f vs. 33 °C + IL-1β Apoef/f), P < 0.0001 (37 °C + IL-1β Apoe−/− vs. 33 °C + IL-1β Apoe−/−). (K) JC-1 staining and analysis of chondrocytes (n = 3). P < 0.0001 (37 °C + IL-1β Apoef/f vs. 37 °C + IL-1β Apoe−/−), P = 0.0067 (33 °C + IL-1β Apoef/f vs. 33 °C + IL-1β Apoe−/−), P < 0.0001 (37 °C + IL-1β Apoef/f vs. 33 °C + IL-1β Apoef/f), P = 0.0149 (37 °C + IL-1β Apoe−/− vs. 33 °C + IL-1β Apoe−/−). (L) TUNEL staining and analysis of chondrocytes (n = 3). P = 0.0015 (37 °C + IL-1β Apoef/f vs. 37 °C + IL-1β Apoe−/−), P = 0.0690 (33 °C + IL-1β Apoef/f vs. 33 °C + IL-1β Apoe−/−), P < =0.0002 (37 °C + IL-1β Apoef/f vs. 33 °C + IL-1β Apoef/f), P = 0.0036 (37 °C + IL-1β Apoe−/− vs. 33 °C + IL-1β Apoe−/−). (M) Gene Set Enrichment Analysis (GSEA) results comparing wild-type (WT) and Apoe knockout (Apoe KO) chondrocytes, focusing on reactive oxygen species (ROS)-related pathways. (N) Heatmap illustrating differentially expressed genes (DEGs) between wild-type (WT) and Apoe knockout (Apoe KO) chondrocytes. (O) Heatmap depicting differentially expressed genes associated with ROS generation. (P) Bar plot showing expression levels of key differentially upregulated genes associated with ROS production in chondrocytes. P = 0.0056 (Ncf1: WT vs. Apoe KO), P = 0.0045 (Ncf2: WT vs. Apoe KO), P = 0.0079 (Ncf4: WT vs. Apoe KO), P < 0.0001 (Cybb: WT vs. Apoe KO), P = 0.1429 (Nos2: WT vs. Apoe KO), P = 0.2104 (Nos3: WT vs. Apoe KO). Statistical analysis was performed using one-way ANOVA test (EG, IL), Welch’s ANOVA test (H). Data are shown as mean ± SD (error bar) (*P < 0.05, **P < 0.01, ***P < 0.001). Source data are available online for this figure.
Figure 5
Figure 5. The rescue study of the effect of RGX-104 on chondrocytes at low temperature.
(A) The western blot result of COLII, MMP13, APOE, LXRβ, NOX2 in Apoef/f chondrocytes. (B) The western blot result of COLII, MMP13, APOE, LXRβ, NOX2 in Apoe+/− chondrocytes. (C) The analysis of protein expression in Apoef/f chondrocytes (n = 3). P = 0.0003 (APOE: IL-1β vs. IL-β + 33 °C+Vehicle), P = 0.0005 (APOE: Vehicle vs. RGX-104), P < 0.0001 (COLII: IL-1β vs. IL-β + 33 °C+Vehicle), P < 0.0001 (COLII: Vehicle vs. RGX-104), P = 0.0004 (MMP13: IL-1β vs. IL-β + 33 °C+Vehicle), P = 0.0001 (MMP13: Vehicle vs. RGX-104), P = 0.7045 (LXRβ: IL-1β vs. IL-β + 33 °C+Vehicle), P < 0.0001 (LXRβ: Vehicle vs. RGX-104), P < 0.0001 (NOX2: IL-1β vs. IL-β + 33 °C+Vehicle), P < 0.0001 (NOX2: Vehicle vs. RGX-104). (D) The analysis of protein expression in Apoe+/− chondrocytes (n = 3). P < 0.0001 (APOE: IL-1β vs. IL-β + 33 °C+Vehicle), P < 0.0001 (APOE: Vehicle vs. RGX-104), P < 0.0001 (COLII: IL-1β vs. IL-β + 33 °C+Vehicle), P < 0.0001 (COLII: Vehicle vs. RGX-104), P = 0.0011 (MMP13: IL-1β vs. IL-β + 33 °C+Vehicle), P = 0.0014 (MMP13: Vehicle vs. RGX-104), P = 0.9075 (LXRβ: IL-1β vs. IL-β + 33 °C+Vehicle), P < 0.0001 (LXRβ: Vehicle vs. RGX-104), P < 0.0001 (NOX2: IL-1β vs. IL-β + 33 °C+Vehicle), P < 0.0001 (NOX2: Vehicle vs. RGX-104). (E) Alcian blue staining of chondrocytes. (F) BODIPY staining of chondrocytes. (G) Detection of ROS production in chondrocytes. (H) JC-1 staining of chondrocytes. (I) TUNEL staining of chondrocytes (n = 3). (J) Analysis of alcian blue staining (n = 3). P < 0.0001 (Apoef/f IL-1β vs. Apoef/f IL-1β + 33 °C+Vehicle), P < 0.0001 (Apoef/f Vehicle vs. Apoef/f RGX-104), P < 0.0001 (Apoe+/− IL-1β vs. Apoe+/− IL-1β + 33 °C+Vehicle), P < 0.0001 (Apoe+/− Vehicle vs. Apoe+/− RGX-104), P = 0.0210 (Apoef/f IL-1β vs. Apoe+/− IL-1β). (K) Analysis of BODIPY staining (n = 3). P = 0.0003 (Apoef/f IL-1β vs. Apoef/f IL-1β + 33 °C+Vehicle), P = 0.0037 (Apoef/f Vehicle vs. Apoef/f RGX-104), P = 0.0046 (Apoe+/− IL-1β vs. Apoe+/− IL-1β + 33 °C+Vehicle), P < 0.0001 (Apoe+/− Vehicle vs. Apoe+/− RGX-104), P < 0.0001 (Apoef/f IL-1β vs. Apoe+/− IL-1β), P = 0.0003 (Apoef/f Vehicle vs. Apoe+/− Vehicle). (L) Analysis of ROS in chondrocytes (n = 3). P < 0.0001 (Apoef/f IL-1β vs. Apoef/f IL-1β + 33 °C+Vehicle), P < 0.0001 (Apoef/f Vehicle vs. Apoef/f RGX-104), P < 0.0001 (Apoe+/− IL-1β vs. Apoe+/− IL-1β + 33 °C+Vehicle), P < 0.0001 (Apoe+/− Vehicle vs. Apoe+/− RGX-104), P = 0.0014 (Apoef/f IL-1β vs. Apoe+/− IL-1β). (M) Analysis of JC-1 staining (n = 3). P < 0.0001 (Apoef/f IL-1β vs. Apoef/f IL-1β + 33 °C+Vehicle), P < 0.0001 (Apoef/f Vehicle vs. Apoef/f RGX-104), P = 0.0002 (Apoe+/− IL-1β vs. Apoe+/− IL-1β + 33 °C+Vehicle), P < 0.0001 (Apoe+/− Vehicle vs. Apoe+/− RGX-104), P < 0.0001 (Apoef/f IL-1β vs. Apoe+/− IL-1β), P < 0.0001 (Apoef/f Vehicle vs. Apoe+/− Vehicle). (N) Analysis of TUNEL staining (n = 3). P = 0.0005 (Apoef/f IL-1β vs. Apoef/f IL-1β + 33 °C+Vehicle), P = 0.0053 (Apoef/f Vehicle vs. Apoef/f RGX-104), P = 0.0066 (Apoe+/− IL-1βvs. Apoe+/− IL-1β + 33 °C+Vehicle), P < 0.0001 (Apoe+/− Vehicle vs. Apoe+/− RGX-104), P < 0.0001 (Apoef/f IL-1β vs. Apoe+/− IL-1β), P = 0.0004 (Apoef/f Vehicle vs. Apoe+/− Vehicle). Statistical analysis was performed using one-way ANOVA test (C, D, JN). Data are shown as mean ± SD (error bar) (*P < 0.05, **P < 0.01,***P < 0.001). Source data are available online for this figure.
Figure 6
Figure 6. The rescue study of the effect of RGX-104 injection on DMM Apoe+/− mice.
(A) Scheme of generation of Apoe+/− mice and experimental design of RGX-104 articular injection to OA mice models at low temperature. (B) Validation of APOE expression in cartilage of Apoe+/− mice by IHC (n = 5). P = 0.0004. (C) LXRβ staining in cartilage and statistical analysis (n = 5). P = 0.9997 (Apoef/f RT vs. Apoef/f LT+Vehicle), P < 0.0001 (Apoef/f Vehicle vs. Apoef/f RGX-104), P = 0.9965 (Apoe+/− RT vs. Apoe+/− LT+Vehicle), P < 0.0001 (Apoe+/− Vehicle vs. Apoe+/− RGX-104). (D) Immunohistochemistry staining of APOE in cartilage and statistical analysis (n = 5). P = 0.0040 (Apoef/f RT vs. Apoef/f LT+Vehicle), P < 0.0001 (Apoef/f Vehicle vs. Apoef/f RGX-104), P = 0.0076 (Apoe+/− RT vs. Apoe+/− LT+Vehicle), P < 0.0001 (Apoe+/− Vehicle vs. Apoe+/− RGX-104), P = 0.0179 (Apoef/f RT vs. Apoe+/− RT), P = 0.0324 (Apoef/f Vehicle vs. Apoe+/− Vehicle). (E) Safranin O/Fast Green staining of the mice knee joints and OARSI score (n = 5). P = 0.0079 (Apoef/f RT vs. Apoef/f LT+Vehicle), P = 0.0079 (Apoef/f Vehicle vs. Apoef/f RGX-104), P = 0.0476 (Apoe+/− RT vs. Apoe+/− LT+Vehicle), P = 0.0079 (Apoe+/− Vehicle vs. Apoe+/− RGX-104), P = 0.0317 (Apoef/f RT vs. Apoe+/− RT). (F) Immunohistochemistry staining of COLII in cartilage and statistical analysis (n = 5). P < 0.0001 (Apoef/f RT vs. Apoef/f LT+Vehicle), P < 0.0001 (Apoef/f Vehicle vs. Apoef/f RGX-104), P < 0.0001 (Apoe+/− RT vs. Apoe+/− LT+Vehicle), P < 0.0001 (Apoe+/− Vehicle vs. Apoe+/− RGX-104), P < 0.0001 (Apoef/f RT vs. Apoe+/− RT), P = 0.0017 (Apoef/f Vehicle vs. Apoe+/− Vehicle). (G) Immunohistochemistry staining of MMP13 in cartilage and statistical analysis (n = 5). P < 0.0001 (Apoef/f RT vs. Apoef/f LT+Vehicle), P < 0.0001 (Apoef/f Vehicle vs. Apoef/f RGX-104), P < 0.0001 (Apoe+/− RT vs. Apoe+/− LT+Vehicle), P < 0.0001 (Apoe+/− Vehicle vs. Apoe+/− RGX-104), P = <0.0001 (Apoef/f RT vs. Apoe+/− RT), P = 0.0011(Apoef/f Vehicle vs. Apoe+/− Vehicle). (H) Immunohistochemistry staining of NOX2 in cartilage and statistical analysis (n = 5). P < 0.0001 (Apoef/f RT vs. Apoef/f LT+Vehicle), P < 0.0001 (Apoef/f Vehicle vs. Apoef/f RGX-104), P < 0.0001 (Apoe+/− RT vs. Apoe+/− LT+Vehicle), P < 0.0001 (Apoe+/− Vehicle vs. Apoe+/− RGX-104), P = 0.0014 (Apoef/f RT vs. Apoe+/− RT), P = 0.0105 (Apoef/f Vehicle vs. Apoe+/− Vehicle). (I) BODIPY staining in cartilage and statistical analysis (n = 5). P < 0.0001 (Apoef/f RT vs. Apoef/f LT+Vehicle), P < 0.0001 (Apoef/f Vehicle vs. Apoef/f RGX-104), P < 0.0001 (Apoe+/− RT vs. Apoe+/− LT+Vehicle), P < 0.0001 (Apoe+/− Vehicle vs. Apoe+/− RGX-104), P = 0.0263 (Apoef/f RT vs. Apoe+/− RT), P < 0.0001 (Apoef/f Vehicle vs. Apoe+/− Vehicle). (J) TUNEL staining in cartilage and statistical analysis (n = 5). P < 0.0001 (Apoef/f RT vs. Apoef/f LT+Vehicle), P = 0.0083 (Apoef/f Vehicle vs. Apoef/f RGX-104), P < 0.0001 (Apoe+/− RT vs. Apoe+/− LT+Vehicle), P = 0.0021 (Apoe+/− Vehicle vs. Apoe+/− RGX-104). Statistical analysis was performed using Student’s t test (B), Mann–Whitney test (E), and one-way ANOVA test (C, D, FJ). Data are shown as mean ±  SD (error bar) (*P < 0.05, **P < 0.01,***P < 0.001). Source data are available online for this figure.
Figure EV1
Figure EV1. Bioinformatics analysis of RNA sequencing of chondrocytes cultured at different temperatures.
(A) Principal Component Analysis (PCA) of the gene expression. (B) GO analysis of the DEGs. (C) Volcano plot of gene expressions between 33 °C control group and 37 °C control group (n = 3 patients per group). (D) Heatmap of DEGs between 33 °C control group and 37 °C control group. Statistical analysis was performed using the hypergeometric test (B) and the Wald test within the DESeq2 framework (C).
Figure EV2
Figure EV2. Result of the genotyping of Apoe−/−AcanCre-ERT2 mice.
(A) Genotyping strategy for Apoef/f. (B) Genotyping strategy for AcanCre-ERT2. (C) Genotyping result for Apoef/f. (D) Genotyping result for AcanCre-ERT2.
Figure EV3
Figure EV3. Analysis of catwalk gait parameters and immunohistochemical staining for pain-related markers in dorsal root ganglia of Apoef/f and Apoe−/− mice.
(A) Immunofluorescence staining and quantitative analysis of ACAN and APOE co-expression in dorsal root ganglia (n = 5). P < 0.0001. (B) Catwalk gait analysis of Apoe f/f and Apoe−/− mice and typical result of foot heatmap, paw intensity and contact area. (C) Quantitative analysis of mean intensity ratio of right hind (RH) / left hind (LH) limb (n = 5). P = 0.0065 (Apoe f/f SHAM vs. Apoe f/f DMM), P = 0.0224 (Apoe −/− SHAM vs. Apoe −/− DMM), P = 0.9032 (Apoe f/f SHAM vs. Apoe −/−SHAM), P = 0.9999 (Apoe f/f DMM vs. Apoe−/− DMM). (D) Quantitative analysis of ratio of contact area of RH/LH (n = 5). P = 0.0002 (Apoef/f SHAM vs. Apoef/f DMM), P = 0.0009 (Apoe−/− SHAM vs. Apoe−/− DMM), P = 0.7479 (Apoe f/f SHAM vs. Apoe−/− SHAM), P = 0.9954 (Apoe f/f DMM vs. Apoe−/− DMM). (E) Quantitative analysis of Nav1.7/ACAN level in DRG (n = 5). P < 0.0001 (Apoe f/f SHAM vs. Apoe f/f DMM), P < 0.0001 (Apoe−/− SHAM vs. Apoe−/− DMM), P = 0.9863 (Apoef/f SHAM vs. Apoe −/− SHAM), P = 0.9922 (Apoef/f DMM vs. Apoe−/− DMM). (F) Quantitative analysis of TAC1/ACAN level in DRG (n = 5). P < 0.0001 (Apoef/f SHAM vs. Apoef/f DMM), P < 0.0001 (Apoe−/− SHAM vs. Apoe−/− DMM), P = 0.9805 (Apoef/f SHAM vs. Apoe−/− SHAM), P = 0.9999 (Apoef/f DMM vs. Apoe−/− DMM). (G) Immunofluorescence co-staining of Nav1.7 (voltage-gated sodium channel) and TAC1 (Substance P precursor) with ACAN (Aggrecan) in dorsal root ganglia (DRG) of Apoef/f and Apoe−/− mice. Statistical analysis was performed using Whelch’s t test (A), one-way ANOVA test (CF). Data are shown as mean ±  SD (error bar) (*P < 0.05, **P < 0.01,***P < 0.001). Source data are available online for this figure.
Figure EV4
Figure EV4. Open filed test of Apoef/f and Apoe−/− mice at room and low temperature.
(A) Images of the mouse movement pathways. (B) Average time of rearing movements (n = 5). (C) Number of rearing movement (n = 5). (D) Rest time (n = 5). (E) Speed (n = 5). (F) Total distance traveled (n = 5). P = 0.1339 (Apoe f/f RT vs. Apoe f/f LT), P = 0.0449 (Apoe−/− RT vs. Apoe−/− LT). Statistical analysis was performed using one-way ANOVA test (B, D–F), Kruskal–Wallis test (C). Data are shown as mean ±   SD (error bar) (*P < 0.05). Source data are available online for this figure.

References

    1. Archer AM, Saber R, Rose S, Shaffer A, Misharin AV, Tsai F, Haines Iii GK, Dominguez S, Eren M, Vaughan DE et al (2016) ApoE deficiency exacerbates the development and sustainment of a semi-chronic K/BxN serum transfer-induced arthritis model. J Transl Med 14:170 - PMC - PubMed
    1. Bensinger SJ, Bradley MN, Joseph SB, Zelcer N, Janssen EM, Hausner MA, Shih R, Parks JS, Edwards PA, Jamieson BD et al (2008) LXR signaling couples sterol metabolism to proliferation in the acquired immune response. Cell 134:97–111 - PMC - PubMed
    1. Bonner JrWM, Jonsson JrH, Malanos C, Bryant M (1975) Changes in the lipids of human articular cartilage with age. Arthritis Rheumatism 18:461–473 - PubMed
    1. Choi W-S, Lee G, Song W-H, Koh J-T, Yang J, Kwak J-S, Kim H-E, Kim SK, Son Y-O, Nam H et al (2019) The CH25H–CYP7B1–RORα axis of cholesterol metabolism regulates osteoarthritis. Nature 566:254–258 - PubMed
    1. Collins DH, Ghadially FN, Meachim G (1965) Intra-cellular lipids of cartilage. Ann Rheum Dis 24:123 - PMC - PubMed

Substances