. 2025 Aug;31(8):2590-2601.
doi: 10.1038/s41591-025-03835-z. Epub 2025 Jul 15.

APOE ε4 carriers share immune-related proteomic changes across neurodegenerative diseases

Affiliations

APOE ε4 carriers share immune-related proteomic changes across neurodegenerative diseases

Artur Shvetcov et al. Nat Med. 2025 Aug.

Abstract

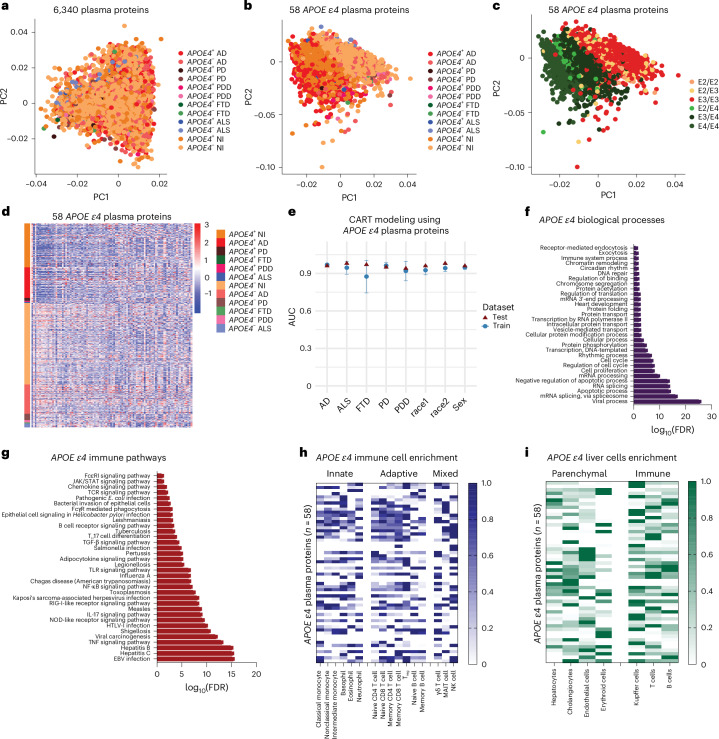
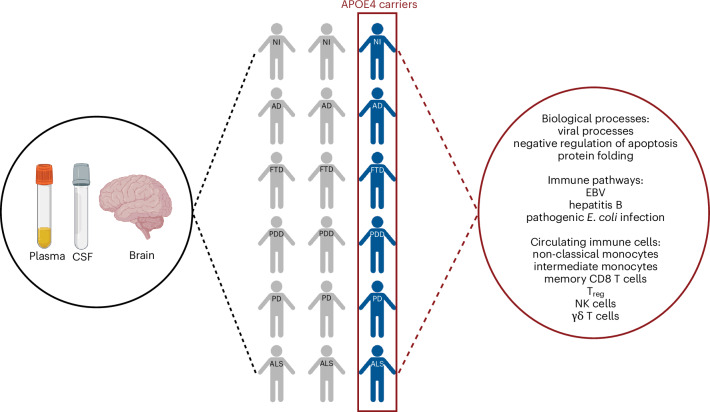
The APOE ε4 genetic variant is the strongest genetic risk factor for late-onset Alzheimer's disease (AD) and is increasingly being implicated in other neurodegenerative diseases. Using the Global Neurodegeneration Proteomics Consortium SomaScan dataset covering 1,346 cerebrospinal fluid (CSF) and 9,924 plasma samples, we used machine learning-based proteome profiling to identify an APOE ε4 proteomic signature shared across individuals with AD, frontotemporal dementia (FTD), Parkinson's disease dementia (PDD), Parkinson's disease (PD), amyotrophic lateral sclerosis (ALS) and nonimpaired controls. This signature was enriched in pro-inflammatory immune and infection pathways as well as immune cells, including monocytes, T cells and natural killer cells. Analysis of the dorsolateral prefrontal cortex proteome for 262 donors from the Accelerating Medicines Partnership for AD UPenn Proteomics Study revealed a consistent APOE ε4 phenotype, independent of neurodegenerative pathology, including amyloid-β tau and gliosis for all diseases, as well as TDP-43 in ALS and FTD cases, and α-synuclein in PD and PDD cases. While systemic proteomic changes were consistent across APOE ε4 carriers, their relationship with clinical and lifestyle factors, such as hypertension and smoking, varied by disease. These findings suggest APOE ε4 confers a systemic biological vulnerability that is necessary but not sufficient for neurodegeneration, emphasizing the need to consider gene-environment interactions. Overall, our study reveals a conserved APOE ε4-associated pro-inflammatory immune signature persistent across the brain, CSF and plasma irrespective of neurodegenerative disease, highlighting a fundamental, disease-independent biological vulnerability to neurodegeneration. This work reframes APOE ε4 as a pleiotropic immune modulator rather than an AD-specific risk gene, providing a foundation for precision biomarker development and early intervention strategies across neurodegenerative diseases.


Conflict of interest statement

Competing interests: The authors declare no competing interests.

Figures

Fig. 1
Fig. 1. Study design and characterization of the CSF proteome signature in APOE ε4 carriers.
a, Study design using the GNPC and AMP-AD UPenn Proteomics Study cohorts for identifying and characterizing systemic proteome changes in APOE ε4 carriers. Panel a is created with BioRender.com. b, PCA of all 6,340 measured CSF proteins showing no clear clustering. c, PCA of 229 APOE ε4 CSF proteins identified using mutual information that shows clustering based on the presence or absence of APOE ε4 allele rather than specific neurodegenerative disease. d, PCA of 229 APOE ε4 CSF proteins showing that clustering is based on the specific APOE genotype and number of APOE ε4 alleles (Supplementary Table 1 lists the distribution of APOE ε4 cases). e, Heatmap visualizing the upregulation (red) and downregulation (blue) of proteins within the APOE ε4 CSF proteome signature of 229 proteins, which shows distinctions based on the presence or absence of an APOE ε4 allele rather than disease. f, Supervised machine learning modeling using CART showing mean AUC ± s.d. across fivefold repeated five times. Models were trained and validated on a 70% training dataset and tested using a 30% withheld testing dataset. g, Functional enrichment analysis of PANTHER biological processes enriched for APOE ε44 CSF proteins showing the most significant (FDR = 9.34 × 10−13) enrichment for viral processes. h, Given the most significant enriched biological process was viral processes, we performed a functional enrichment analysis of KEGG immune-related pathways enriched for APOE ε4 CSF proteins, showing significant (FDR < 0.05) enrichment for immune, infection and pro-inflammatory pathways. i, Immune cell-type-specific enrichment analysis of APOE ε4 CSF proteins showing involvement across the innate, adaptive and innate-like T cells and lymphoid cells (mixed). j, Liver cell-type-specific enrichment analysis of APOE ε4 CSF proteins showing involvement across parenchymal and immune cells. Cell-type-specific enrichments are based on single-cell RNA-sequencing data from the Human Protein Atlas. Plot shows min–max scaling of protein-coding transcripts per million for each identified protein in the APOE ε4 CSF signature. AUC, area under the curve; NI, nonimpaired controls; FcγR, Fc gamma R; FcεRI, Fc epsilon RI; NOD, nucleotide oligomerization domain; RIG, retinoic acid-inducible gene; HTLV-1, human T cell leukemia virus type 1.
Fig. 2
Fig. 2. Identification and characterization of the plasma proteome signature in APOE ε4 carriers.
a, PCA of all 6,340 measured plasma proteins showing no clear clustering. b, PCA of 58 APOE ε4 plasma proteins identified using mutual information that shows clustering based on the presence or absence of APOE ε4 allele rather than specific neurodegenerative disease. c, PCA of 58 APOE ε4 plasma proteins showing that clustering is based on the specific APOE genotype and number of APOE ε4 alleles (Supplementary Table 1 lists the distribution of APOE ε4 cases). d, Heatmap visualizing the upregulation (red) and downregulation (blue) of proteins within the APOE ε4 plasma proteome signature of 58 proteins that shows distinctions based on the presence or absence of an APOE ε4 allele rather than disease. e, Supervised machine learning modeling using CART showing mean AUC ± s.d. across fivefold repeated five times. Models were trained and validated on a 70% training dataset and tested using a 30% withheld testing dataset. ‘race1’ refers to American Indian/Alaskan Native individuals and ‘race2’ refers to Black/African American individuals. f, Functional enrichment analysis of PANTHER biological processes enriched for APOE ε4 plasma proteins showing the most significant (FDR = 1.31 × 1026) enrichment for viral processes. g, Given the most significant enriched biological process was viral processes, we performed a functional enrichment analysis of KEGG immune-related pathways enriched for APOE ε4 plasma proteins. This showed significant (FDR < 0.05) enrichment for immune, infection and pro-inflammatory pathways. h, Immune cell-type-specific enrichment analysis of APOE ε4 plasma proteins showing involvement across the innate, adaptive and innate-like T cells and lymphoid cells (mixed). i, Liver cell-type-specific enrichment analysis of APOE ε4 CSF proteins showing involvement across parenchymal and immune cells. Cell-type-specific enrichments are based on single-cell RNA-sequencing data from the Human Protein Atlas. Plot shows min–max scaling of protein-coding transcripts per million for each identified protein in the APOE ε4 plasma signature.
Fig. 3
Fig. 3. Key overlapping enrichments across the CSF, plasma, and brains of APOE ε4 carriers across neurodegenerative diseases.
a, Bar plot comparing functional enrichment analysis of overlapping significant (FDR < 0.05) PANTHER biological processes enriched for APOE ε4 proteins in the CSF, plasma and brain (dlPFC). b, Heatmap comparing functional enrichment analysis of overlapping significant (FDR < 0.05) PANTHER biological processes enriched for APOE ε4 proteins in the CSF, plasma and brain (dlPFC). c, Comparative functional enrichment analysis of significant (FDR < 0.05) KEGG immune-related pathways enriched for APOE ε4 proteins in the CSF, plasma and brain (dlPFC). d, Comparative functional enrichment analysis of overlapping significant (FDR < 0.05) KEGG immune-related pathways enriched for APOE ε4 proteins in the CSF, plasma and brain (dlPFC).
Fig. 4
Fig. 4. Correlation analyses between APOE ε4 CSF and plasma central node proteins and demographic, lifestyle, and clinical variables.
a, Venn diagram showing the overlapping APOE ε4 proteins identified in the CSF and plasma. Of the 40 overlapping proteins, the 16 named proteins represent central protein nodes in the protein–protein interaction network, with more than 20 functional connections. Panel a is created with BioRender.com. b, Hierarchical tree showing the unique, neurodegenerative disease-specific relationships between APOE and demographic and clinical variables. c, Categorical heatmap showing the unique, neurodegenerative-disease-specific relationships between the remaining 15 central node APOE ε4 proteins and demographic, lifestyle and clinical (cardiovascular, neurological/psychological, metabolic and other) variables.
Fig. 5
Fig. 5. Summary of the study’s findings.
APOE ε4 carriers across different neurodegenerative diseases share a common systemic proteomic change reflective of pro-inflammatory immune dysregulation. The figure is created with BioRender.com.
Extended Data Fig. 1
Extended Data Fig. 1. Further characterization of the APOE ε4 CSF protein signature.
(a) Volcano plots showing fold change and adjusted p values for the APOE ε4 CSF proteins. Red dots indicate the proteins with the highest mutual information value (>0.1) for reference to the feature selection method used to identify APOE ε4 proteins. Differential protein abundance was assessed using linear modeling and empirical Bayes moderation. All tests were two-sided, and p-values were corrected for multiple comparisons using the Benjamini-Hochberg FDR method. Volcano plots display log2 fold change on the x-axis and -log₁₀-transformed adjusted p-values on the y-axis, with thresholds set at log2(FC) = ± 0.585 and FDR-adjusted p < 0.05. (b) Box plots showing amyloid beta A4 protein CSF levels in relative fluorescent units (RFU) across APOE ε4 carriers and non-carriers with AD, PD, and non-impaired controls. The center line represents the median, the bounds of the box indicate the 25th and 75th percentiles (interquartile range; IQR), and the whiskers extend to the minimum and maximum values within 1.5× IQR. Data points outside this range are plotted individually as outliers. N = 526 AD, 247 PD, and 573 non-impaired control individuals. Abbreviations: AD: Alzheimer’s disease; NI: non-impaired controls; PD: Parkinson’s disease.
Extended Data Fig. 2
Extended Data Fig. 2. Further characterization of the APOE ε4 plasma protein signature.
(a) Volcano plots showing fold change and adjusted p values for the APOE ε4 plasma proteins. Red dots indicate the proteins with the highest mutual information value (>0.1) for reference to the feature selection method used to identify APOE ε4 proteins. Differential protein abundance was assessed using linear modeling and empirical Bayes moderation. All tests were two-sided, and p-values were corrected for multiple comparisons using the Benjamini-Hochberg FDR method. Volcano plots display log2 fold change on the x-axis and −log10-transformed adjusted p-values on the y-axis, with thresholds set at log₂(FC) = ± 0.585 and FDR-adjusted p < 0.05. (b) Box plots showing amyloid beta A4 protein plasma levels in relative fluorescent units (RFU) across APOE ε4 carriers and non-carriers with AD, ALS, FTD, PDD, PD, and non-impaired controls. The center line represents the median, the bounds of the box indicate the 25th and 75th percentiles (interquartile range; IQR), and the whiskers extend to the minimum and maximum values within 1.5x IQR. Data points outside this range are plotted individually as outliers. N = 2,929 AD, 75 FTD, 169 PDD, 422 PD, 230 ALS, and 6,099 non-impaired control individuals. Abbreviations: AD: Alzheimer’s disease; ALS: amyotrophic lateral sclerosis; FTD: frontotemporal dementia; NI: non-impaired controls; PD: Parkinson’s disease; PDD: Parkinson’s disease dementia.
Extended Data Fig. 3
Extended Data Fig. 3. Stratification of comorbidities across APOE ε4 carriers and non-carriers.
Bar graph representation of the proportion of APOE ε4 and non-carriers with comorbidity across the clinical variables included in our correlation network analysis between APOE ε4 proteins and demographic, lifestyle, and clinical variables. Only those individuals who said ‘yes’ to having comorbidity are included in the graph (Supplementary Table 1). APOE4+: APOE ε4 carrier; APOE4−: APOE ε4 non-carrier; afib: atrial fibrillation; chf: congestive heart failure; copd: chronic obstructive pulmonary disease; tbi: traumatic brain injury; tia: transient ischemic attack; mi: myocardial infarction.
Extended Data Fig. 4
Extended Data Fig. 4. Identification of APOE ε4 proteins in the dorsolateral prefrontal cortex of individuals with neurodegenerative diseases and non-impaired controls.
APOE ε4 proteins identified using label-free MS from the AMP-AD UPenn Proteomics Study cohort and mutual information. (a,c,e,g,i,k) PCA showing all label-free MS measured proteins in each donor group and no clear clustering across APOE ε4 carriers and non-carriers. (b,d,f,h,j,l) PCA showing only APOE ε4-identified proteins in each donor group, which leads to clustering in each group based on the presence or absence of an APOE ε4 allele. AD: Alzheimer’s disease; ALS: amyotrophic lateral sclerosis; FTD: frontotemporal dementia; PD: Parkinson’s disease; PDD: Parkinson’s disease dementia.

References

    1. Belloy, M. E., Napolioni, V. & Greicius, M. D. A quarter century of APOE and Alzheimer’s disease: progress to date and the path forward. Neuron101, 820–838 (2019). - PMC - PubMed
    1. Fabre, S. F. et al. Clinic-based cases with frontotemporal dementia show increased cerebrospinal fluid tau and high apolipoprotein E ε4 frequency, but no tau gene mutations. Exp. Neurol.168, 413–418 (2001). - PubMed
    1. Bernardi, L. et al. The effects of APOE and tau gene variability on risk of frontotemporal dementia. Neurobiol. Aging27, 702–709 (2006). - PubMed
    1. Rubino, E. et al. Apolipoprotein E polymorphisms in frontotemporal lobar degeneration: a meta-analysis. Alzheimer’s Dement.9, 706–713 (2013). - PubMed
    1. Ferrari, R. et al. Genetic architecture of sporadic frontotemporal dementia and overlap with Alzheimer’s and Parkinson’s diseases. J. Neurol. Neurosurg. Psychiatry88, 152–164 (2017). - PMC - PubMed

MeSH terms

Grants and funding