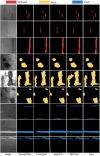
Hyperbolic geometry enhanced feature filtering network for industrial anomaly detection
- PMID: 40665106
- PMCID: PMC12264096
- DOI: 10.1038/s41598-025-07550-0
Hyperbolic geometry enhanced feature filtering network for industrial anomaly detection
Abstract
In recent years, Cutting-edge machine learning algorithms and systems in Industry 4.0 enhance quality control and increase production efficiency. The visual perception algorithms have become extensively utilized in surface defect detection, progressively replacing manual inspection methods. As a crucial component of the Industrial Internet of Things (IIoT), this technology is pivotal for ensuring industrial production quality and has garnered significant attention from the military and aerospace sectors. Nonetheless, most existing methods rely on Euclidean space, which constrains their effectiveness in handling non-Euclidean space data. Additionally, challenges such as addressing pre-trained feature redundancy and bias in the pre-training process persist. This paper presents HADNet, a hyperbolic space-based anomaly detection method. Specifically, we begin by mapping the extracted features to hyperbolic space, a non-Euclidean geometric space. This mapping leverages the unique geometric properties of hyperbolic space, particularly the hyperbolic distance metric, to represent the distances between features more effectively. Next, the most relevant features for anomaly detection are selected through the anomaly-aware feature subset selection module, enhancing anomaly detection performance. Finally, we introduce adaptive residuals discrimination, an adaptive analysis technique that discards residuals lacking anomaly information, thereby isolating the most effective regions for anomaly detection. Extensive experiments on four benchmark datasets NEU-Seg, MT-Defect, FSSD-12, and UCF-EL demonstrate the efficacy of HADNet, achieving mIoU scores of 87%, 81.46%, 77.04%, and 59.41% respectively, significantly surpassing the current state-of-the-art methods.
Keywords: Anomaly detection; Deep learning; Hyperbolic space.
© 2025. The Author(s).
Conflict of interest statement
Declarations. Competing interests: The authors declare no competing interests.
Figures


Similar articles
-
Short-Term Memory Impairment.2024 Jun 8. In: StatPearls [Internet]. Treasure Island (FL): StatPearls Publishing; 2025 Jan–. 2024 Jun 8. In: StatPearls [Internet]. Treasure Island (FL): StatPearls Publishing; 2025 Jan–. PMID: 31424720 Free Books & Documents.
-
A novel ensemble Wasserstein GAN framework for effective anomaly detection in industrial internet of things environments.Sci Rep. 2025 Jul 23;15(1):26786. doi: 10.1038/s41598-025-07533-1. Sci Rep. 2025. PMID: 40701989 Free PMC article.
-
A systematic survey: role of deep learning-based image anomaly detection in industrial inspection contexts.Front Robot AI. 2025 Jun 23;12:1554196. doi: 10.3389/frobt.2025.1554196. eCollection 2025. Front Robot AI. 2025. PMID: 40626146 Free PMC article. Review.
-
Signs and symptoms to determine if a patient presenting in primary care or hospital outpatient settings has COVID-19.Cochrane Database Syst Rev. 2022 May 20;5(5):CD013665. doi: 10.1002/14651858.CD013665.pub3. Cochrane Database Syst Rev. 2022. PMID: 35593186 Free PMC article.
-
Systemic pharmacological treatments for chronic plaque psoriasis: a network meta-analysis.Cochrane Database Syst Rev. 2021 Apr 19;4(4):CD011535. doi: 10.1002/14651858.CD011535.pub4. Cochrane Database Syst Rev. 2021. Update in: Cochrane Database Syst Rev. 2022 May 23;5:CD011535. doi: 10.1002/14651858.CD011535.pub5. PMID: 33871055 Free PMC article. Updated.
References
-
- Sanaei, N. & Fatemi, A. Defects in additive manufactured metals and their effect on fatigue performance: A state-of-the-art review. Prog. Mater Sci.117, 100724 (2021).
-
- Abdulrahman, Y., Eltoum, M. M., Ayyad, A., Moyo, B. & Zweiri, Y. Aero-engine blade defect detection: A systematic review of deep learning models. IEEE Access11, 53048–53061 (2023).
-
- Luo, Q., Fang, X., Liu, L., Yang, C. & Sun, Y. Automated visual defect detection for flat steel surface: A survey. IEEE Trans. Instrum. Meas.69, 626–644 (2020).
LinkOut - more resources
Full Text Sources
Research Materials
Miscellaneous

