. 2025 Jul 15;25(1):914.
doi: 10.1186/s12870-025-06834-x.

Biochar and manure co-application improves soil health and rice productivity through microbial modulation

Affiliations

Biochar and manure co-application improves soil health and rice productivity through microbial modulation

Niyaz Ali et al. BMC Plant Biol. .

Abstract

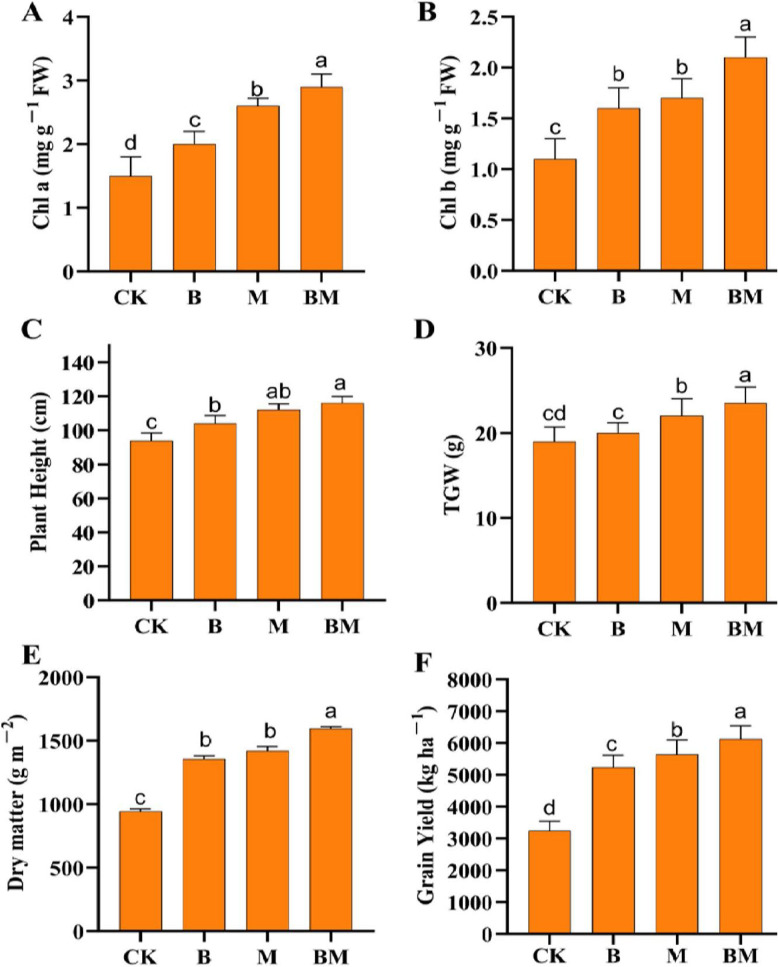
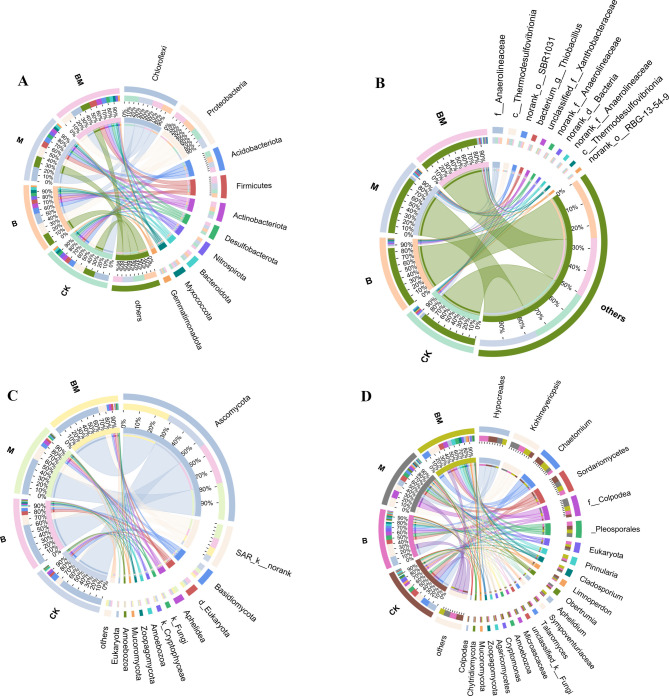
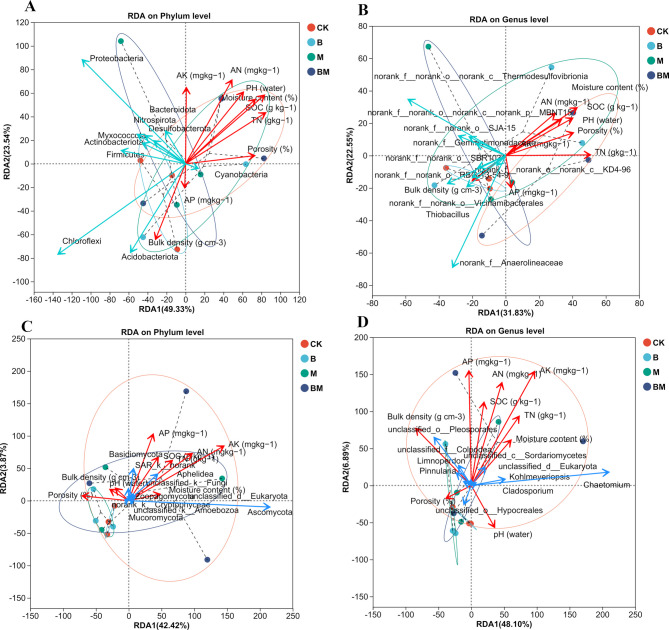
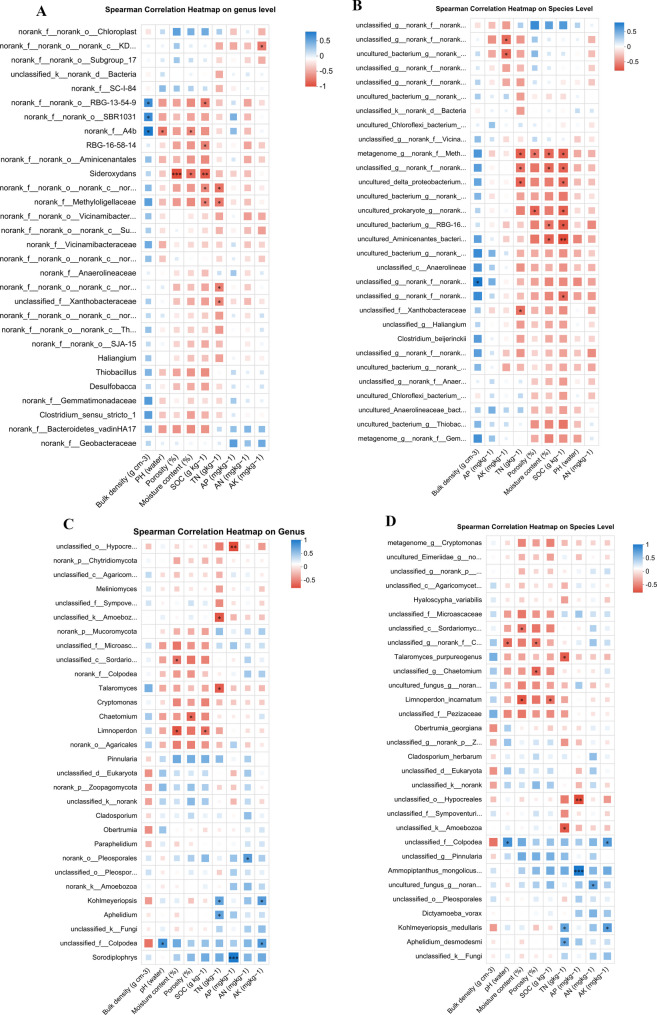
Individual applications of biochar (B) or organic manure (M) have been reported to improve soil fertility and plant performance. Their synergistic effects on paddy soil physicochemical properties, microbial communities, and rice productivity remain under explored. This study investigated the effects of B (20 t ha− 1), M (15 t ha− 1), and their combined application (BM, 10 + 7.5 t ha− 1) on soil physicochemical properties, microbial communities, rice plant growth and yield. Our findings revealed that B, M, and BM significantly improved soil physicochemical properties compared to control (CK). BM enhanced total nitrogen and available phosphorus by 34% and 26%, respectively, compared to CK. Soil pH, soil organic carbon, available nitrogen, and available potassium showed higher values in all treatments compared to the CK, with no significant differences among B, M, or their combined applications. Chlorophyll a, b, plant growth, dry matter and yield attributes showed the trend of BM > M > B > CK. These changes were attributed to the enhancement of beneficial soil bacteria, including Proteobacteria, Firmicutes, Actinobacteria and Bacteroidota in the BM treatment. Individual biochar treatment reduced Chloroflexi and Firmicutes but increased Proteobacteria and Actinobacteria. In contrast, individual manure application enhanced Firmicutes and Nitrospirota. Among fungal communities, Chaetomium and Pinnularia showed higher relative abundances in the combined treatment, playing roles in organic matter decomposition and plant growth, respectively. We conclude that the integrated use of biochar and manure enhances rice performance primarily by fostering a soil microbiome conducive to nutrient cycling and plant growth. Combined B + M application is therefore recommended as a sustainable strategy for improving paddy soil quality and crop yield.

Supplementary Information: The online version contains supplementary material available at 10.1186/s12870-025-06834-x.

Keywords: Biochar; Manure; Paddy field; Soil microbes; Soil physicochemical properties.


Conflict of interest statement

Declarations. Ethics approval and consent to participate: Not applicable. Consent for publication: All authors read and approved the publishing of this article. Competing interests: The authors declare no competing interests.

Figures

Fig. 1
Fig. 1
Changes in A chlorophyll a, B chlorophyll b, C plant height, D thousand grains weight (TGW), E dry matter, and F grain yield of rice under Biochar, organic manure and it combined applications. Values followed by the same letters, above the column, are not significantly different at p ≤ 0.05
Fig. 2
Fig. 2
Venn diagram, interpret the shared and unique OTUs among the treatment. A unique and shared OTUs of bacteria among the different treatments. Control (C), biochar (B), manure (M) and combination of biochar and manure (BM). B Venn diagram for unique and shared number of OTUs of Fungal community among the different treatments, control (C), biochar (B), manure (M) and combination of biochar and manure (BM)
Fig. 3
Fig. 3
Impact of the treatments on the percentage community abundance level of bacteria at the Phylum level (A), at genus level (B). Fungal community abundance level at phylum level figure (C) and at genus level (D). Note: Columns of different colors represent different species, and the length of the column represents the proportion of the species. The right side of the figure is the various species represented by the various color gradients
Fig. 4
Fig. 4
Species relationship diagram between the samples. Bacterial and fungal community composition. Figure A represents the bacterial community, while the figure B represents the fungal community. The small semicircle (left half circle) indicates the composition of the species in the sample, and the color of the outer ribbon of the circle indicates to which group it belongs, while the inner ribbon color represents the species and the length indicates its relative abundance. The semicircle on the right half of the diagram represents the distribution of phyla. The outer ribbon in the circle indicates the species and the inner ribbon indicates different groups and the length of different colors indicates the ratio of distribution. A, abundance and species ratio of the bacterial community. B, abundance and species ratio of the fungal community
Fig. 5
Fig. 5
The Y axis represents the species name at a certain taxonomic level, the X axis represents the average relative abundance of species in different groups, and columns of different colors represent different groups; the far right is the p value, * 0.01 < P ≤ 0.05, * *0.001 < P ≤ 0.01, ***P ≤ 0.001. Figure A represents the bacterial community, and figure B represents the fungal community
Fig. 6
Fig. 6
T-test to assess the significance between the treatments. The significance of the group has been marked by statistically significant letters (P < 0.05). Figure A, Shannon index student test for the bacterial community. Figure B, Shannon index (Student’s t-test) for fungal community. Control is defined is (CK), Biochar treatment is denoted as (B), the manure is presented as (M) and the combined treatment is denoted by (BM)
Fig. 7
Fig. 7
PCoA analysis depicts the change and similarity between the treatments for bacterial and fungal communities. A Beta diversity analysis for bacterial community. B Beta diversity analysis for fungal community. different groups is be presented in different colours. The igures (C) and (D) represent the the NMDS analysis of bacteria and fungi on the OTUs level
Fig. 8
Fig. 8
Figure A & B represent the bacterial phylum and genus level correlation with environmental factors, while the C & D represent the data of correlation among the fungi and environmental factors on the Phylum and Genus level. Points of different colors or shapes in the figure represent sample groups under different environments or conditions; species in the RDA graph are represented by blue arrows by default; Blue arrows represent species in the graph; red arrows represent quantitative environmental factors, the length of the environmental factor arrows represent the degree of influence (interpretation) of the environmental factors on the species data; the angle between the environmental factor arrows represents positive and negative correlations (acute angle: positive correlation; obtuse angle: negative correlation; right angle: no Correlation)
Fig. 9
Fig. 9
The correlation heat map shows the correlation between species and environmental factors, and intuitively shows the correlation between multiple environmental factors and different species and whether the correlation difference is significant. Legend: The X-axis and Y-axis are environmental factors and species, respectively. The R value is displayed in different colors in the figure. The P value less than 0.05, it is marked with *. The legend on the right is the color range of different R values

References

    1. Huang M, Tian A, Chen J, Cao F, Chen Y, Liu L. Soil bacterial communities in three rice-based cropping systems differing in productivity. Sci Rep. 2020;10(1):9867. - PMC - PubMed
    1. Mohidem NA, Hashim N, Shamsudin R, Che Man H. Rice for food security: revisiting its production, diversity, rice milling process and nutrient content. Agriculture. 2022;12(6):741.
    1. Liu Y, Liu C, Wang S, Guo K, Yang J, Zhang X, Li G. Organic carbon storage in four ecosystem types in the karst region of Southwestern China. PLoS ONE. 2013;8(2):e56443. - PMC - PubMed
    1. Valjavec MB, Čarni A, Žlindra D, Zorn M, Marinšek A. Soil organic carbon stock capacity in karst dolines under different land uses. CATENA. 2022;218:106548.
    1. Tyagi J, Ahmad S, Malik M. Nitrogenous fertilizers: impact on environment sustainability, mitigation strategies, and challenges. Int J Environ Sci Technol. 2022;19(11):11649–72.

LinkOut - more resources