. 2025 Jul 15;22(1):30.
doi: 10.1186/s12979-025-00526-8.

p38 mitogen-activated protein kinase drives senescence in CD4+ T lymphocytes and increases their pathological potential

Affiliations

p38 mitogen-activated protein kinase drives senescence in CD4+ T lymphocytes and increases their pathological potential

Luis González-Osuna et al. Immun Ageing. .

Abstract

Background: In several diseases, senescent T lymphocytes increase in number and release a senescence-associated secretory phenotype (SASP) with inflammatory and osteoclastogenic potential, favoring inflammation and bone loss. It is well known that the activation of p38 mitogen-activated protein kinase (p38 MAPK) orchestrates senescence in CD8+ T lymphocytes. However, p38 MAPK contribution to CD4+ T lymphocyte senescence remains less comprehensively characterized and warrants further investigation. This study investigates the contribution of p38 MAPK to senescence in CD4+ T lymphocytes, focusing on mitochondrial dysfunction and SASP production to elucidate their pathological potential.

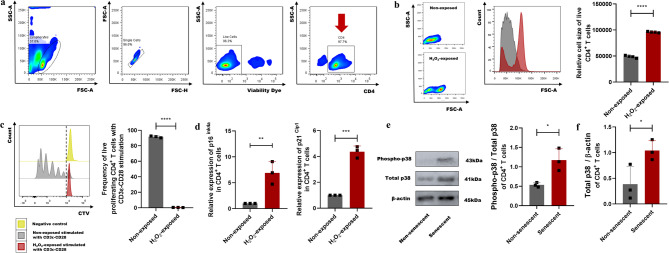
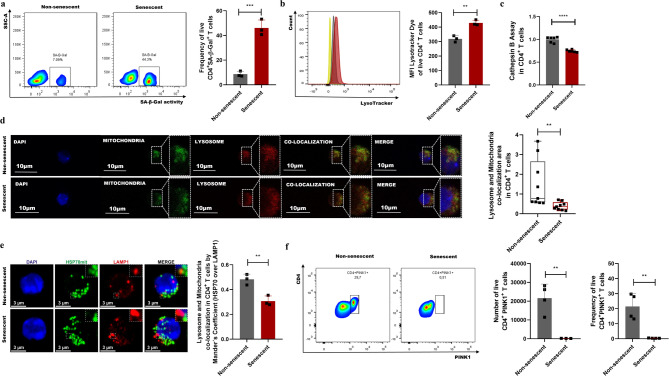
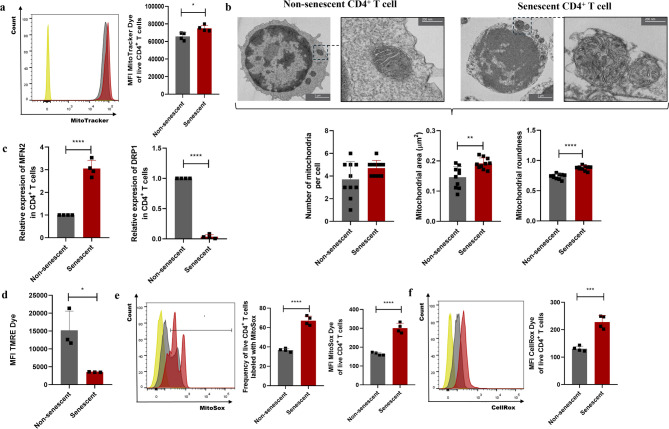
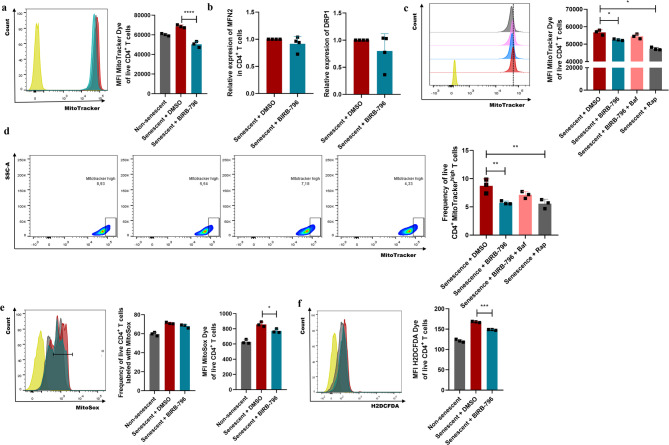
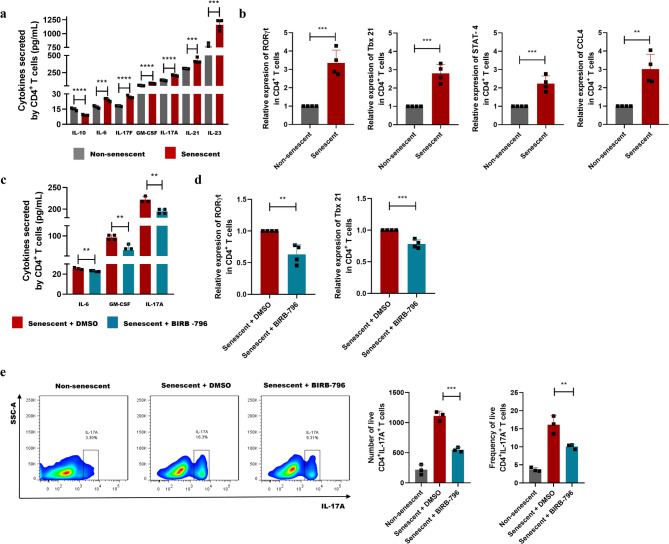
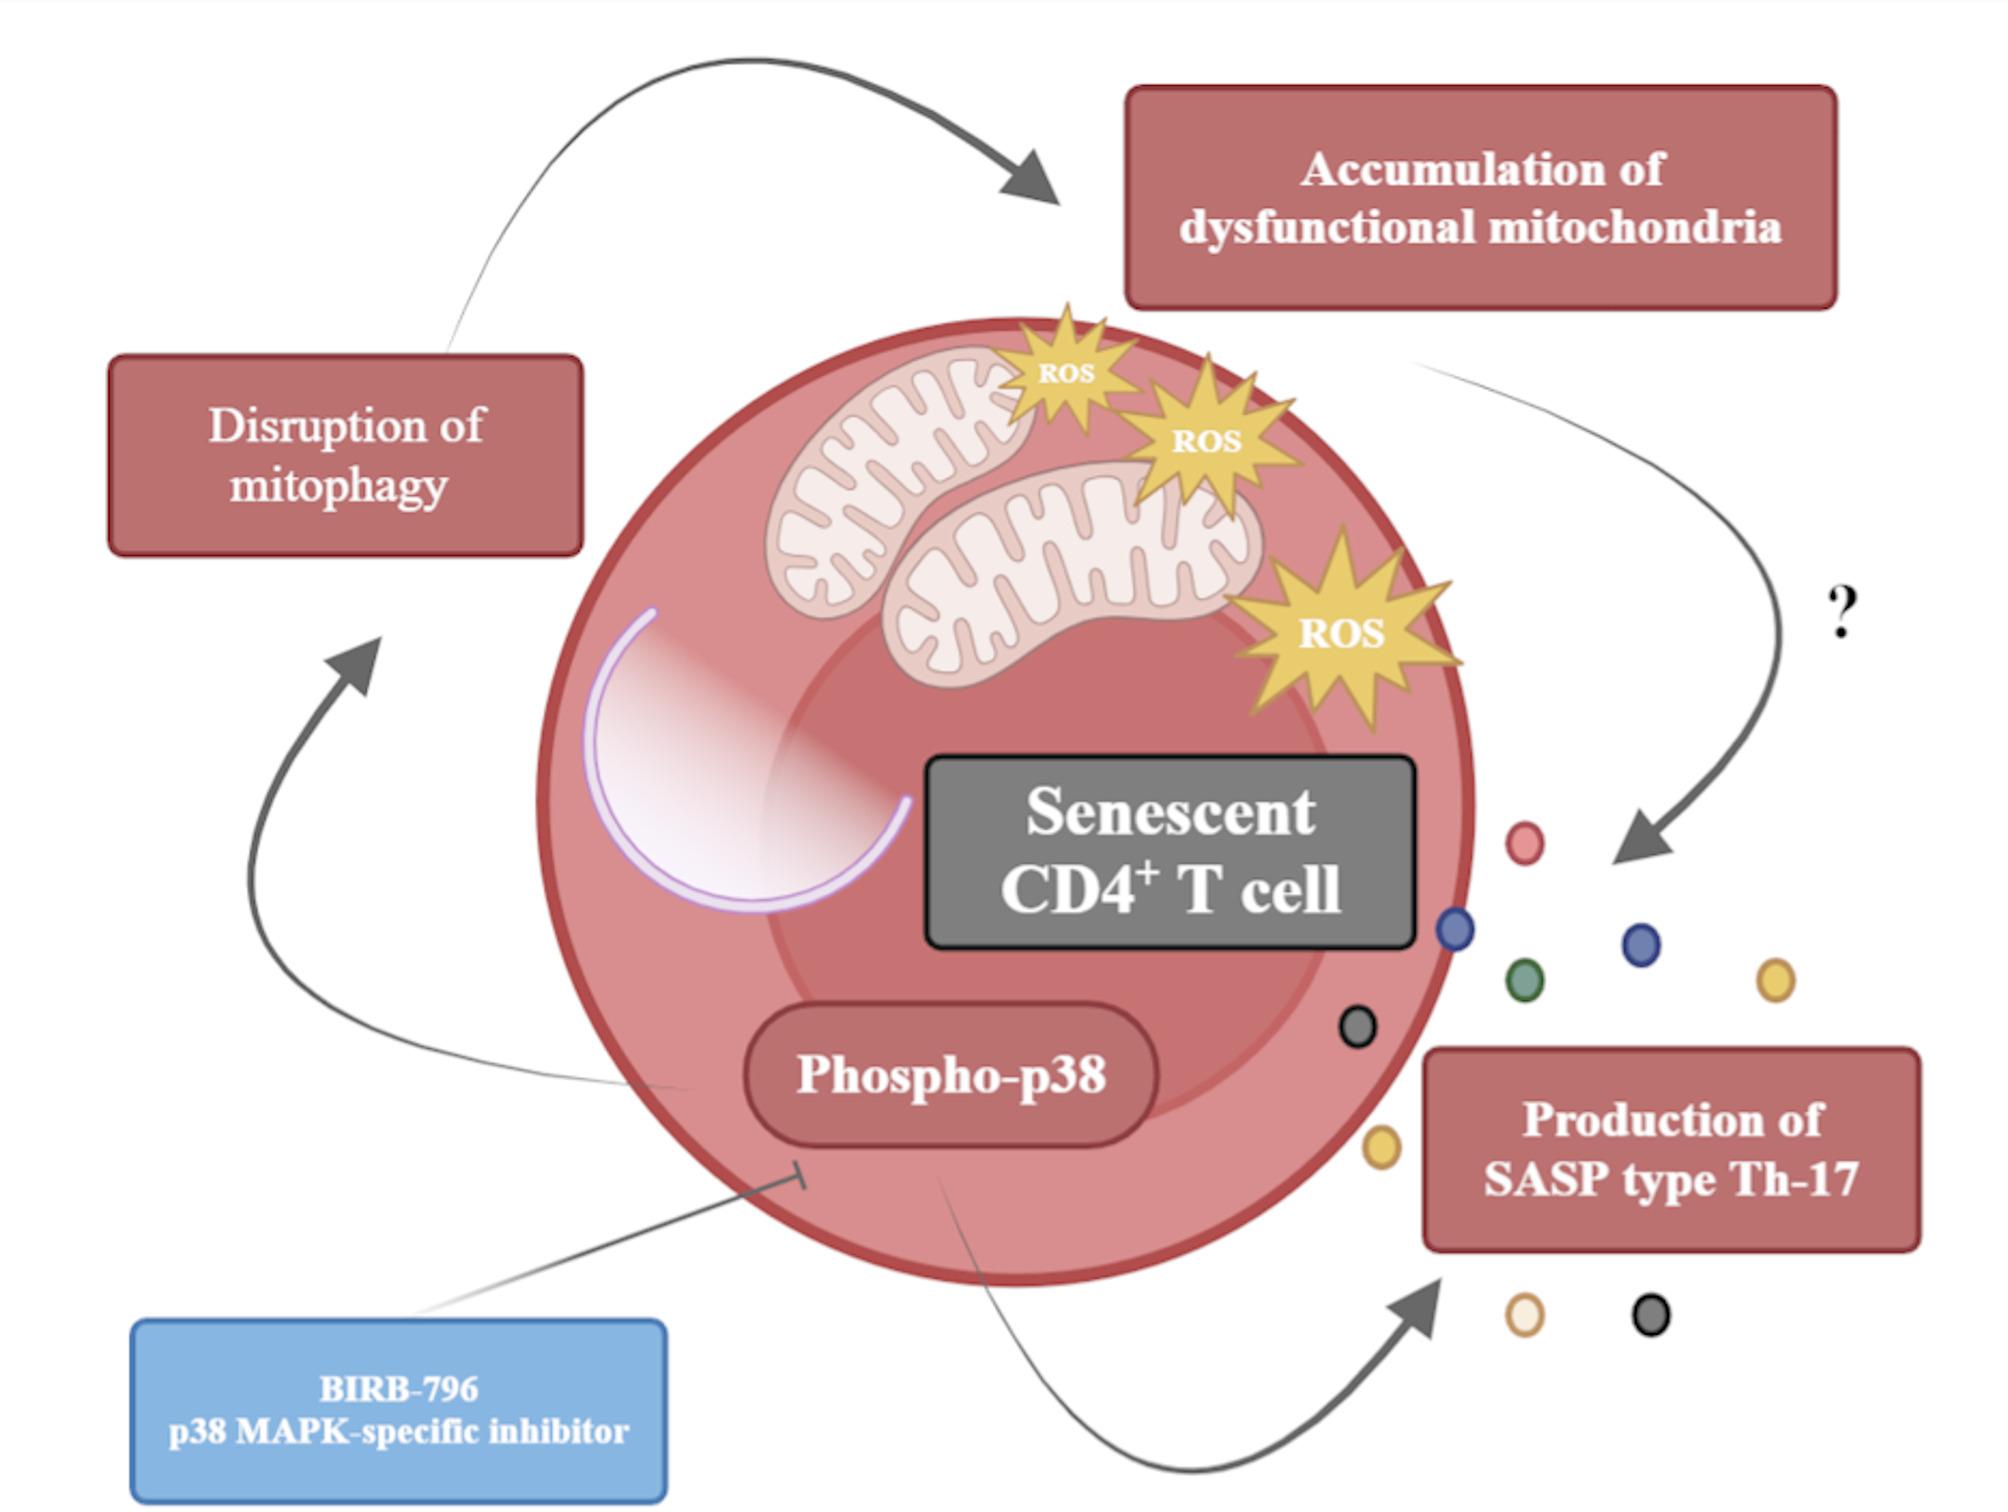
Results: Splenic CD4+ T lymphocytes isolated from wild-type C57BL/6 mice were subjected to subcytotoxic oxidative stress by H2O2 exposure to generate stress-induced premature senescence. H2O2-exposed CD4+ T lymphocytes exhibited hallmark features of senescence, including increased cell size, reduced cell proliferation, and upregulation of the cell cycle regulators p16Ink4a and p21Cip1. Additionally, these cells displayed defective mitophagy, accumulation of dysfunctional mitochondria, and a SASP enriched in Th17-associated cytokines. In senescence-induced CD4+ T lymphocytes, an increase in the expression of phospho-p38 MAPK was also detected. The senescence changes were reversed when p38 MAPK was blocked using the specific inhibitor BIRB-796. In particular, neutralizing p38 MAPK reduced mitochondrial dysfunction and Th17-type SASP production, demonstrating its critical role in driving these senescent traits in CD4+ T lymphocytes. These findings ratify the involvement of p38 MAPK as a central regulator of CD4+ T lymphocyte senescence, particularly concerning the accumulation of dysfunctional mitochondria and pro-inflammatory SASP production.

Conclusions: This study provides critical insights into immune aging mechanisms in CD4+ T lymphocytes and underscores the therapeutic potential of targeting p38 MAPK to mitigate senescence-driven inflammatory diseases.

Keywords: CD4-positive T-Lymphocyte; Cellular senescence; Mitophagy; SASP; p38 MAPK.


Conflict of interest statement

Declarations. Ethics approval: The study protocol was approved by the Institutional Committee for the Care and Use of Animals (CICUA), Protocol #ODO-UCH 23656. Competing interests: The authors declare no competing interests.

Figures

Fig. 1
Fig. 1
Characterization of the senescent CD4+ T lymphocytes. (a) Flow cytometry gating strategy used to determine the purity of viable CD4+ T lymphocytes isolated from the spleen of wild-type C57 BL/6 mice. The following sequential gating strategy steps were used: First, cells were physically selected according to their cell size (FSC-A) and internal cell complexity (SSC-A) parameters. Second, only single cells were selected according to their FSC-H and FSC-A characteristics, discarding fused cells as duplets or triplets. Third, dead cells were excluded. Finally, the viable CD4+ T cells were selected for analysis. This cell characterization was performed separately for each animal. (b) Flow cytometry histogram and bar plot show the cell size quantification of viable CD4+ T lymphocytes exposed or non-exposed to oxidative stress (H2O2). (c) Flow cytometry histogram and bar plot show the frequency of proliferating CD4+ lymphocytes. H2O2-exposed CD4+ T cells stimulated with CD3ε-CD28 (red) were compared with non-exposed CD4+ T cells stimulated with CD3ε-CD28 (gray). Non-exposed CD4+ T cells without CD3ε-CD28 stimulation were used as negative control (yellow). The dotted line indicates the reference point used to quantify the proliferating cells. (d) Relative quantification of the mRNA expression of the cell cycle inhibitors p16Ink4a and p21Cip1 in H2O2-exposed or non-exposed CD4+ T cells determined by RT-qPCR. (e) Western blot immunodetection of phospho-p38, total p38, and β-actin and quantification of the phospho-p38/total p38 band density in senescent and non-senescent CD4+ T lymphocytes. (f) Quantification of total p38/β-actin band density in senescent and non-senescent CD4+ T lymphocytes. Data are expressed as mean ± SD. Statistical analysis was performed using the unpaired Student’s t-test. *p < 0.05, **p < 0.01, ***p < 0.001, ****p < 0.0001
Fig. 2
Fig. 2
Mitophagy disruption in senescent CD4+ T lymphocytes. (a) Flow cytometry and bar plots showing the frequency of senescent or non-senescent CD4+ T lymphocytes with SA-β-Gal activity (CD4+SA-β-Gal+ T cells). (b) Flow cytometry histogram and bar plot showing the LysoTracker dye MFI in senescent or non-senescent CD4+ T lymphocytes. The histogram red peak corresponds to senescent CD4+ T lymphocytes, the grey peak to non-senescent CD4+ T lymphocytes, and the yellow peak to the negative control (LysoTracker dye MFO). (c) Quantification of the activity of Cathepsin B, used as a representative lysosomal enzyme, in senescent and non-senescent CD4+ T lymphocytes. (d) Representative immunofluorescence images and quantification of the mitochondria and lysosome co-localization area in live senescent and non-senescent CD4+ T lymphocytes. Immunofluorescence images show the cell nuclei stained with DAPI (blue), mitochondria (green), lysosomes (red), and area of mitochondria and lysosome co-localization (yellow) in the analyzed CD4+ T cells. The box-and-whisker plot shows the median, first and third quartiles as boxes, and 10th and 90th percentiles as whiskers. (e) Representative immunofluorescence images and quantification of the mitochondria and lysosome co-localization degree in fixed senescent and non-senescent CD4+ T lymphocytes. Immunofluorescence images show the cell nuclei stained with DAPI (blue), HSP70 (mitochondria, green), LAMP1 (lysosome, red), and degree of HSP70 and LAMP1 co-localization (yellow) using Manders’ overlap coefficients. Data are expressed as mean ± SD. (f) Flow cytometry and bar plots showing the number and frequency of senescent and non-senescent CD4+ T lymphocytes expressing PINK1 (CD4+PINK1+ T cells). Data are expressed as mean ± SD. Statistical analysis was performed using the unpaired Student’s t-test (bar plots) or the Mann-Whitney U-test (box-and-whisker plot). **p < 0.01, ***p < 0.001, ****p < 0.0001. MFI, mean fluorescence intensity; FMO, fluorescence minus one
Fig. 3
Fig. 3
Mitochondrial dysfunction in senescent CD4+ T lymphocytes. (a) Flow cytometry histogram and bar plot showing the MitoTracker dye MFI in senescent or non-senescent CD4+ T lymphocytes. (b) Transmission electron microscopy and bar plots showing the mitochondrial number, area, and roundness in senescent or non-senescent CD4+ T lymphocytes. (c) Relative quantification of the mRNA expression of the fusion/fission markers MFN2 and DRP1 in senescent or non-senescent CD4+ T lymphocytes determined by RT-qPCR. (d) Bar plot showing the TMRE dye MFI in senescent or non-senescent CD4+MitoTraker+ T lymphocytes, with the addition of the mitochondrial uncoupler CCCP. (e) Flow cytometry histogram and bar plot showing the frequency of MitoSox-positive cells and MitoSox dye MFI in senescent or non-senescent CD4+ T lymphocytes. (f) Flow cytometry histogram and bar plot showing the CellRox dye MFI in senescent or non-senescent CD4+ T lymphocytes. In all flow cytometry histograms, the red peak corresponds to senescent CD4+ T lymphocytes, the grey peak to non-senescent CD4+ T lymphocytes, and the yellow peak to the negative controls (MitoTracker, MitoSox, and CellRox dye MFO, respectively). Data are expressed as mean ± SD. Statistical analysis was performed using the unpaired Student’s t-test. *p < 0.05, **p < 0.01, ***p < 0.001, ****p < 0.0001. MFI, mean fluorescence intensity; MFO, fluorescence minus one; TMRE, Tetramethylrhodamine ethyl ester perchlorate
Fig. 4
Fig. 4
p38 MAPK in dysfunctional mitochondria accumulation and autophagy disruption in senescent CD4+ T lymphocytes. (a) Flow cytometry histogram and bar plot showing the MitoTracker dye MFI in senescent CD4+ T lymphocytes exposed to BIRB-796 or DMSO. Non-senescent CD4+ T lymphocytes were used for comparison. (b) Relative quantification of the mRNA expression of the fusion/fission markers MFN2 and DRP1 in senescent CD4+ T lymphocytes exposed to BIRB-796 or DMSO determined by RT-qPCR. (c) Flow cytometry histogram and bar plot showing the MitoTracker dye MFI in senescent CD4+ T lymphocytes exposed to BIRB-796, BIRB-796 plus Bafilomycin (autophagy inhibitor), Rapamycin (autophagy inducer), or DMSO. The histogram blue peak corresponds to senescent CD4+ T lymphocytes exposed to BIRB-796, the pink peak to senescent CD4+ T lymphocytes exposed to BIRB-796 plus Bafilomycin, the grey peak to senescent CD4+ T lymphocytes exposed to Rapamycin, the red peak to senescent CD4+ T lymphocytes exposed to DMSO, and the yellow peak to the negative control (MitoTracker dye MFO). (d) The same analysis described in (c) using the frequency of MitoTrackerhigh senescent CD4+ T lymphocytes. (e) Flow cytometry histogram and bar plot showing the frequency of MitoSox-positive cells and MitoSox dye MFI in senescent CD4+ T lymphocytes exposed to BIRB-796 or DMSO. Non-senescent CD4+ T lymphocytes were used for comparison. (f) Flow cytometry histogram and bar plot showing the H2DCFDA dye MFI in senescent CD4+ T lymphocytes exposed to BIRB-796 or DMSO. Non-senescent CD4+ T lymphocytes were used for comparison. In all flow cytometry histograms, the blue peak corresponds to senescent CD4+ T lymphocytes exposed to BIRB-796, the red peak to senescent CD4+ T lymphocytes exposed to DMSO, the grey peak to non-senescent CD4+ T lymphocytes, and the yellow peak to the negative controls (MitoTracker, MitoSox, and H2DCFDA dye MFO, respectively). Data are expressed as mean ± SD. Statistical analysis was performed using the unpaired Student’s t-test, when comparing two groups, or the one-way ANOVA and Tukey post hoc tests, when comparing more than two experimental groups. *p < 0.05, **p < 0.01, ***p < 0.001, ****p < 0.0001. Baf, bafilomycin; DMSO, dimethyl sulfoxide; H2DCFDA, 2′,7′-dichlorodihydrofluorescein diacetate reagents; MFI, mean fluorescence intensity, MFO: fluorescence minus one; Rap, rapamycin
Fig. 5
Fig. 5
Role of p38 MAPK in the Th17-type SASP release in senescent CD4+ T lymphocytes. (a) Quantification of the secreted levels of IL-6, IL-10, IL-17A, IL-17F, IL-21, IL-23, and GM-CSF in senescent and non-senescent CD4+ T lymphocytes determined by ELISA-Multiplex. (b) Relative quantification of the mRNA expression of RORγt, Tbx 21, STAT-4, and CCL4 in senescent and non-senescent CD4+ T lymphocytes determined by RT-qPCR. (c) Quantification of the secreted levels of IL-6, IL-17A, and GM-CSF in senescent CD4+ T lymphocytes exposed to BIRB-796 or DMSO. (d) Relative quantification of the mRNA expression of RORγt and Tbx 21 in senescent CD4+ T lymphocytes exposed to BIRB-796 or DMSO. (e) Flow cytometry and bar plots showing the number and frequency of senescent CD4+ T lymphocytes exposed to BIRB-796, exposed to DMSO, and non-senescent CD4+ T lymphocytes expressing IL-17A (CD4+IL-17A+ T cells). Data are expressed as mean ± SD. Statistical analysis was performed using the unpaired Student’s t-test. **p < 0.01, ***p < 0.001, ****p < 0.0001. CCL, chemokine ligand; DMSO, dimethyl sulfoxide; GM-CSF, granulocyte-macrophage colony-stimulating factor; IL, interleukin; ROR, retinoid-related orphan receptor; SASP, senescence-associated secretory phenotype; STAT, signal transducer and activator of transcription; Tbx, T-box transcription factor
Fig. 6
Fig. 6
Graphic summary that contextualizes the main findings of the present study. Activation of p38 MAPK drives cellular senescence in CD4+ T lymphocytes. Particularly, p38 MAPK activation causes mitophagy disruption, accumulation of dysfunctional mitochondria, and production of an SASP enriched in Th17-type mediators. These cell-senescent phenomena were inhibited when BIRB-796 was used to neutralize the p38 MAPK activation

Similar articles

References

    1. Hernandez-Segura A, Nehme J, Demaria M. Hallmarks of cellular senescence. Trends Cell Biol. 2018;28(6):436–53. - PubMed
    1. Zhou D, Borsa M, Simon AK. Hallmarks and detection techniques of cellular senescence and cellular ageing in immune cells. Aging Cell. 2021;20(2):e13316. - PMC - PubMed
    1. Weyand CM, Yang Z, Goronzy J. J. T-cell aging in rheumatoid arthritis. Curr Opin Rheumatol. 2014;26(1):93–100. - PMC - PubMed
    1. González-Osuna L, Sierra-Cristancho A, Rojas C, Cafferata EA, Melgar-Rodríguez S, Cárdenas AM, Vernal R. Premature senescence of T-cells favors bone loss during osteolytic diseases. A new concern in the osteoimmunology arena. Aging Dis. 2021;12(5):1150–61. - PMC - PubMed
    1. Vallejo AN, Weyand CM, Goronzy JJ. T-cell senescence: A culprit of immune abnormalities in chronic inflammation and persistent infection. Trends Mol Med. 2024;10(3):119–24. - PubMed

LinkOut - more resources