. 2025 Jul 15;44(1):208.
doi: 10.1186/s13046-025-03477-6.

Liensinine reshapes the immune microenvironment and enhances immunotherapy by reprogramming metabolism through the AMPK-HIF-1α axis in hepatocellular carcinoma

Affiliations

Liensinine reshapes the immune microenvironment and enhances immunotherapy by reprogramming metabolism through the AMPK-HIF-1α axis in hepatocellular carcinoma

Jiahao Liu et al. J Exp Clin Cancer Res. .

Abstract

Background: Hepatocellular carcinoma (HCC) is a leading cause of cancer-related mortality, with limited treatment options in advanced stages. Liensinine, a natural alkaloid derived from Nelumbo nucifera, has shown promise as an anticancer agent. However, its underlying mechanisms, particularly in modulating tumor metabolism and immune responses, remain poorly understood. This study aimed to investigate the antitumor effects of Liensinine in HCC, focusing on its ability to modulate metabolic pathways, immune responses, and the tumor microenvironment.

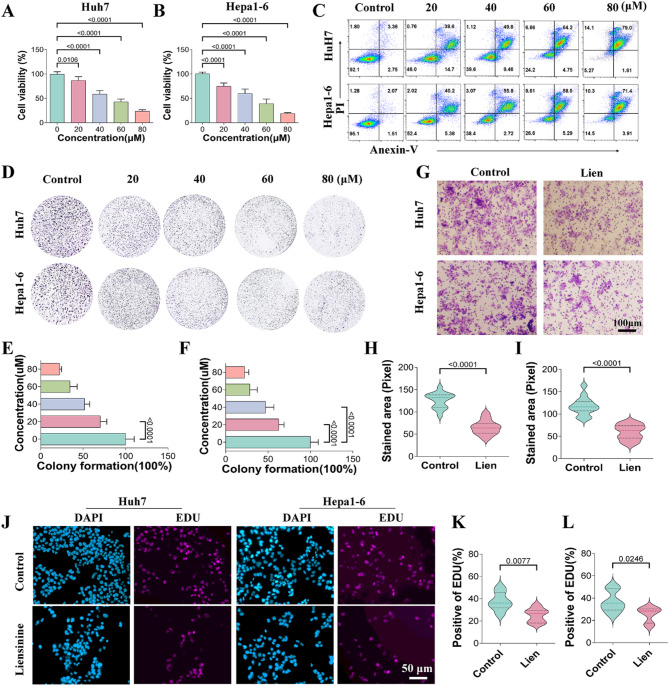
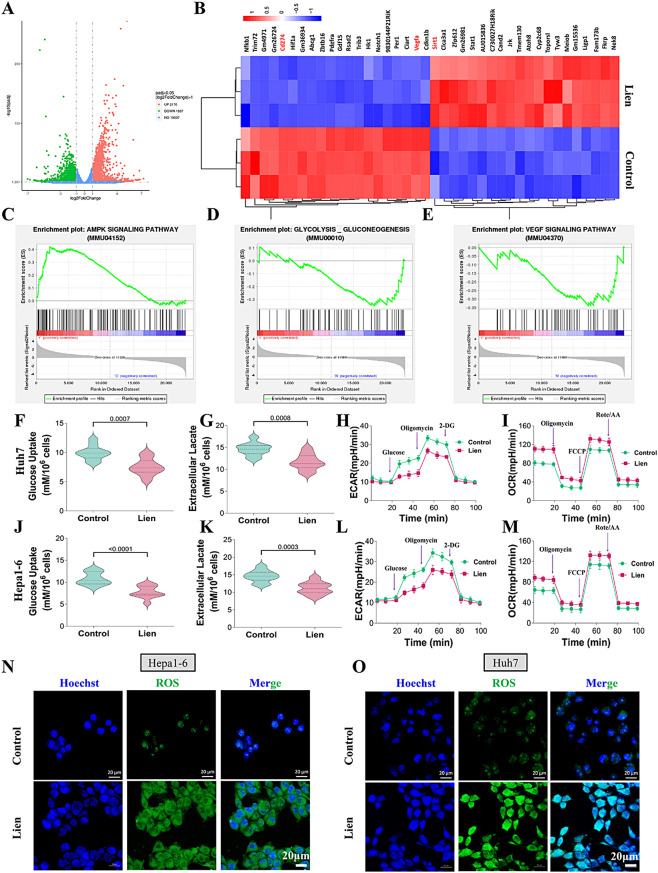
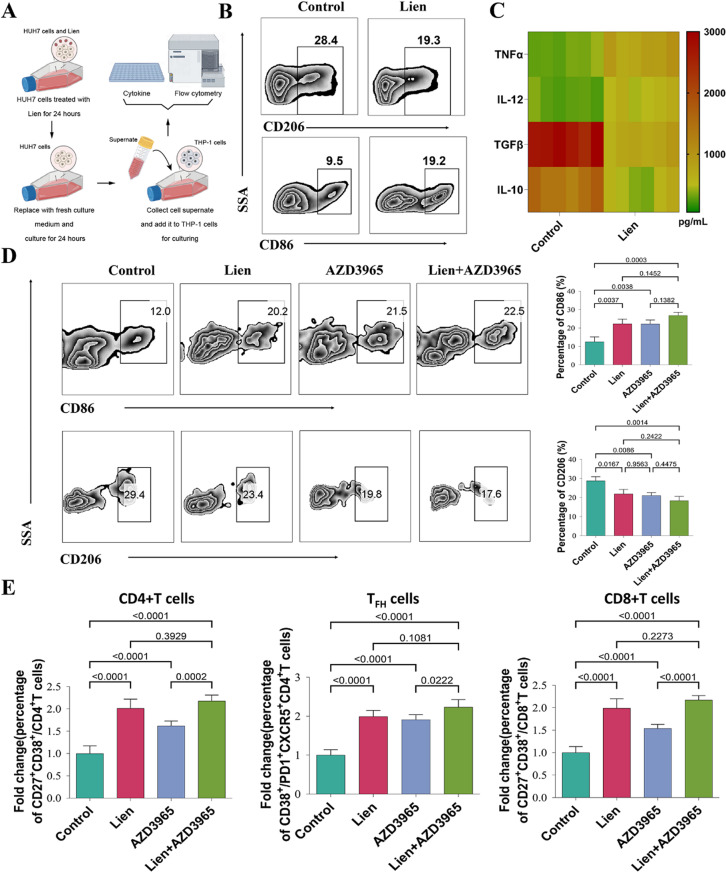
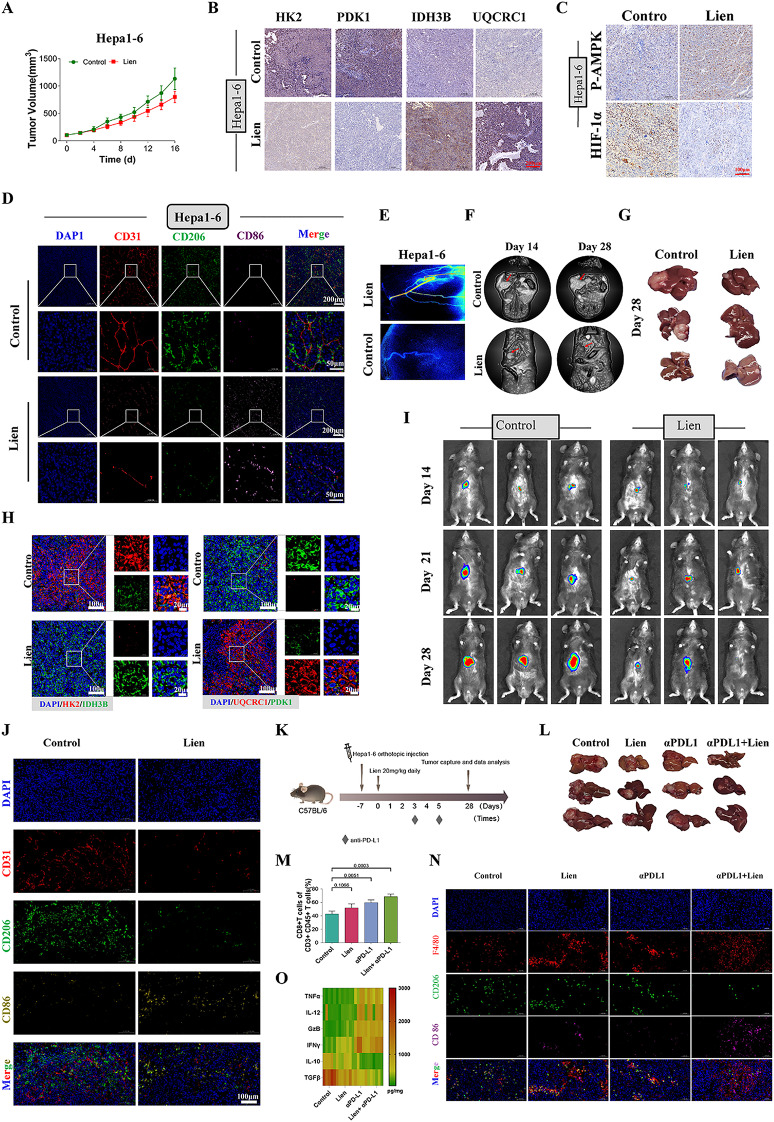
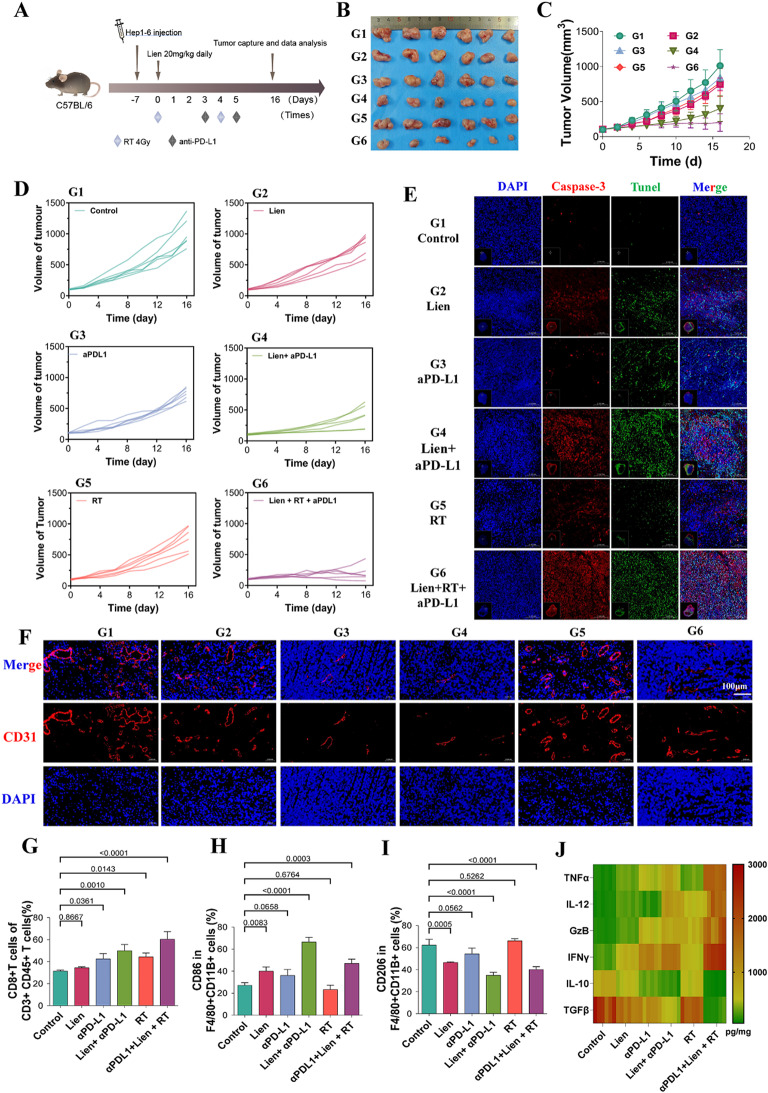
Methods: HCC cell lines (HUH7 and Hep1-6) were treated with Liensinine in vitro to assess cell viability, migration, proliferation, and apoptosis. Metabolic reprogramming was analyzed through RNA sequencing, Seahorse metabolic assays, and glucose/lactate measurements. The effects on immune cells were studied by treating THP-1 macrophages and peripheral blood mononuclear cells (PBMCs) with conditioned media from Liensinine-treated cells. In vivo, subcutaneous xenograft and orthotopic liver cancer models were used to evaluate the therapeutic efficacy of Liensinine combination with radiotherapy and immunotherapy.

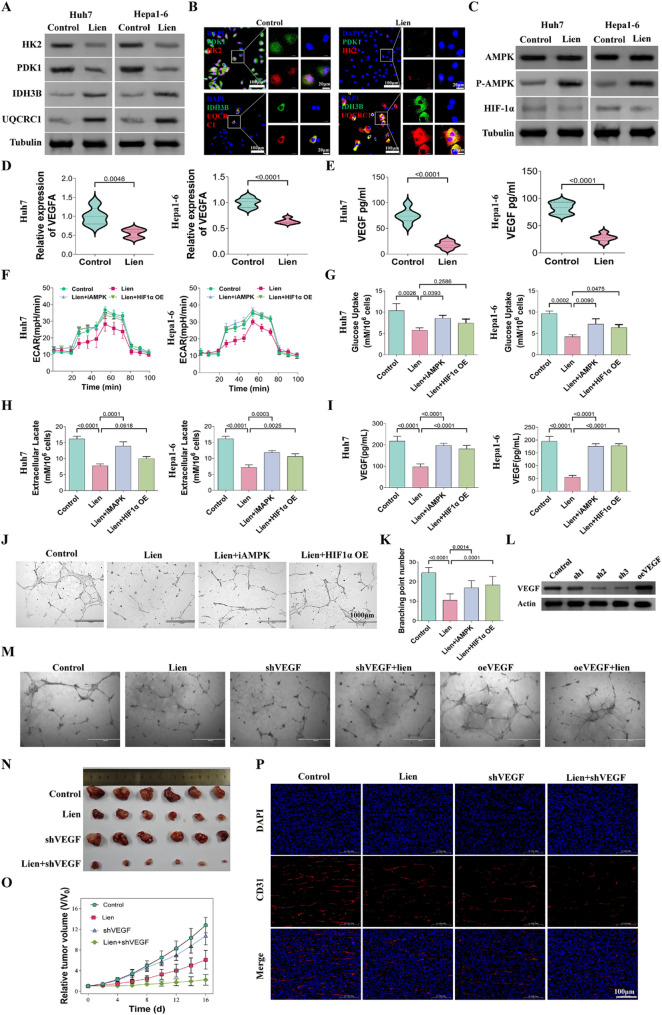
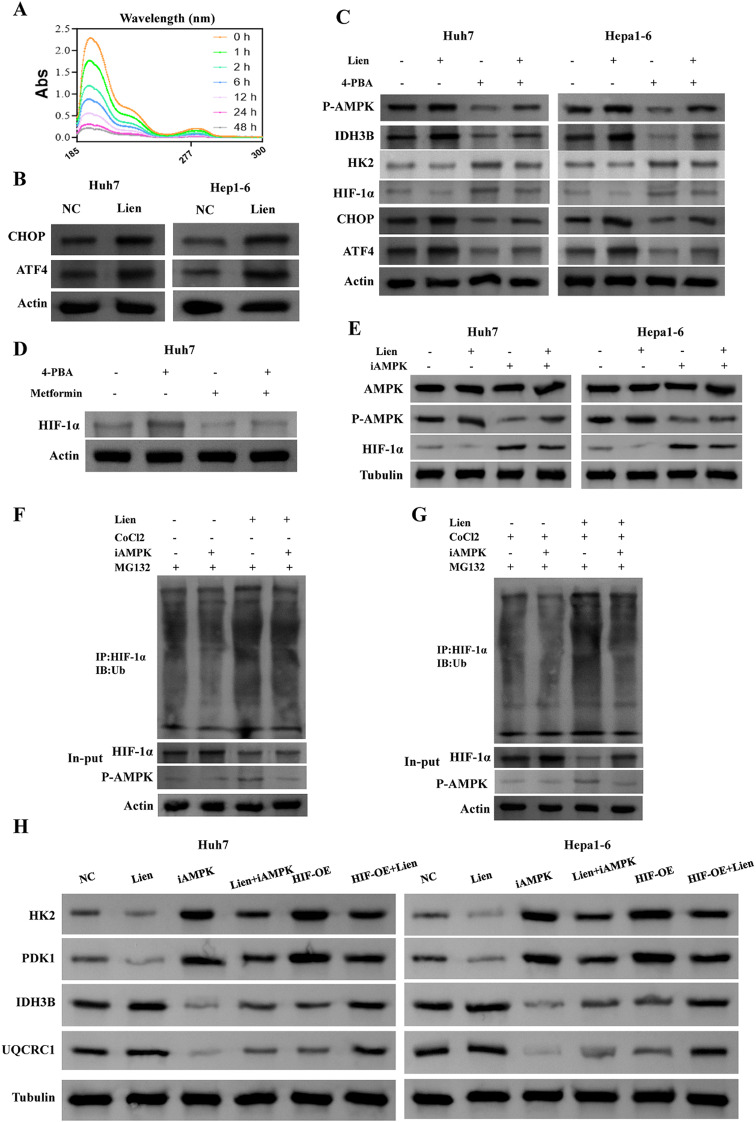
Results: Liensinine inhibited HCC cell viability, migration, and proliferation, promoting apoptosis and shifting metabolism from glycolysis to oxidative phosphorylation. This metabolic reprogramming was linked to the activation of the AMPK-HIF-1α axis and increased ROS production. Furthermore, Liensinine induced Endoplasmic reticulum (ER) stress, as evidenced by elevated levels of CHOP and ATF4, which contributed to AMPK activation and suppression of HIF-1α. Liensinine reduced PD-L1 expression, enhanced M1 macrophage polarization, and promoted CD8 + T cell infiltration into tumors. In vivo, Liensinine significantly suppressed tumor growth, reduced vascular density, and reshaped the immune microenvironment by promoting M1 macrophage polarization. Combination therapy with Liensinine, radiotherapy, and immunotherapy resulted in synergistic effects, including enhanced tumor cell apoptosis, increased immune cell infiltration, and improved therapeutic efficacy.

Conclusion: Liensinine exerts potent antitumor effects in HCC by reprogramming tumor metabolism, inducing ER stress, enhancing immune responses, and modulating the TME. The combination of Liensinine with immunotherapy and radiotherapy significantly improves therapeutic efficacy, suggesting its potential as a novel treatment strategy for HCC.

Keywords: AMPK; Angiogenesis; HCC; Hif-1α; Immunotherapy; Liensinine; Macrophage polarization; Metabolic reprogramming.


Conflict of interest statement

Declarations. Ethics approved: Animal studies and clinical samples were conducted in accordance with the Declaration of Helsinki and by the Ethics Committee of Xiangya Third Hospital, Central South University (22480). Competing interests: The authors declare no competing interests.

Figures

Fig. 1
Fig. 1
(A-B) Changes in the viability of Huh7 and Hep1-6 cells under different concentrations of Lien. (C) Apoptosis of Huh7 and Hep1-6 cells under different concentrations of Lien, detected by flow cytometry. (D-F) Clonogenic assay and quantification showing colony formation of Huh7 and Hep1-6 cells under various concentrations of liensinine. (G-I) Cell migration assay and quantification of Huh7 and Hep1-6 cells treated with 40 µM of liensinine. (J-L) EDU staining and quantification of proliferative Huh7 and Hep1-6 cells at a concentration of 40 µM liensinine. For the analyses in (A, B, E, F, H, I, K, L) (n = 5 independent samples), Student′s t test was conducted
Fig. 2
Fig. 2
(A) Volcano plot showing the differentially expressed genes between liensinine-treated and untreated Huh7 cells. (B) Heatmap of differentially expressed genes from the clustering analysis of liensinine-treated and untreated groups. (C-E) GSEA analysis indicating that liensinine positively regulates the AMPK pathway, while negatively regulating the glycolysis and VEGF pathways. (F-M) Measurement of glucose uptake, extracellular lactate levels, ECAR, and OCR in HUH7 and Hep1-6 cells with and without liensinine treatment. (N-O) Fluorescence staining of intracellular ROS levels in HUH7 and Hep1-6 cells treated with or without liensinine. For the analyses in (F, G, J, K) (n = 10 independent samples), Student′s t test was conducted
Fig. 3
Fig. 3
(A) Protein expression levels of HK2, PDK1, IDH3B, and UQCRC1 in HUH7 and Hep1-6 cells treated with or without liensinine. (B) Fluorescence staining of intracellular HK2, PDK1, IDH3B, and UQCRC1 in Huh7 cells treated with or without liensinine. (C) Protein expression levels of AMPK, p-AMPK, and HIF-1α in Huh7 and Hep1-6 cells with or without liensinine treatment. (D) RNA expression levels of VEGFA in Huh7 and Hep1-6 cells treated with or without liensinine. (E) VEGF levels in the supernatant of Huh7 and Hep1-6 cells treated with or without liensinine, as measured by ELISA. (F-I) Glucose uptake, extracellular lactate levels, and VEGF levels in the supernatant of Huh7 and Hep 1–6 cells under different treatment conditions. (J-K) Effect of the supernatant of Huh7 cells on HUVEC cell tube formation under different treatments and corresponding quantitative analysis. (L) Stable cell lines (Huh7) with VEGF knockdown and overexpression were constructed using lentivirus, and Western blotting was used to verify the VEGF expression levels. (M) Effect of the supernatant of Huh7 cells on HUVEC cell tube formation under different treatments. (N-O) The effect of Liensinine (Lien) and VEGF knockdown on tumor growth was assessed using a Huh7 xenograft mouse model. Corresponding tumor images and tumor growth curves were generated to evaluate the impact on tumor growth. (P) Immunofluorescence staining of CD31 was performed to assess the vascular formation in tumor tissues from different groups. For the analyses in (D, E, G, H, I, K) (n = 5 independent samples), Student′s t test was conducted
Fig. 4
Fig. 4
(A) The content of Liensinine in the extracellular medium was measured using UV spectroscopy. (B) Western blot analysis of endoplasmic reticulum stress-related proteins CHOP, ATF4 under Liensinine treatment. (C) Western blot analysis of CHOP, ATF4, P-AMPK, HIF-1a, IDH3B, HK2 under different treatment. (D) Western blot analysis of HIF-1a under different treatment. (E) Western blot analysis of AMPK, P-AMPK and HIF-1a under different treatment. (F-G) The effect of different treatments on HIF-1α ubiquitination under normoxic and hypoxic conditions was assessed, with MG132 (20 µM) treatment for 8 h prior to measurement. (H) Protein expression levels of HK2, PDK1, IDH3B, and UQCRC1 in Huh7 and Hep1-6 cells under different treatment conditions
Fig. 5
Fig. 5
(A) Schematic of the macrophage polarization assay. (B) Effect of the supernatant from liensinine-treated Huh7 cells on THP-1 cell polarization. (C) Levels of IL-10, TGFβ, IL-12, and TNFα in the supernatant. (D) Effects of conditioned medium from Huh7 cells under different treatment on THP-1 cell polarization. (E) Flow cytometric analysis of the activation of human peripheral immune cells by conditioned medium from Huh7 cells under different treatment conditions. For the analyses in (D, E) (n = 5 independent samples), Student′s t test was conducted
Fig. 6
Fig. 6
(A) Growth curves of Hepa1-6 xenograft tumors. (B) Immunohistochemical analysis of HK2, PDK1, IDH3B, and UQCRC1 expression in tumor tissues. (C) Immunohistochemical detection of P-AMPK and Hif-1a expression in HuH7 tumor tissues. (D) Immunofluorescence staining to assess the expression of CD31 (Red), CD206 (Green), and CD86 (purple) in tumor tissues. (E) In vivo angiogenesis of tumors observed through laser speckle imaging. (F) T2-weighted MRI images show liver tumors indicated by red arrows. (G) Liver tissues were collected and photographed on day 28 post-tumor implantation. (H) Immunofluorescence staining shows HK2 (red) and IDH3B (green) expression in liver tumor tissues, UQCRC1 (red) and PDK1 (green) expression were also detected via immunofluorescence. (I) Small animal fluorescence imaging was used to monitor liver tumor progression. (J) Additionally, CD31 (red), CD206 (green), and CD86 expression were observed in liver tumor tissues through immunofluorescence staining. (K) The dosing schedule diagram. (L) Liver tissues were collected and photographed on day 28 post-tumor treatment. (M) Flow cytometry analysis of the percentage of CD8 + T cells among CD3 + CD45 + T cells across treatment groups. (N) F4/80 (red), CD206 (green), and CD86 expression were observed in liver tumor tissues through immunofluorescence staining. (O) Cytokine levels in tumor tissue
Fig. 7
Fig. 7
(A) The dosing schedule diagram. (B) Tumor tissues were harvested and photographed on day 16 post-treatment. (C, D) Tumor growth curves of mice in each treatment group. (E) Immunofluorescence staining of caspase-3 (red) and TUNEL (green) in tumor tissues. (F) Immunofluorescence staining for CD31 (red) expression across treatment groups. (G) Flow cytometry analysis of the percentage of CD8 + T cells among CD3 + CD45 + T cells across treatment groups. (H, I) Flow cytometry analysis of the percentage of CD86 + M1 macrophages and CD206 + M2 macrophages within F4/80 + CD11b + macrophages. (J) ELISA was used to measure cytokine levels in tumor tissue homogenates. For the analyses in (G, H, I) (n = 5 independent samples), Student′s t test was conducted

Similar articles

References

    1. Siegel RL, Miller KD, Wagle NS, Jemal A. Cancer statistics, 2023. Cancer J Clin. 2023;73(1):17–48. - PubMed
    1. Li X, Ramadori P, Pfister D, Seehawer M, Zender L, Heikenwalder M. The immunological and metabolic landscape in primary and metastatic liver cancer. Nat Rev Cancer. 2021;21(9):541–57. - PubMed
    1. Salazar J, Le A. The heterogeneity of liver Cancer metabolism. Adv Exp Med Biol. 2021;1311:127–36. - PMC - PubMed
    1. Yang H, Cheng J, Zhuang H, Xu H, Wang Y, Zhang T, et al. Pharmacogenomic profiling of intra-tumor heterogeneity using a large organoid biobank of liver cancer. Cancer Cell. 2024;42(4):535–51. e8. - PubMed
    1. Yang F, Hilakivi-Clarke L, Shaha A, Wang Y, Wang X, Deng Y, et al. Metabolic reprogramming and its clinical implication for liver cancer. Hepatology. 2023;78(5):1602–24. - PMC - PubMed

MeSH terms