. 2025 Jul 15;27(1):132.
doi: 10.1186/s13058-025-02084-9.

Fibroblast growth factor receptor signaling modulates cholesterol storage in a SOAT1-dependent manner to promote mammary tumor cell invasion

Affiliations

Fibroblast growth factor receptor signaling modulates cholesterol storage in a SOAT1-dependent manner to promote mammary tumor cell invasion

Jennifer E Tuokkola et al. Breast Cancer Res. .

Abstract

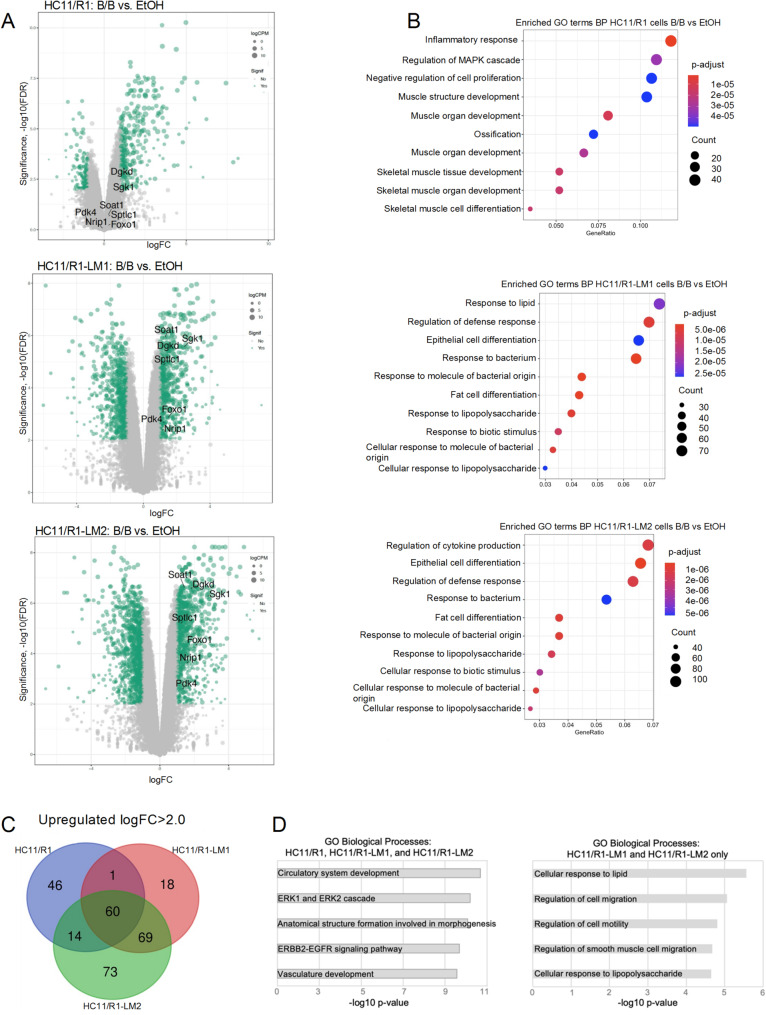
Signaling by fibroblast growth factor receptors (FGFRs) is active in up to 85% of breast cancers and results in enhanced proliferation, migration, and invasion of tumor cells. Here, we show that FGFR signaling regulates cholesterol metabolism in breast cancer. Specifically, we demonstrate that FGFR activation promotes cellular cholesterol storage by upregulating expression of the enzyme sterol O-acyltransferase 1 (SOAT1). Moreover, we demonstrate that inhibition of SOAT1 attenuates FGFR-driven colony formation and invasion in tumor cells, which correlates with reduced expression of matrix metalloproteinase expression. Furthermore, genetic knockdown of SOAT1 decreases mammary tumor growth in vivo. Taken together, these findings suggest a largely undiscovered metabolic role for FGFR signaling in regulating cholesterol metabolism in breast cancer and present a therapeutic vulnerability that could be targeted in FGFR-driven cancers.

Keywords: Cholesterol metabolism; Cholesterol storage; Fibroblast growth factor; Triple-negative breast cancer.


Conflict of interest statement

Declarations. Ethics approval and consent to participate: All animal care and procedures were approved by the University of Minnesota IACUC under protocol 2208–40316 A and were in accordance with the procedures detailed in the Guide for the Care and Use of Laboratory Animals. No human subjects were used in this study. Consent for publication: Not applicable. Competing interests: The authors declare no competing interests.

Figures

Fig. 1
Fig. 1
FGFR activation in breast cancer cells promotes colony formation and invasion. A, C) Immunoblot analysis of ERK activation in HC11/R1, HC11/R1-LM1, and HC11/R1-LM2 cells treated with B/B Homodimerizer (A) or 4T07 and 4T1 cells treated with bFGF (C). Western blot quantification is representative of a minimum of three different experiments. B, D) MTT survival analysis of HC11/R1, HC11/R1-LM1, and HC11/R1-LM2 cells (B) or 4T07 and 4T1 cells (D) treated with the FGFR inhibitor BGJ398. E-F) Quantitation of colony formation assays in HC11/R1, HC11/R1-LM1, and HC11/R1-LM2 cells treated with B/B Homodimerizer (E) or 4T07 and 4T1 cells treated with bFGF (F). G-H) Quantitation of transwell invasion assays in HC11/R1, HC11/R1-LM1, and HC11/R1-LM2 cells treated with B/B Homodimerizer (G) or 4T07 and 4T1 cells treated with bFGF (H). ns = not significant, *p < 0.05, **p < 0.01, ***p < 0.001, ****p < 0.0001, determined by two-way ANOVA
Fig. 2
Fig. 2
FGFR activation drives genes associated with cholesterol metabolism. (A) Volcano plots of differentially expressed genes in B/B-treated HC11/R1, HC11/R1-LM1, and HC11/R1-LM2 cells. Select lipid metabolic genes are labelled. (B) GO analysis of upregulated genes from (A). Only genes with log2FC ≥ 1.0, p-value ≤ 0.01 were included in the analysis. (C) Venn diagram of genes upregulated by B/B with log2FC ≥ 2.0. (D) GO analysis of the shared upregulated genes from (C). The left graph represents pathways upregulated in HC11/R1, HC11/R1-LM1, and HC11/R1-LM2 cells, the right graph represents pathways upregulated only in HC11/R1-LM1 and HC11/R1-LM2 cells
Fig. 3
Fig. 3
FGFR activation promotes cholesterol storage. (A-D) Cholesteryl esters were quantified in cell lines following 6 h of treatment. HC11/R1, HC11/R1-LM1, and HC11/R1-LM2 cells were treated with 30 nM B/B Homodimerizer (A). 4T07 and 4T1 cells were treated with 50 ng/mL bFGF (B). CAL-120 and Hs578T cells were treated with 50 ng/mL bFGF (C, D). (E-G) Representative images and quantification of Oil Red O staining in cells following overnight treatment. HC11/R1, HC11/R1-LM1, and HC11/R1-LM2 cells were treated with 30 nM B/B Homodimerizer (E, F). 4T07 and 4T1 cells were treated with 50 ng/mL bFGF (G, H). Scale bars are 100 μm. ns = not significant, *p < 0.05, **p < 0.01, ***p < 0.001, ****p < 0.0001, determined by two-way ANOVA (A, B, F, H) or Student’s unpaired t-test (C, D)
Fig. 4
Fig. 4
FGFR activation selectively upregulates cholesterol metabolic genes in cells with metastatic capacity. RT-qPCR analysis was used to assess the expression of genes related to cholesterol metabolism including: Soat1, Ldlr, Scarb1, Sqle, and Abca1. Gene expression was normalized to levels of either cyclophilin or GAPDH. (A) HC11/R1, HC11/R1-LM1, and HC11/R1-LM2 cells were treated with 30 nM B/B Homodimerizer for 2 h. (B) 4T07 and 4T1 cells were treated with 50 ng/mL bFGF for 2 h. (C, D) CAL-120 (C) or Hs578T (D) cells were treated with 50 ng/mL bFGF for 2 h. (E) HC11/R1, HC11/R1-LM1, and 4T1 cells were treated with 0.5 or 1 µM ERK inhibitor alone for 2 h and with ERK inhibitor plus 30 nM B/B Homodimerizer or 50 ng/mL bFGF for 2 additional hours. ns = not significant, *p < 0.05, **p < 0.01, ***p < 0.001, ****p < 0.0001, determined by two-way ANOVA (A, B,E), Student’s unpaired t-test (C, D), or one-way ANOVA (E)
Fig. 5
Fig. 5
SOAT1 inhibition suppresses FGFR-mediated colony formation. Representative images and quantification of colony formation assays in SOAT1 inhibitor-treated HC11/R1, HC11/R1-LM1, HC11/R1-LM2 cells (A, B), 4T07 and 4T1 cells (C, D), CAL-120 cells (E, F), or Hs578T cells (G, H). ns = not significant, *p < 0.05, **p < 0.01, ***p < 0.001, ****p < 0.0001, determined by one-way ANOVA
Fig. 6
Fig. 6
SOAT1 inhibition suppresses FGFR-mediated invasion. (A-D) Quantification of the number of invaded cells in SOAT1 inhibitor-treated HC11/R1, HC11/R1-LM1, and HC11/R1-LM2 cells (A), 4T07 and 4T1 cells (B), and CAL-120 cells (C) or in 4T1 cells treated with Soat1-targeting siRNA (D). (E, F) RT-qPCR analysis was used to assess the expression of MMP3 and MMP9 in cells treated with SOAT1 inhibitor. Gene expression was normalized to levels of either cyclophilin or GAPDH. ns = not significant, *p < 0.05, **p < 0.01, ***p < 0.001, ****p < 0.0001, determined by one-way ANOVA (A, B, C), Student’s unpaired t-test (D), or two-way ANOVA (E, F)
Fig. 7
Fig. 7
Genetic depletion of SOAT1 expression reduces mammary tumor growth. (A) Soat1 gene expression in 4T1, 4T1ΔSoat1−1, and 4T1ΔSoat1–2 cells treated with doxycycline. Gene expression levels were normalized to levels of GAPDH. (B) CE levels in 4T1, 4T1ΔSoat1−1, and 4T1ΔSoat1–2 cells treated with doxycycline. Each dot represents one replicate. (C) Tumor growth curve of 4T1 (gray, n = 9), 4T1ΔSoat1−1 (pink, n = 7), and 4T1ΔSoat1–2 (blue, n = 10) tumors in BALB/c mice, cutoff when the first mouse reaches endpoint. (D) Kaplan-Meier curves of 4T1 and ΔSoat1 tumor bearing mice. (E) Tumoral Soat1 gene expression levels of endpoint tumors from 4T1 and ΔSoat1 tumor bearing mice. (F) Tumoral CE levels of endpoint tumors from 4T1 and ΔSoat1 tumor bearing mice. (G, H) Representative hematoxylin and eosin images (G) and quantification (H) of lung metastasis in endpoint 4T1 and ΔSoat1 tumor bearing mice. *p < 0.05, **p < 0.01, ***p < 0.001, ****p < 0.0001, determined by two- way ANOVA (A, B, C), log-rank tests (D), or one-way ANOVA (E, F, G)

References

    1. Itoh N, Ornitz DM. Fibroblast growth factors: from molecular evolution to roles in development, metabolism and disease. J Biochem. 2011;149(2):121–30. - PMC - PubMed
    1. Grose R, Dickson C. Fibroblast growth factor signaling in tumorigenesis. Cytokine Growth Factor Rev. 2005;16(2):179–86. - PubMed
    1. Dickson C, Spencer-Dene B, Dillon C, Fantl V. Tyrosine kinase signalling in breast cancer: fibroblast growth factors and their receptors. Breast Cancer Res. 2000;2(3):191. - PMC - PubMed
    1. Turner N, Pearson A, Sharpe R, Lambros M, Geyer F, Lopez-Garcia MA, et al. FGFR1 amplification drives endocrine therapy resistance and is a therapeutic target in breast Cancer. Cancer Res. 2010;70(5):2085–94. - PMC - PubMed
    1. Courjal F, Cuny M, Simony-Lafontaine J, Louason G, Speiser P, Zeillinger R, et al. Mapping of DNA amplifications at 15 chromosomal localizations in 1875 breast tumors: definition of phenotypic groups. Cancer Res. 1997;57(19):4360–7. - PubMed

Substances

LinkOut - more resources