. 2025 Jul 15;22(1):244.
doi: 10.1186/s12985-025-02838-z.

Respiratory syncytial virus (RSV) enhances translation of virus-resembling AU-rich host transcripts

Affiliations

Respiratory syncytial virus (RSV) enhances translation of virus-resembling AU-rich host transcripts

Kyra Kerkhofs et al. Virol J. .

Abstract

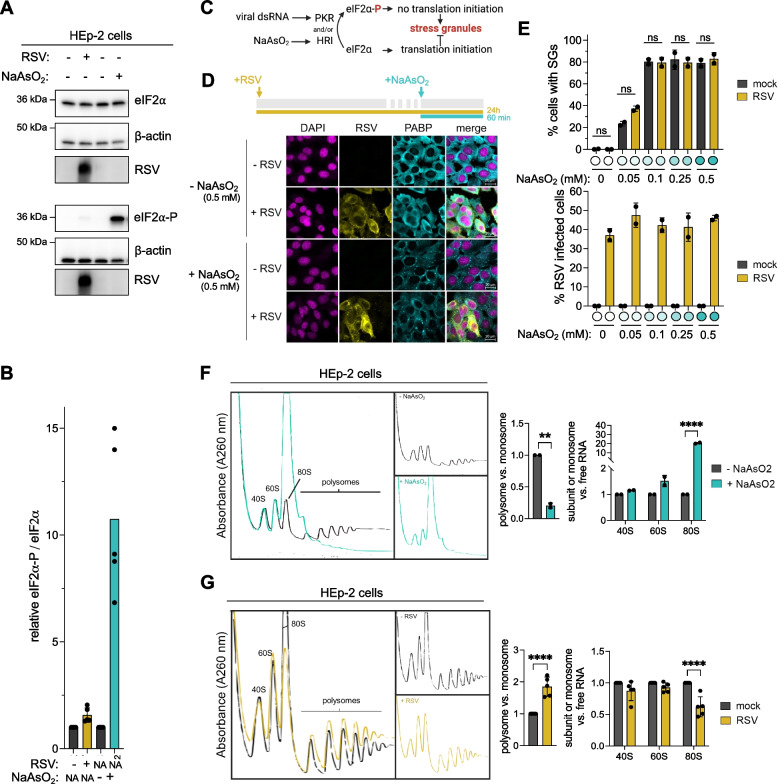
Background: Viruses strongly rely on the host's translational machinery to produce viral proteins required for replication. However, it is unknown how viruses that do not globally inhibit cap-dependent translation compete with abundant host transcripts for ribosomes. Viral infection often triggers eukaryotic initiator factor 2α (eIF2α) phosphorylation, leading to global 5'-cap-dependent translation inhibition. Respiratory syncytial virus (RSV) encodes mRNAs mimicking 5'-cap structures of host mRNAs and thus inhibition of cap-dependent translation initiation would likely also reduce viral translation.

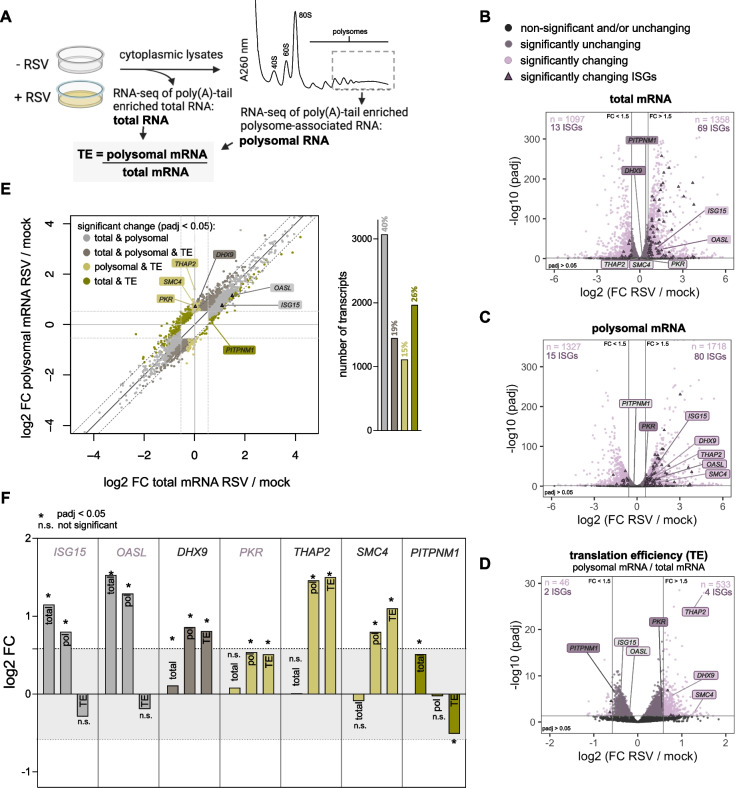
Methods: RSV-infected HEp-2 and A549 cells were analyzed to determine translation levels using western blotting, indirect immunofluorescent staining and polysome profiling. Transcriptome-wide translation efficiencies of virus-infected cells were compared against mock-infected cells using high-throughput sequencing of poly(A)-tail enriched total mRNA and transcripts associated with heavy polysomes.

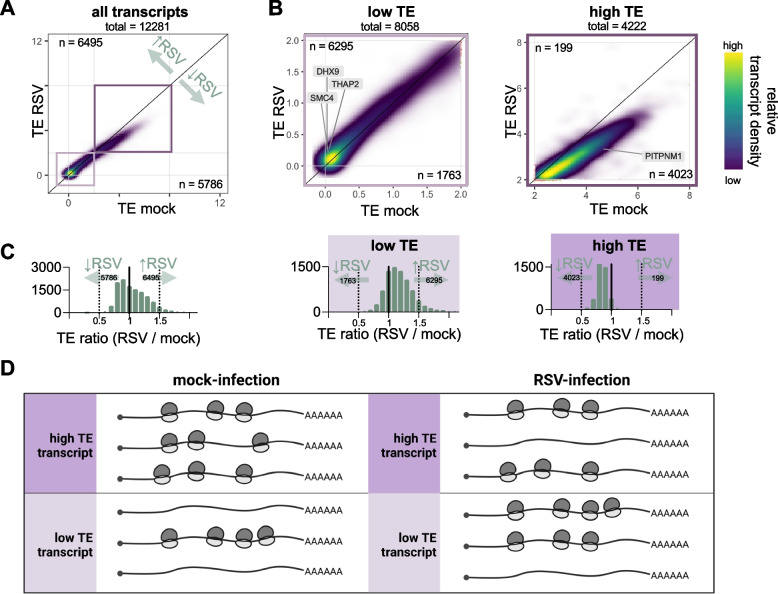
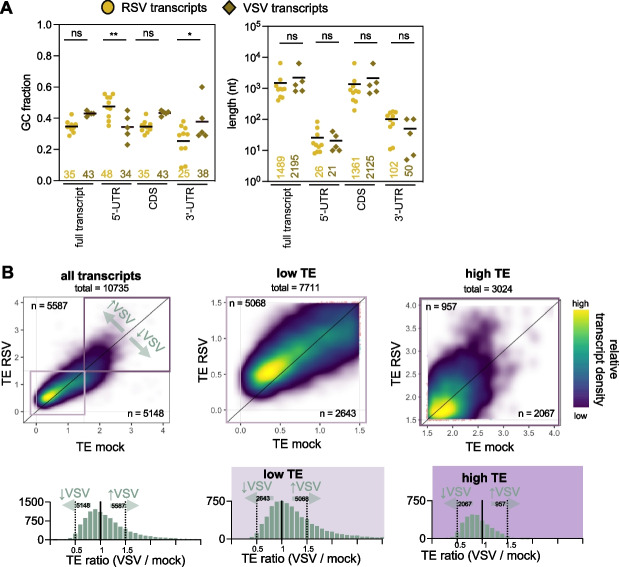
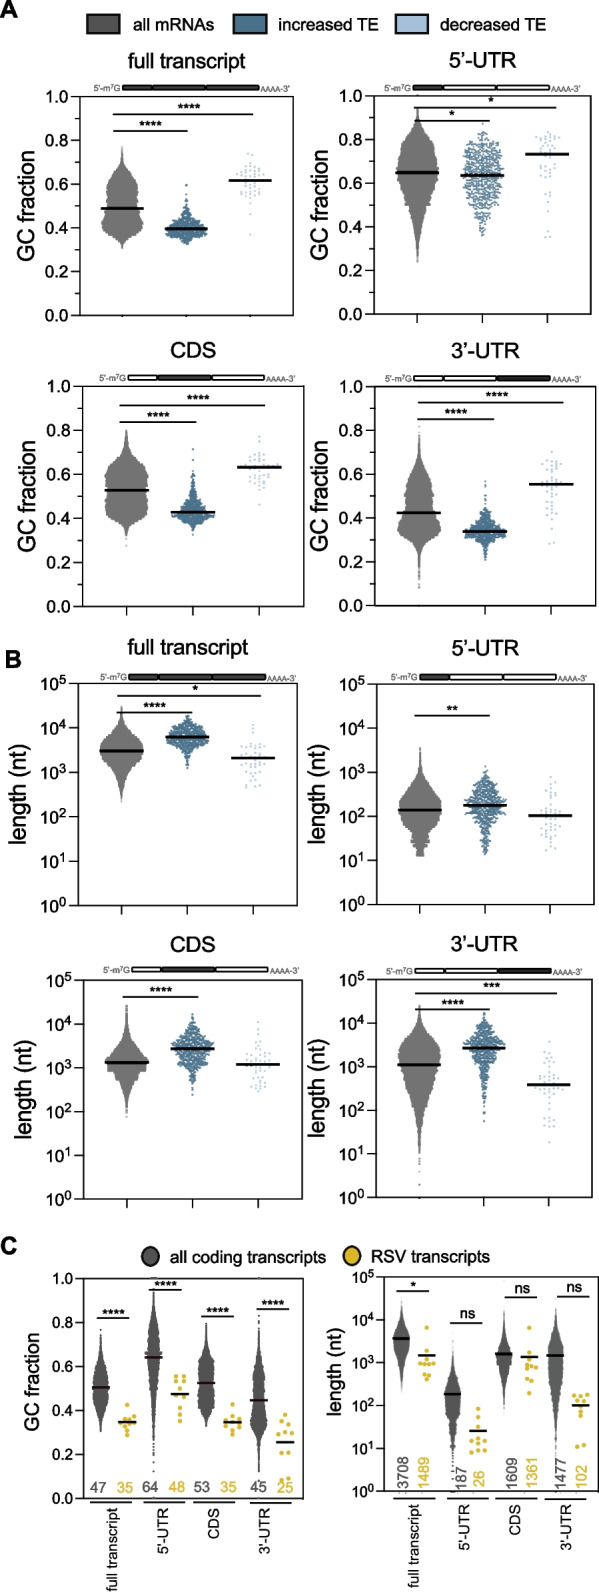
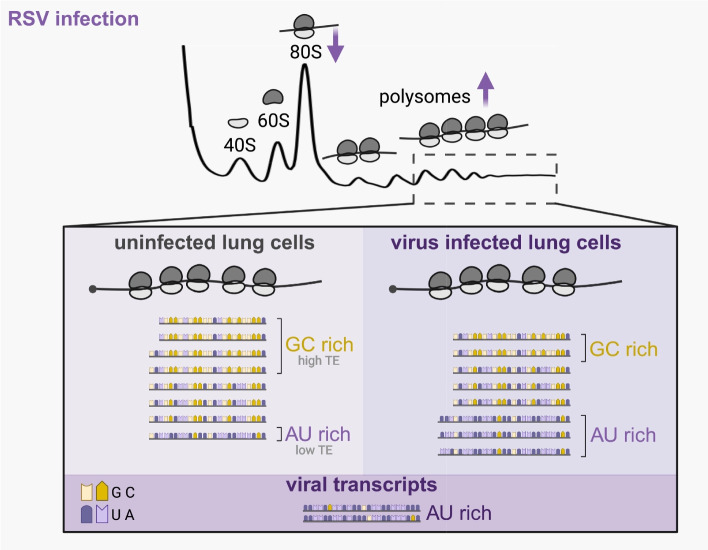
Results: We confirmed that RSV limits widespread translation initiation inhibition and unexpectedly found that the fraction of ribosomes within polysomes increases during infection, indicating higher ribosome loading on mRNAs during infection. High-throughput sequencing revealed that virus-resembling, AU-rich host transcripts become more efficient at ribosome recruitment. Using a previously published dataset, we observe similar trends in another negative-sense single-stranded RNA virus, vesicular stomatitis virus (VSV).

Conclusions: These findings revealed that RSV changes the translational landscape by enhancing translation of virus-resembling AU-rich host transcripts rather than inhibiting host translation.

Keywords: AU-rich transcripts; High-throughput sequencing; Polysome profiling; RSV; Translation efficiency; VSV.


Conflict of interest statement

Declarations. Ethics approval and consent to participate: Not applicable. Consent for publication: Not applicable. Competing interests: The authors declare no competing interests.

Figures

Fig. 1
Fig. 1
RSV infection maintains translation and increases polysome occupancy. A RSV infection only induces low levels of eIF2α phosphorylation. Western blot comparing eIF2α-P and total eIF2α levels between mock- and RSV-infected (MOI 2.5, 24 h) and untreated and NaAsO2-treated (positive control) (0.5 mM, 1 h) HEp-2 cells. RSV infection was confirmed by immunoblotting with a polyclonal anti-RSV antibody (pAb). β-actin serves as a loading control. B Relative quantification between eIF2α-P and total eIF2α levels against control cells (n = 5). P values were calculated with one-way ANOVA with Sidak’s multiple comparisons test. C Schematic representation of eIF2α-phosphorylating kinases activated during NaAsO2 stress (HRI) and viral infection (PKR). D RSV does not inhibit NaAsO2-induced stress granule formation. Indirect immunofluorescent staining of mock- and RSV-infected (MOI 2.5, 24 h) and NaAsO2-treated (0.5 mM, 1 h) HEp-2 cells (n = 1). DAPI staining identifies nuclei, PABP detects stress granules and RSV infected cells were detected with a polyclonal RSV antibody. E Quantification of mock- and RSV-infected HEp-2 cells (MOI 1.25, 24 h) treated with different concentrations of NaAsO2 (1 h). More than 200 cells were quantified at 20X magnification (n = 2). Number of cells were determined by DAPI, stress granules by PABP and RSV infection by polyclonal RSV staining. P values were calculated with one-way ANOVA with Tukey’s multiple comparisons test. F,G RSV redistributes 80S monosomes to polysomes. Polysome profiles of (F) untreated and NaAsO2-treated (0.5 mM, 1 h) and (G) mock- and RSV-infected (MOI 2.5, 24 h) sucrose gradient fractionated HEp-2 cells. AUC quantification between polysomes and monosomes (40S, 60S and 80S) are plotted to estimate translation levels. AUC quantification between free RNA fraction (not shown) and 40S, 60S and 80S are plotted to determine changes in free monosomes and 80S subunits. P values were calculated with an unpaired t-test for polysome vs monosome comparisons and a two-way ANOVA with Sidak’s multiple comparisons test. AUC: area under the curve
Fig. 2
Fig. 2
RSV infection induces distinct modes of host translation changes. A Schematic representation of experimental design. Cells were mock- (- RSV) or RSV-infected (+ RSV) with a multiplicity of infection (MOI) of 2.5 for 24 h. Prior to harvest, cells were treated with cycloheximide (CHX) to halt translation elongation and stabilize ribosomes on mRNA. Cell lysates were fractionated on sucrose gradients separating 40S, 60S, 80S and polysomes. RNA was isolated from heavy polysomes and from total RNA (acquired prior to fractionation), poly(A)-tail enriched and analyzed by next-generation sequencing. Differential expression analysis was completed by DESeq2. Translation efficiency (TE) was calculated by DESeq2 by taking ratios between polysomal and total RNA. B-D Volcano plots reveal differentially expressed host mRNAs between mock- and RSV-infected samples (MOI 2.5, 24 h) (three biological replicates) from total mRNA (B), polysomal mRNA (C) and translation efficiency (the ratio between polysomal and total mRNA) (D). Fold change (FC) and adjusted P values (padj) were obtained by DESeq2. The horizontal line indicates a cutoff of padj < 0.05 and vertical lines indicate a 1.5-FC. Significantly up- or downregulated transcripts are highlighted in light purple. Significantly up- or downregulated interferon stimulated genes (ISGs) are shown as dark purple triangles. The number of up- and downregulated transcripts are shown within each plot. Examples transcripts are shown on each plot with their label color corresponding to their significance and fold change. E Correlation analysis of changes between total mRNAs (RSV/mock) and polysome associated mRNAs (RSV/mock) with individual transcripts from volcano plots in B-D highlighted (left). Horizontal and vertical lines indicate a 1.5-FC. Diagonal lines indicate boundaries outside of which transcripts have significantly changing translation efficiencies (TE). Transcripts are color-coded based on significant (padj < 0.05) changes in total, polysomal and TE. Light grey: significant change in total and polysomal mRNA, without TE changes. Dark grey: significant change in total mRNA and stronger change in polysomal mRNA, leading to TE changes. Light green: significant change in polysomal mRNA, without changes in total mRNA, leading to changes in TE. Dark green: significant change in TE counteracting changes in total RNA. Bar plot of percentage of significantly (padj < 0.05) changing transcripts using the same color scheme (right). FC: fold change. F Examples of individual transcripts displayed throughout B-E. Bar graphs of transcripts are color-coded as in E, based on significant changes in total, polysomal and TE between mock- and RSV-infected cells. ISGs are shown in purple. The lines surrounding the light grey box indicate fold changes outside the 1.5-fold change cutoff
Fig. 3
Fig. 3
Transcripts with low TE become more efficient at ribosome recruitment during RSV infection. A,B Density scatterplots of TE between mock- and RSV-infected samples with a global overview (A) and zoomed versions (B). These plots demonstrate that RSV infection tends to reduce the TE of high TE transcripts and increase the TE of low TE transcripts. The color gradient represents the density of the dots with most abundant region shown in yellow and least abundant region shown in dark purple. The transcript density color gradient is relative and rescales in each individual plot. Transcript counts computed for any gene with TE change during infection, regardless of level of significance. The light purple box indicates low TE transcripts while the dark purple box indicates high TE transcripts. The number of transcripts on each side of the diagonal is displayed. C Histograms corresponding to scatterplots in A and B are shown below each graph representing the fold-change between TE for mock- and RSV-infected samples, to further illustrate how RSV infection differentially affects transcripts that are low- and high-TE under mock-infected conditions. D Schematic representation summarizing results from A-C. Transcripts are represented as heavily loaded with ribosomes or as non-translating mRNA since the experimental design was to measure heavy polysome-associated mRNA or input RNA for TE calculations. Some transcripts that are heavily loaded with ribosomes in the mock-infected condition (high TE) lose ribosomes after RSV infection. Conversely, some transcripts that are not loaded with ribosomes in the mock-infected condition (low TE) are loaded with ribosomes during RSV infection
Fig. 4
Fig. 4
VSV infection induces the same relative enhanced ribosome recruitment for transcripts with low TE. A Distribution of GC% and length of viral protein-coding transcripts comparing RSV and VSV. Average GC% and length values are displayed underneath and shown as horizontal lines. P values were calculated with one-way ANOVA with Sidak’s multiple comparisons test (P values: * < 0.05, ** < 0.01, ns: not significant). This analysis shows that the transcriptomes of the viruses are similar. B Translation efficiency (TE) calculated from normalized reads as in Fig. 3A [34]. Density scatterplots of TE compare mock- and VSV-infected samples (MOI 10, 6 h) with a global overview (top) and corresponding histograms (bottom) shown representing the fold-change between mock- and VSV-infected samples for all, low TE (< 1.5) and high TE (> 1.5) transcripts. This analysis reveals that VSV globally changes TE in a way that is similar to RSV
Fig. 5
Fig. 5
Transcripts with increased TE during RSV infection are more AU-rich and contain longer CDSs and 3’-UTRs. A,B Distributions of GC-content (A) and transcript length (B) of host protein-coding transcripts with significantly increased or decreased abundance and TE comparing RSV- and mock-infected samples (FDR < 0.05, FC > 1.5 and FC < 1.5). P values were calculated with one-way ANOVA with Tukey’s multiple comparisons test (P values: **** < 0.0001, *** < 0.001, ** < 0.01, * < 0.05). Averages are shown as horizontal lines. C Distributions of GC-content and length of viral protein-coding transcripts compared to all host mRNAs. Average GC% and length values are displayed underneath and shown as horizontal lines. P values were calculated with one-way ANOVA with Sidak’s multiple comparisons test (P values: **** < 0.0001, * < 0.05, ns: not significant)
Fig. 6
Fig. 6
Model summarizing translational changes during RSV infection. RSV infection of HEp2 cells leads to a redistribution of ribosomes towards the polysomes. The 80S monosome peak is consistently smaller, while the polysome peaks are larger. RNA sequencing of total RNA and heavy polysomes revealed that AU-rich low TE transcripts are more efficient at recruiting ribosomes during RSV infection. This is seen as an enhanced translation efficiency (TE) for these transcripts compared to mock-infected cells. On the other hand, GC-rich high TE transcripts have a decreased translation efficiency. Overall, ribosomes are redistributed during RSV infection resulting in a relative increase of translation efficiency of normally AU-rich low TE transcripts which resemble viral transcripts

Similar articles

References

    1. Stern-Ginossar N, Thompson SR, Mathews MB, Mohr I. Translational control in virus-infected cells. Cold Spring Harb Perspect Biol. 2019;11(3):a033001. - PMC - PubMed
    1. McCormick C, Khaperskyy DA. Translation inhibition and stress granules in the antiviral immune response. Nat Rev Immunol. 2017;17(10):647–60. - PubMed
    1. Anderson P, Kedersha N. RNA granules. J Cell Biol. 2006;172(6):803–8. - PMC - PubMed
    1. Mufson MA, Örvell C, Rafnar B, Norrby E. Two distinct subtypes of human respiratory syncytial virus. J Gen Virol. 1985;66(10):2111–24. - PubMed
    1. Dickens LE, Collins PL, Wertz GW. Transcriptional mapping of human respiratory syncytial virus. J Virol. 1984;52(2):364–9. - PMC - PubMed

Publication types

MeSH terms

Substances

LinkOut - more resources