. 2025 Jul 15;26(1):204.
doi: 10.1186/s13059-025-03687-3.

ZSCAN4 functions as a safeguard to maintain centromere integrity during oocyte meiosis

Affiliations

ZSCAN4 functions as a safeguard to maintain centromere integrity during oocyte meiosis

Da Yi Choi et al. Genome Biol. .

Abstract

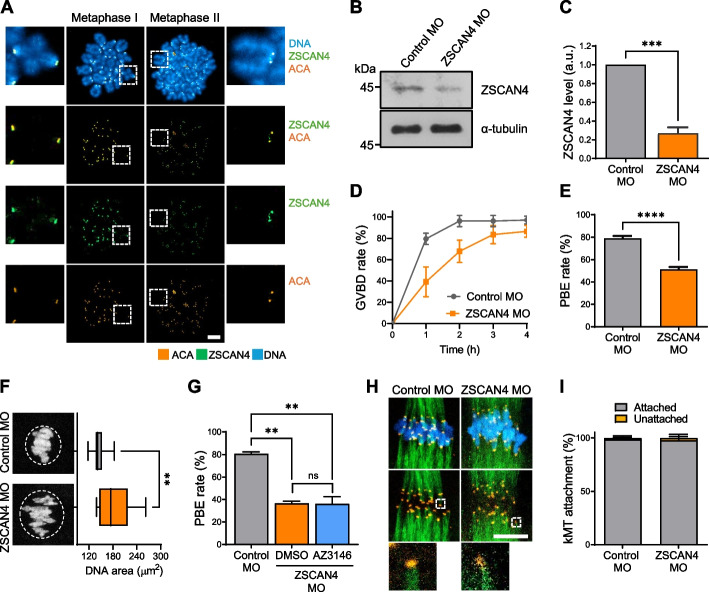
Background: Centromeres play a vital role in ensuring accurate chromosome segregation during meiosis by serving as the foundation for kinetochore assembly and microtubule attachment. In oocytes, maintaining centromere integrity is particularly critical due to the extended arrest period prior to meiotic resumption. However, the molecular safeguards that preserve centromere structure and function throughout oocyte maturation remain poorly understood.

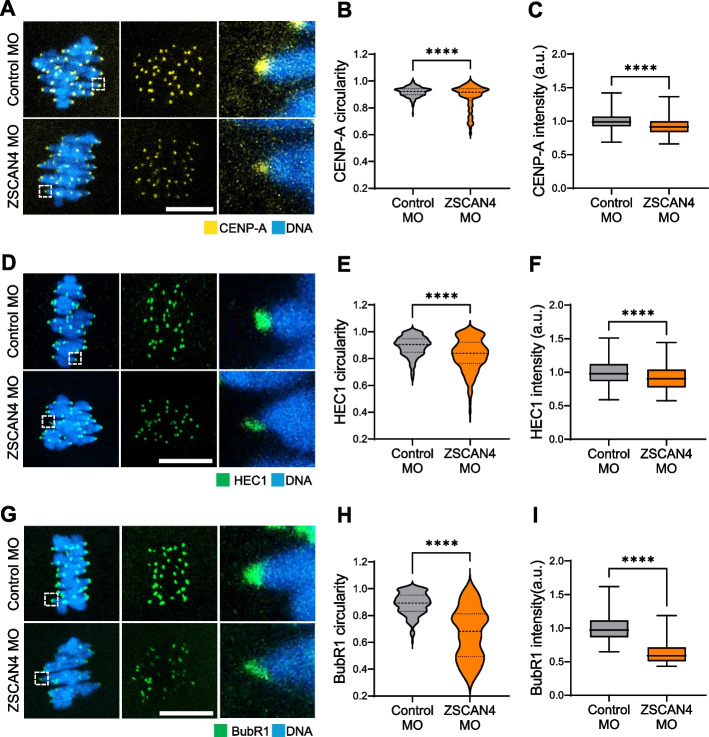
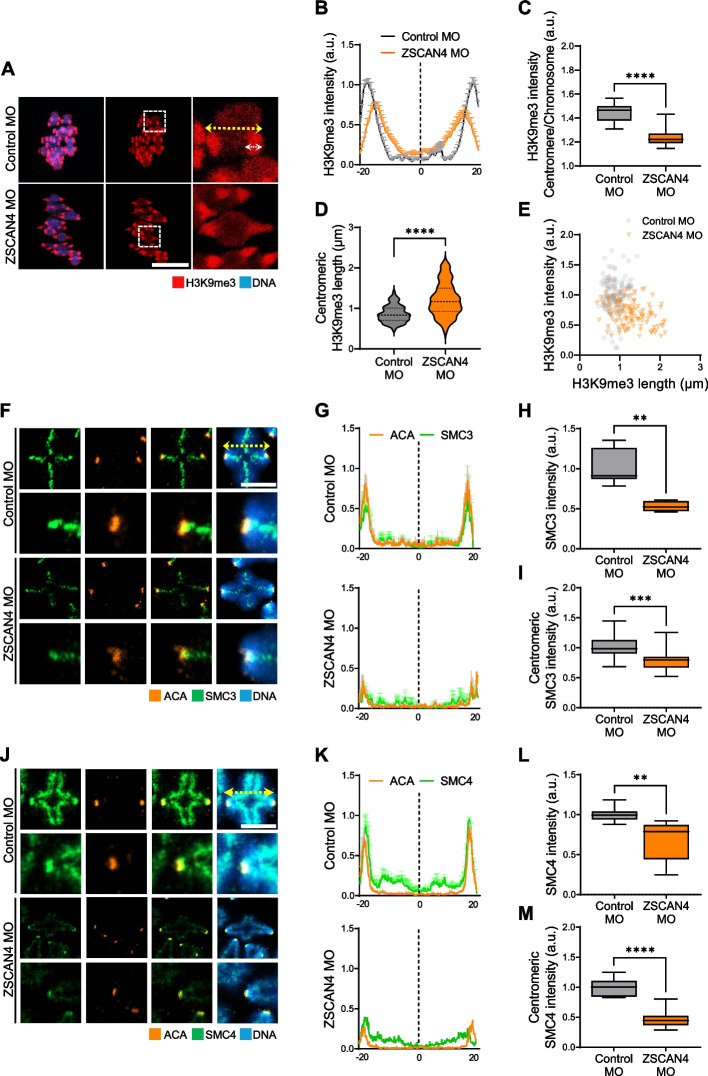
Results: Here, we identify ZSCAN4 as an essential regulator of centromere integrity during mouse oocyte meiosis. ZSCAN4 depletion leads to a marked reduction in key centromeric and kinetochore proteins, including CENP-A, accompanied by aberrant centromere stretching under spindle tension. Mechanistically, ZSCAN4 promotes pericentromeric H3K9me3 enrichment, facilitating proper chromatin compaction and chromosome alignment. Moreover, ZSCAN4 contributes to genomic stability by mediating the chromosomal recruitment of the CIP2A complex in response to DNA damage during meiotic progression.

Conclusions: These findings establish ZSCAN4 as a critical factor in preserving centromere structure and function during oocyte meiosis, with potential implications for female reproductive health and developmental competence.

Keywords: Centromere; Meiosis; Oocytes; SMC family; ZSCAN4.


Conflict of interest statement

Declarations. Ethics approval and consent to participate: Animal experiments were performed in strict compliance with institutional guidelines and were approved by the Institutional Animal Care and Use Committee of Sungkyunkwan University (approval ID: SKKUIACUC2023-09–31-1). Consent for publication: Not applicable. Competing interests: The authors declare no competing interests.

Figures

Fig. 1
Fig. 1
ZSCAN4 is a centromeric protein related to the proper maturation of mouse oocytes. A Subcellular localization of ZSCAN4 during mouse oocyte meiotic maturation. Oocytes were collected after 8 and 16 h of culture, corresponding to Metaphase I (MI) and Metaphase II (MII), respectively. Immunofluorescence staining was performed using ZSCAN4 and ACA antibodies. Scale bar, 10 μm. B, C Immunoblot analysis of ZSCAN4 expression in control and ZSCAN4-depleted oocytes. Oocytes were collected at the MI stage and subjected to immunoblot analysis with ZSCAN4 antibody. Each lane includes 50 oocytes, and α-tubulin was used as a loading control. Quantification of ZSCAN4 levels is shown in (C). Data are presented as the mean ± SEM of three independent experiments. ***p < 0.0001. D Quantification of the GVBD rate in ZSCAN4-depleted conditions. The GVBD rate was measured every 1 h from GV oocytes. Data are presented as the mean ± SEM of four independent experiments. E Quantification of the PBE rate in ZSCAN4-depleted conditions. The PBE rate was measured as the proportion of oocytes that had been incubated for 16 h and had a visible polar body identified on a DIC image. Data are presented as the mean ± SEM of four independent experiments. ****p < 0.00001. F Representative images and quantification of DNA area at the MI stage. DNA area was measured as the area of a circle that includes all the aligned chromosomes. Data are presented as the mean ± SEM of three independent experiments. **p < 0.001. G Quantification of the PBE rate with ZSCAN4 depletion and treatment with the MPS1 inhibitor AZ3146. Data are presented as the mean ± SEM of two independent experiments. ns, not significant. **p < 0.001. H Representative images of cold shock–treated control and ZSCAN4-depleted oocytes stained with acetylated alpha-tubulin and ACA antibodies at the MI stage. Scale bar, 10 μm. I Quantification of the rate of kMT attachment. Each centromere was scanned to determine whether it was attached to tubulin. Data are presented as the mean ± SEM of three independent experiments
Fig. 2
Fig. 2
ZSCAN4 depletion causes centromere stretching due to microtubule pulling forces. A Representative images of cold shock–treated control and ZSCAN4-depleted oocytes stained with acetylated alpha-tubulin and ACA antibodies at the MI stage. Scale bar, 10 μm. B Schematic diagram depicting centromere circularity. CD Quantification of ACA circularity and ACA intensity. Data are presented as the mean ± SEM of three independent experiments. ***p < 0.0001. ****p < 0.00001. E Representative live images of control and ZSCAN4-depleted oocytes targeting major satellite repeat sequences and H2B histone clusters. Scale bar, 10 μm. F-G Quantification of fluorescence intensity and area in major satellite repeat. The total major satellite signal was measured as the centromere area. Data are presented as the mean ± SEM of three independent experiments. H Quantification of the average time to undergo GVBD and establish centromere foci. Data are presented as the mean ± SEM of three independent experiments. I Representative images of control and ZSCAN4-depleted oocytes treated with DMSO or nocodazole (NOC) at the MI stage. After treatment, nocodazole was washed out with nocodazole-free medium for 2 h for recovery. Oocytes were stained with acetylated alpha-tubulin and ACA antibodies. Scale bar, 10 μm. J Quantification of ACA circularity. Data are presented as the mean ± SEM of three independent experiments. ns, not significant. ****p < 0.00001. K Schematic diagram depicting how ZSCAN4 protects the centromere from microtubule-derived pulling forces
Fig. 3
Fig. 3
ZSCAN4 depletion impairs the recruitment of CENP-A, HEC1, and BubR1 at centromeres and kinetochores. A, D, G Representative images of control and ZSCAN4-depleted oocytes stained with CENP-A (or HEC1 or BubR1) at the MI stage. Scale bar, 10 μm. B, E, H Quantification of CENP-A (or HEC1 or BubR1) circularity. Data are presented as the mean ± SEM of two independent experiments. ****p < 0.00001. C, F, I Quantification of CENP-A (or HEC1 or BubR1) intensity. Data are presented as the mean ± SEM of two independent experiments. ****p < 0.00001
Fig. 4
Fig. 4
ZSCAN4 depletion disrupts pericentric heterochromatin assembly and chromosome architecture. A Representative images of control and ZSCAN4-depleted oocytes stained with H3k9me3 antibody at the MI stage. Scale bar, 10 μm. B Plot graph depicting H3K9me3 intensity from one chromosome end (−20) to the opposite end (20) (yellow arrow). Ten representative chromosomes from control and ZSCAN4-depleted oocytes were selected for the plot. C Quantification of ratio intensity of H3k9me3 at centromeres over each chromosome (centromere/chromosome). Data are presented as the mean ± SEM of two independent experiments. ****p < 0.00001. D Quantification of centromeric H3K9me3 length (white arrow). Data are presented as the mean ± SEM of two independent experiments. ****p < 0.00001. E A scatter plot of control and ZSCAN4-depleted oocytes depicting centromeric H3K9me3 intensity relative to centromeric H3K9me3 length. Each symbol represents an individual centromere. F, J Representative chromosome spread images of control and ZSCAN4-depleted oocytes stained with SMC3 (or SMC4) and ACA antibodies at the MI stage. Scale bar, 10 μm. (G, K) Plot graph depicting SMC3 (or SMC4) and ACA intensities from one chromosome end (−20) to the opposite end (20) (yellow arrow). H, L Quantification of the SMC3 (or SMC4) intensity of each chromosome. Data are presented as the mean ± SEM of three independent experiments. **p < 0.001. I, M Quantification of SMC3 (or SMC4) intensity on centromeres. Data are presented as the mean ± SEM of three independent experiments. ***p < 0.0001. ****p < 0.0001
Fig. 5
Fig. 5
ZSCAN4 is essential for maintaining centromere integrity during prophase I arrest. A Representative images of control and ZSCAN4-depleted oocytes stained with ACA and anti-CENP-A antibodies at the GV stage. Scale bar, 10 μm. B Quantification of the number of CENP-A foci. Data are presented as the mean ± SEM of two independent experiments. ****p < 0.00001. C Quantification of CENP-A foci intensity. Data are presented as the mean ± SEM of two independent experiments. ****p < 0.00001. D Representative 3D reconstruction of CENP-A spots originally shown in Fig. 5A. Scale bar, 10 μm. E Quantification of CENP-A foci volume. Data are presented as the mean ± SEM of two independent experiments. ***p < 0.0001
Fig. 6
Fig. 6
ZSCAN4 depletion impairs DNA repair by disrupting chromosomal relocation of the CIP2A-MDC1-TOPBP1 complex. A Representative images of chromosome spread stained with ZSCAN4 antibody in control and ZSCAN4-depleted oocytes after treating ATM (ATM i) or PLK1 (PLK1 i) inhibitors. Oocytes were exposed to etoposide (ETP) to induce DSBs. Control oocytes were treated with DMSO. Scale bar, 10 μm. B Quantification of ZSCAN4 intensity. Data are presented as the mean ± SEM of two independent experiments. ns, not significant. **p < 0.001. ****p < 0.00001. C Representative images of control and ZSCAN4-depleted oocytes stained with phospho-MDC1 and CIP2A antibodies after ETP treatment and recovery (ETP + R). For recovery, ETP was washed out using ETP-free medium for 2 h. Scale bar, 10 μm. DE The ratio of p-MDC1 and CIP2A intensities at chromosomes over the spindle poles. Data are presented as the mean ± SEM of three independent experiments. ns, not significant. *p < 0.01. ***p < 0.0001. F Representative images of chromosome spread showing TUNEL signals in control and ZSCAN4-depleted oocytes after ETP treatment and recovery. Scale bar, 10 μm. G Quantification of TUNEL intensity. Data are presented as the mean ± SEM of three independent experiments. ns, not significant. ***p < 0.0001
Fig. 7
Fig. 7
ZSCAN4 functions as a safeguard to maintain centromere integrity during oocyte meiosis. A schematic model illustrating the role of ZSCAN4 in maintaining centromeric integrity during meiosis. In mouse oocytes, ZSCAN4 facilitates proper CENP-A loading and recruitment of kinetochore proteins. It also maintains pericentric heterochromatin by recruiting H3K9me3, cohesin, and condensin, ensuring centromere compaction. Thus, ZSCAN4 is vital for centromere and kinetochore formation during oocyte meiosis. Collectively, ZSCAN4 is required to maintain centromere integrity by preventing the centromere from elongating and stretching under microtubule forces

References

    1. McKinley KL, Cheeseman IM. The molecular basis for centromere identity and function. Nat Rev Mol Cell Biol. 2016;17:16–29. - PMC - PubMed
    1. Kixmoeller K, Allu PK, Black BE. The centromere comes into focus: from CENP-A nucleosomes to kinetochore connections with the spindle. Open Biol. 2020;10: 200051. - PMC - PubMed
    1. Fukagawa T, Earnshaw WC. The centromere: chromatin foundation for the kinetochore machinery. Dev Cell. 2014;30:496–508. - PMC - PubMed
    1. Barra V, Fachinetti D. The dark side of centromeres: types, causes and consequences of structural abnormalities implicating centromeric DNA. Nat Commun. 2018;9:4340. - PMC - PubMed
    1. Uhlmann F. SMC complexes: from DNA to chromosomes. Nat Rev Mol Cell Biol. 2016;17:399–412. - PubMed

LinkOut - more resources