. 2025 Jul 16;44(1):209.
doi: 10.1186/s13046-025-03476-7.

CC48 a new CB2R agonist/FAAH inhibitor dual drug blocks gastric cancer progression and overcomes paclitaxel resistance

Affiliations

CC48 a new CB2R agonist/FAAH inhibitor dual drug blocks gastric cancer progression and overcomes paclitaxel resistance

Annalisa Schirizzi et al. J Exp Clin Cancer Res. .

Abstract

Gastric cancer (GC) has poor survival in advanced stages, with limited treatment options. Paclitaxel (PTX) is commonly used, but resistance often arises, highlighting the need for targeted therapies. Cannabinoid receptor type 2 (CB2R) is overexpressed in several cancers and its activation has been associated with reduced tumor growth and metastasis. This study evaluated the antitumor activity of selected CB2R agonists with dual activity (CC48 and Fi9) compared to single-target compounds (ASF151), a reference agonist (compound 1), and an antagonist (AM630). The compounds' cytotoxicity was determined in GC lines, including PTX-resistant cells, with different levels of CB2R expression. Firstly, were ported that the addition of CB2R ligands to PTX significantly reduces the actively proliferating cells (Ki67+) even in chemotherapy-resistant GC cells. Concentrations below the IC50 of all compounds were used to minimise toxicity. Activation of Akt/mTORC1 and MAPK cascades were found to be related to antiproliferative activity, which was found to be independent of CB2R expression in the different cell lines. Surprisingly, both agonist and antagonist compounds inhibited cell growth. The interaction of CC48 and the reference compounds 1 and AM630, with P-glycoprotein (P-gp) could explain their greater effectiveness in overcoming PTX resistance. Furthermore, CC48 was particularly effective among the agonists in inducing the expression of key autophagy proteins and activating the apoptotic pathway via caspase 3/7 (p < 0.05). The combination of CC48 with PTX further amplified this effect in both sensitive and resistant cells (p < 0.01). CC48 significantly reduced GC cells migration and epithelial-mesenchymal transition (EMT) by modulating the vimentin protein (p < 0.05). In an orthotopic mouse model, CC48 inhibits tumor volume (p < 0.01)and also reduces the number of Ki67 + cells (p < 0.05), without cytotoxic effects. Histological analysis revealed widespread necrosis with inflammatory and apoptotic features, including pyknotic nuclei and fibrotic replacement in CC48-treatedtumors. Moreover, CC48 treatment reduced circulating levels of G-CSF, IL-12 (p40), and eotaxin (p < 0.05), suggesting an immunomodulatory role. In conclusion CC48, a novel multi-target ligand (MTDL), activating CB2R and inhibiting Fatty Acid Amide Hydrolase (FAAH), effectively blocks GC progression modulating the immune response and overcoming PTX resistance.

Keywords: CB2R ligands; Cannabinoid receptor subtype 2 (CB2R); Gastric cancer treatment; Novel target therapy; Paclitaxel-resistance.


Conflict of interest statement

Declarations. Ethics approval and consent to participate: The study was performed in the Test Facility BIOGEM(S.c.ar.l., Via Camporeale Area P.I.P., Ariano Irpino (AV) Italy) which is authorized to carry out this experimentation by means of the Ministerial Authorization n° 257I2023-PR and authorized for the use of animals for scientific purpose and regulatory research according to the Italian Decree N° 26/2014: authorization N° 08/2023-UT del 23/03/2023. The Test Facility Biogem is GLP certified and the in vivo phase of the study was performed under GLP-like conditions.Any deviation from normality was recorded. In case of death, a necropsy was performed. The animals were managed according to Directive 2010/63/UE regarding the protection of animals used for experimental or other scientific purposes, enforced by the Italian decree n° 26 of March 4, 2014. Competing interests: The authors declare no competing interests.

Figures

Fig. 1
Fig. 1
Dose-response curves and IC₅₀ determination of CB2R compounds across gastric cancer cell lines. MTT assays were performed at 48 and 72 h to calculate IC₅₀ values. The graphs represented the results expressed as % of vitality at 48 h and displayed five coloured sigmoid curves, each corresponding to a different CB2R compound: blue for the antagonist AM630, red for CC48, green for Fi9, purple for ASF151 and yellow for the reference compound 1. The corresponding IC₅₀ values with their standard error of the mean (SEM), are shown alongside. Data are from one of three independent experiments; each performed in triplicate
Fig. 2
Fig. 2
CB2R-binding compounds counter PTX resistance and promote PTX-mediated inhibition of cell proliferation.The Ki67 cytofluorimetric assay was performed after treatment of PTX-sensitive HGC27 cells and their resistant counterparts and NCI-N87 cells with a combination of 10µM CC48 or Fi9 or ASF151 or 1 or 6 µM AM630 with 4 µM PTX. A) Representative flow cytometry charts after exposure to CC48 and reporting the percentage of Ki67 negative (blue) and positive (red) cells; the Ki67 + population of the control is shown in grey. B) Statistical charts reporting the results obtained in HGC27-S, HGC27-R and NCI-N87, from three independent experiments and expressed as means ± SD. Statistical analysis was assessed by comparing the values obtained using single drug treatment to those of corresponding untreated cells and the combined treatments to those with PTX alone, *p < 0.05; **p < 0.01
Fig. 3
Fig. 3
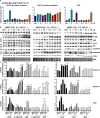
Western blot analysis of the expression and activation levels of key proteins involved in cell proliferation. Representative western blotting analyses performed in HGC27-S/R and statistical charts reporting the results from three independent experiments expressed as means ± SD. The expression of the phosphorylated and/or total forms of TSC2, AKT, p70, S6, 4EBP1, PI3K, and ERK1/2 after 48 h of treatment with the compounds AM630, CC48, Fi9, ASF151 and 1. The expression levels of each of the investigated proteins were normalized to the actin level, *p < 0.05; **p < 0.01; ***p < 0.001
Fig. 4
Fig. 4
Reactive Oxygen Species (ROS) induction. Production of the Reactive Oxygen Species (ROS) as percentage vs. untreated cells (ctrl) after 48 h treatment with each CB2R ligand at 1 µM in HGC27-S cells (A), in HGC27-R cells (B), in AGS cells (C). Data are means ± SD (n = 3). Significant results are marked as follows: *p < 0.05; ***p < 0.001; ****p < 0.0001
Fig. 5
Fig. 5
Western blot analysis of expression levels of key proteins involved in autophagy. A) Representative WB experiments showing the expression levels of autophagy-involved proteins ATG5, ATG7, ATG12, Beclin-1, LC3-II in PTX-sensitive and resistant HGC27 cell lines and AGS after 48 h of treatment with the compounds AM630, CC48, Fi9, ASF151 and 1. B) Statistical charts reporting the results from three independent experiments and expressed as means ± SD. Expression levels of each of the investigated proteins were normalized to the Tubulin level, *p < 0.05; **p < 0.01; ***p < 0.001;****p < 0.0001
Fig. 6
Fig. 6
Apoptotic effects of CB2R ligands in GC cell lines. A) Muse Annexin V Cell Assay for HGC27-S/R and AGS cell lines evaluated after 48 h of treatment with 1 µM or 6 µM of AM630 and 1 µM or 10 µM of CC48, Fi9, ASF151 and compound 1. Results expressed as relative apoptosis rate compared to control cells and derived from three independent experiments were expressed as mean ± SD and plotted in the corresponding graphs. *p < 0.05; **p < 0.01; B) Representative western blotting analyses performed in HGC27-S/R and AGS cells regarding the expression of PPRγ, P-JUN/JUN, P-JNK/JNK and cleaved caspase 3/7. Actin was used as a normalizer of the protein extracts. C) Statistical charts reporting the results from three independent western blotting experiments performed in HGC27-S/R and AGS cells and expressed as means ± SD, *p < 0.05; **p < 0.01; ***p < 0.001
Fig. 7
Fig. 7
Apoptotic profile of CB2R ligands and PTX in HGC27-S/R and NCI-N87 cells. The Muse caspase 3/7 activation Cell Assay was assessed after 48 h of both single drug treatments with 4 nM PTX, 6 µM AM630, 10 µM CC48, Fi9, ASF151 and compound 1, and after combined treatment of PTX with CB2R target compounds. A) Representative flow cytometry charts of HGC27-S/R are shown. Four cell populations can be distinguished, namely the percentage of live cells (bottom left quadrant), cells in early apoptosis (bottom right quadrant), in late apoptosis (top right quadrant) and dead cells (top left quadrant). B) The results derived from three independent experiments on HGC27-S, HGC27-R and NCI-N87 cell lines are expressed as means ± SD and reported in the relative graphs. Statistical analysis was conducted, comparing the values obtained using single drug treatment to those of corresponding untreated cells and the combined treatments to those of the single treatments, *p < 0.05; **p < 0.01; ***p < 0.001
Fig. 8
Fig. 8
Effects of CB2R ligands on inhibition of cell migration and VEGFA secretion. A) Scratch assay evaluated on HGC27-S/R and AGS treated with 1 and 6 µM AM630 and 1 and 10 µM CC48, Fi9, ASF151 and 1. Cells were microscopically analyzed at the time of scratching (T0) and after 24 h (T1). The relative migration rate was calculated by placing the percentage migration of control cells at time T1 equal to 1 and comparing the percentage migration of cells after each drug treatment with this value. The experiments were performed in triples and the average SD values were plotted in the relative graph. *p < 0,05; **p < 0,01; B) Representative western blotting analyses performed in HGC27- S/R and AGS cells regarding the expression of P-βcatenin/βcatenin, vimentin and P-cofillin/cofillin. Actin was used as a normalization of the protein extracts; C) Effects of CB2R ligands on VEGFA/VEGFC secretion. The ELISA assay was assessed on HGC27-S/R and AGS treated with 1 and 6 µM AM630 and 1 and 10 µM CC48, Fi9, ASF151 and 1. The concentration of VEGFA was determined in the medium and normalized for the cell number. The values ± SD, obtained from three independent experiments expressed as pg/mL were shown in the relative graphs.**p < 0,01; ***p < 0,001
Fig. 9
Fig. 9
CB2R agonist CC48 reduces tumor masses in mice. (A) Tumor growth was evaluated weekly using an IVIS spectrum PerkinElmer. Tumor masses measurements were started on the fifth day after intraperitoneal inoculation of GC cell line NCl-N87_LUC and were performed twice a week until day 41; (B) From the statistical analysis performed on the data obtained throughout the study (up to day 41), a substantial and significant decrease in tumor volume was observed at day 41 in mice treated with both CC48 concentrations (GP2, 10 mg/kg and GP3, 20 mg/kg), compared to the control group (vehicle) (**p < 0.01 for GP2 and ***p < 0.001 for GP3).Dunnett’s multiple comparison statistical test was applied; (C) No statistically significant differences were observed between the control group (vehicle) and the two treated groups (GP2 and GP3) in relation to body weight, suggesting that the drug did not negatively affect the growth or energy balance of the animals. D-E) Similarly, the biochemical (D, E) and urinary (E) parameters analysed did not show any significant alterations in the treated groups (GP2 and GP3), as compared to the control group. Abbreviations BW: Body Weight; AST: Aspartate Transferase; ALT: Alanine Aminotransferase; Cre: Creatinine; GFR Glomerular Filtration Rate
Fig. 10
Fig. 10
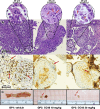
CC48 reduces tumor cells proliferation in treated mice (A) Histological sections stained with hematoxylin & eosin, representative of the tumor masses from each of the three experimental groups, vehicle-treated control group (GP1), group treated with 10 mg/Kg CC48 (GP2) and group treated with 20 mg/Kg CC48 (GP3) Lens: 10X. Bar: 100 μm. Circled areas enclose details of each histologic section taken at 40X magnification. In GP1 there are viable neoplastic cells, in GP2 the red arrow on the left indicates the necrotic area, and the two red arrows on the right indicate the lymphocytic infiltrate. In the GP3 group of mice, where the malignancy infiltrates the striated muscle of the murine diaphragm, the left arrow indicates a foamy histiocyte with fragmented nucleus, the right arrow indicates another foamy histiocyte with pyknotic nucleus (hydropic degeneration of tumor tissue) Lens: 40X. Bar: 25 μm. (B) At Immunohistochemical analysis of the intra-tumoral Ki67 marker as an index of cell proliferation, we calculated a mean of 35% of Ki67 stained nuclei in GP1 and a mean of 15–20% in GP2/GP3 (*p < 0.05 GP3 vs. GP1). Red arrows indicate some Ki67 positive nuclei. Lens: 10X. Bar: 100 μm. (C) The sampled tumor masses were photographed on graph paper. Images are representative of each treatment group
Fig. 11
Fig. 11
CB2R agonist CC48 reduces circulating levels of specific inflammatory cytokine. Serum levels of eotaxin, G-CSF, IFN-γ, IL-1α, IL-12 (p70), IL-17 A, GRO/KC (CXCL1), MCP-1 (CCL2), MIP-1β and RANTES were measured in serum samples and compared within the three experimental groups (GP1: vehicle; GP2: 10 mg/Kg CC48; GP3: 20 mg/Kg CC48). For each analyte, the value is the average of the six mice in each group ± SD ed expressed as pg/mL.*p < 0.05; **p < 0.01
Fig. 12
Fig. 12
Effects of CC48 on tumour growth, selected as a first-in-class cannabinoid receptor type 2 (CB2R) multi-target agent. The agonist CC48 exerts its antitumour activity in gastric cancer cell models by (i) binding to CB2R; (ii) inhibiting the FAAH enzyme; (iii) interacting with the P-gp protein responsible for the efflux of the chemotherapeutic drug PTX from the tumor cell. The main molecular pathways regulated by CC48 and involved in proliferation, autophagy and apoptosis were depicted. Previous studies have shown that the same pathways are involved in the anti-tumor activity of PTX. CC48 enhances PTX-induced cell growth inhibition, even in chemotherapy-resistant cell models. Image created in https://BioRender.com

References

    1. Sung H, Ferlay J, Siegel RL, Laversanne M, Soerjomataram I, Jemal A, et al. Global Cancer statistics 2020: GLOBOCAN estimates of incidence and mortality worldwide for 36 cancers in 185 countries. Cancer J Clin. 2021;71(3):209–49. Epub 2021/02/05. - PubMed
    1. Wagner AD, Syn NL, Moehler M, Grothe W, Yong WP, Tai BC, et al. Chemotherapy for advanced gastric cancer. Cochrane Database Syst Rev. 2017;8(8):CD004064. Epub 2017/08/30. - PMC - PubMed
    1. Smyth EC, Nilsson M, Grabsch HI, van Grieken NC, Lordick F. Gastric cancer. Lancet. 2020;396(10251):635–48. Epub 2020/08/31. - PubMed
    1. Van Cutsem E, Moiseyenko VM, Tjulandin S, Majlis A, Constenla M, Boni C, et al. Phase III study of docetaxel and cisplatin plus fluorouracil compared with cisplatin and fluorouracil as first-line therapy for advanced gastric cancer: a report of the V325 study group. J Clin Oncology: Official J Am Soc Clin Oncol. 2006;24(31):4991–7. Epub 2006/11/01. - PubMed
    1. Wilke H, Muro K, Van Cutsem E, Oh SC, Bodoky G, Shimada Y, et al. Ramucirumab plus Paclitaxel versus placebo plus Paclitaxel in patients with previously treated advanced gastric or gastro-oesophageal junction adenocarcinoma (RAINBOW): a double-blind, randomised phase 3 trial. Lancet Oncol. 2014;15(11):1224–35. Epub 2014/09/23. - PubMed