Observational Study
. 2025 Jul 15;17(1):78.
doi: 10.1186/s13073-025-01508-7.

The dynamics of the gut microbiota in prediabetes during a four-year follow-up among European patients-an IMI-DIRECT prospective study

Affiliations
Observational Study

The dynamics of the gut microbiota in prediabetes during a four-year follow-up among European patients-an IMI-DIRECT prospective study

Liwei Lyu et al. Genome Med. .

Abstract

Background: Previous case-control studies have reported aberrations of the gut microbiota in individuals with prediabetes. The primary objective of the present study was to explore the dynamics of the gut microbiota of individuals with prediabetes over 4 years with a secondary aim of relating microbiota dynamics to temporal changes of metabolic phenotypes.

Methods: The study included 486 European patients with prediabetes. Gut microbiota profiling was conducted using shotgun metagenomic sequencing and the same bioinformatics pipelines at study baseline and after 4 years. The same phenotyping protocols and core laboratory analyses were applied at the two timepoints. Phenotyping included anthropometrics and measurement of fasting plasma glucose and insulin levels, mean plasma glucose and insulin under an oral glucose tolerance test (OGTT), 2-h plasma glucose after an OGTT, oral glucose insulin sensitivity index, Matsuda insulin sensitivity index, body mass index, waist circumference, and systolic and diastolic blood pressure. Measures of the dynamics of bacterial microbiota were related to concomitant changes in markers of host metabolism.

Results: Over 4 years, significant declines in richness were observed in gut bacterial and viral species and microbial pathways accompanied by significant changes in the relative abundance and the genetic composition of multiple bacterial species. Additionally, bacterial-viral interactions diminished over time. Despite the overall reduction in bacterial richness and microbial pathway richness, 80 dominant core bacterial species and 78 core microbial pathways were identified at both timepoints in 99% of the individuals, representing a resilient component of the gut microbiota. Over the same period, individuals with prediabetes exhibited a significant increase in glycemia and insulinemia alongside a significant decline in insulin sensitivity. Estimates of the gut bacterial microbiota dynamics were significantly correlated with temporal impairments in host metabolic health.

Conclusions: In this 4-year prospective study of European patients with prediabetes, the gut microbiota exhibited major changes in taxonomic composition, bacterial species genetics, and microbial functional potentials, many of which paralleled an aggravation of host metabolism. Whether the temporal gut microbiota changes represent an adaptation to the progression of metabolic abnormalities or actively contribute to these in prediabetes cases remains unsettled.

Trial registration: The Diabetes Research on Patient Stratification (DIRECT) study, an exploratory observational study initiated on October 15, 2012, was registered on ClinicalTrials.gov under the number NCT03814915.

Keywords: Gut bacterial genetics; Gut bacterial microbiota; Gut viral microbiota; Insulin sensitivity; Long-term dynamics; Metabolism; Microbial functional pathways; Prediabetes.


Conflict of interest statement

Declarations. Ethics approval and consent to participate.: The DIRECT study (Diabetes Research on Patient Stratification) was registered under ClinicalTrials.gov ID NCT03814915. Approval of the study protocol was obtained from each of the regional research ethics review boards separately: Lund, Sweden: 20130312105459927; Copenhagen, Denmark: H-1–2012-166 and H-1–2012-100; Amsterdam, the Netherlands: NL40099.029.12; Newcastle, Dundee, and Exeter, UK: 12/NE/0132. All participants gave written informed consent to participate in the study at enrollment and the research conformed to the ethical principles for medical research involving human participants outlined in the Declaration of Helsinki. Consent for publication: Not applicable. Competing interests: RK has received consulting fees from Novo Nordisk; he was also funded by a STAR Award Novo Nordisk co-financed PhD fellowship and a Novo Nordisk Foundation postdoctoral fellowship (NNF18OC0031650). PWF has received research funding from Boehringer Ingelheim, Eli Lilly, Janssen, Novo Nordisk A/S, Sanofi Aventis and Servier, received consulting fees from Eli Lilly, Novo Nordisk and Zoe Global Ltd and has stock options in Zoe Global Ltd. HR is an employee of Boehringer Ingelheim and a shareholder of Sanofi Aventis. MMcC declares that the views expressed in this article are those of the authors and not necessarily those of the NHS, the NIHR, or the Department of Health; he has served on advisory panels for Pfizer, Novo Nordisk and Zoe Global, has received honoraria from Merck, Pfizer, Novo Nordisk and Eli Lilly, and research funding from Abbvie, Astra Zeneca, Boehringer Ingelheim, Eli Lilly, Janssen, Merck, Novo Nordisk, Pfizer, Roche, Sanofi Aventis, Servier, and Takeda; as of June 2019, he is an employee of Genentech, and a holder of Roche stock. BJ and PBM are employees of Sanofi Deutschland GmbH. IP is employed by Eli Lilly Regional Operations GmbH. HR is an employee of Boehringer Ingelheim International GmbH. MR is employed by Novo Nordisk A/S. OP and YF are co-founders of GutCRINE. The remaining authors declare that they have no competing interests.

Figures

Fig. 1
Fig. 1
Overview of study materials, methods, and major study outcomes. The figure is created with biorender.com
Fig. 2
Fig. 2
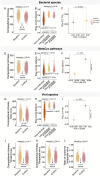
Temporal changes of gut microbial features between study baseline and endline. A, D, and G show the compositional richness of gut bacterial species, microbial pathways, and viral species, respectively, at study baseline and study endline. B, E, and H display the intra- and inter-individual Bray–Curtis distances of gut bacterial species, microbial pathways, and viral species, respectively. The dots in brown, yellow, or pink colors show the Bray–Curtis distances derived from the relative abundance of gut bacterial species, microbial pathways, or viral species, respectively, illustrating variability within and between individuals at study baseline and study endline. In C, F, and I, the principal coordinate analysis (PCoA) of overall composition of gut bacterial species, microbial pathways, and viral species, respectively, based on Bray–Curtis dissimilarity matrix, are shown. Yellow and pink dots represent the mean PCo1 and PCo2 coordinates for all study baseline and study endline samples with error bars indicating the standard error of the mean (SEM). JL Changes in the compositional richness of temperate and virulent viruses, as well as the ratio of virulent to temperate viral species, respectively, from study baseline to endline. All adjusted p values were derived from p values corrected for multiple comparisons using the Benjamini–Hochberg method. The compositional richness and Bray–Curtis distance are expressed in arbitrary units
Fig. 3
Fig. 3
Relationships between temporal changes of bacterial species richness and temporal changes of host metabolic variables. This bar plot illustrates the delta associations, referring to the relationship between changes in bacterial species richness and host metabolic variables over time, as determined by partial Spearman’s correlation analyses adjusting for baseline age, sex, study centers, and bacterial cell load. The x-axis shows the strength of the associations by partial Spearman’s correlation coefficient values, with orange bars indicating positive correlation coefficients (aligned co-variation) and green bars indicating negative correlation coefficients (counter co-variation). The y-axis lists the host metabolic variables. OGTT means oral glucose tolerance test. Significance levels are denoted as * for adjusted p values < 0.1 derived from p values corrected for multiple comparisons using the Benjamini–Hochberg method
Fig. 4
Fig. 4
Gut bacterial genetics stability within the individual and between individuals. To evaluate the dynamics of bacterial genetics within bacterial species over time and between individuals, we calculated intra-individual and inter-individual distance for each species from their structural variant (SV) profiles. A Profiles of Jaccard distance of deletion structural variants (dSVs) and B profiles of Canberra distance of variable structural variants (vSVs) of 39 bacterial species. Degree of microbial individuality (DMI) was labeled. Each box plot represents the distance calculated from the genetic structural variant profiles within one bacterial species (see Methods), with light-colored boxes indicating intra-individual distances, while dark-colored boxes are showing inter-individual distances. Bacterial species are listed along the y-axis in descending order based on their DMI values. Distances are displayed on the x-axis
Fig. 5
Fig. 5
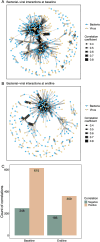
Gut bacterial-viral interactions at study baseline and endline. The interaction network of bacterial and viral microbiota at the species level at study baseline (A) and study endline (B) was constructed using SparCC (sparse correlations for compositional data). A more dispersed and sparser network was observed at study endline (B) compared that at study baseline (A). Interactions with absolute value of correlation coefficient > 0.3 are shown in the network. Each edge in the network represents an interaction between a pair of taxa with edge thickness reflecting the absolute value of the correlation coefficient. Bacterial species and viral species are shown as blue or yellow nodes, respectively. C Bar plot showing the counts of positive or negative bacterial-viral interactions that decline at study endline compared to that at study baseline, with a more pronounced reduction observed in positive mutualistic relationships
Fig. 6
Fig. 6
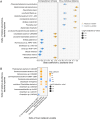
Associations of temporal changes of the relative abundance of bacterial species and temporal changes in gut bacterial community indices or host metabolic variables. A Correlations between temporal changes of the relative abundance of bacterial species and temporal shifts in overall gut bacterial species richness and intra-individual distance of bacterial species abundance profiles, highlighting the bacterial species that are driving the community changes. The y-axis lists bacterial species, and the x-axis shows the beta coefficient and standard error values calculated from linear regression models. The figure includes the top 10 bacterial species, ranked in ascending order by adjusted p value. The dots are colored yellow and blue for positive and negative coefficient values, respectively. Dots size indicates the − log10 (adjusted p value) of the correlation, with larger dots showing smaller adjusted p value. B Correlations between temporal changes in relative abundance of bacterial species and temporal changes of host metabolic variables, highlighting changes in relative abundance of bacterial species with parallel changes in host metabolism. Y-axis lists bacterial species, while x-axis lists host metabolic variable. The dots are colored yellow for positive coefficient values and blue for negative coefficient values with color intensity indicating the effect size. Dots size indicates the − log10 (adjusted p value) of the correlation, with larger dots showing smaller adjusted p value. In A and B, beta coefficients and adjusted p values were calculated from linear regression models after adjusting for co-variates of individual’s age at baseline, sex, study centers, and delta value of bacterial cell load. All correlations shown are statistically significant after adjustment for multiple comparisons using the Benjamin-Hochberg procedure, with adjusted p value < 0.1. OGTT means oral glucose tolerance test
Fig. 7
Fig. 7
Correlations between gut bacterial structural variants and host metabolic variables. A Temporal associations between changes in profiles of bacterial genetics (shown by intra-individual distance within bacterial species) and changes in host metabolic variables. The y-axis lists bacterial species, and the x-axis displays delta values of host metabolic variables. Dots are shaped by types of structural variants (circle for deletion structural variants (dSVs) and square for variable structural variants (vSVs)), colored based on beta coefficient values, and sized according to − log10 (adjusted p value). Beta coefficients and adjusted p values were calculated from linear regression models after adjusting for co-variates of individual’s age at baseline, sex, study centers, and delta value of bacterial cell load. B and C Scatter plots showing selected examples of the temporal association results in A. B Temporal associations between the delta values of diastolic blood pressure and the intra-individual Canberra distance calculated from the profile of 19 vSVs within the Methanobrevibacter smithii genome, and C temporal associations between the delta values of fasting plasma glucose and the intra-individual Jaccard distance calculated from the profiles of 81 dSVs within the Ruminococcus sp. SR1/5 genome. Each dot represents an individual participant. D A circular chord diagram illustrating the associations between specific gut bacterial species (right side) and host phenotypes (left side) categorized by SV types, either dSVs or vSVs, summarizing the links between single SVs and host phenotypes. Each bacterial species is labeled with its name and the count of associated SVs in parentheses, with the color of each link and species label showing the variant type involved (green for dSVs; purple for vSVs). The width of each link reflects the count of associated SVs. Beta coefficients and adjusted p values were calculated from linear mixed-effects models after adjusting for co-variates of individual’s age, sex, study center, and bacterial cell load. E and F Bar plots showing selected examples of association results given in D. E Comparison of Matsuda insulin sensitivity index values in samples retaining (n = 105) or deleting (n = 111) gene fragments of 50–52 kbp in Prevotella copri, predicted to encode a TonB-dependent receptor protein. F Comparison of fasting plasma insulin in samples where gene fragments 1101–1102 and 3414–3415 kbp in Coprococcus catus are retained (n = 486) or deleted (n = 13). The encoding protein is predicted as hydrogenases. Statistical significance from linear mixed-effects model was labeled. All correlations shown are statistically significant after adjustment for multiple comparisons using the Benjamin-Hochberg procedure, with adjusted p value < 0.1. OGTT means oral glucose tolerance test
Fig. 8
Fig. 8
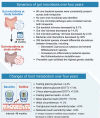
Summary of temporal changes in host metabolism and gut microbiota dynamics in prediabetes over 4-year follow-up. Created with biorender.com

References

    1. American Diabetes Association. 2. Classification and diagnosis of diabetes. Diabetes Care. 2016;40:S11-24. - PubMed
    1. Rooney MR, Fang M, Ogurtsova K, Ozkan B, Echouffo-Tcheugui JB, Boyko EJ, et al. Global prevalence of prediabetes. Diabetes Care. 2023;46:1388–94. - PMC - PubMed
    1. Tabák AG, Herder C, Rathmann W, Brunner EJ, Kivimäki M. Prediabetes: a high-risk state for diabetes development. Lancet. 2012;379:2279–90. - PMC - PubMed
    1. Allin KH, Tremaroli V, Caesar R, Jensen BAH, Damgaard MTF, Bahl MI, et al. Aberrant intestinal microbiota in individuals with prediabetes. Diabetologia. 2018;61:810–20. - PMC - PubMed
    1. Gravdal K, Kirste KH, Grzelak K, Kirubakaran GT, Leissner P, Saliou A, et al. Exploring the gut microbiota in patients with pre-diabetes and treatment naïve diabetes type 2 - a pilot study. BMC Endocr Disord. 2023;23:179. - PMC - PubMed

Publication types

Associated data