

Microdosimetry calculations in situ for clinically relevant photon sources and their correlation with the early DNA damage response
- PMID: 40665605
- PMCID: PMC12272329
- DOI: 10.1002/mp.17979
Microdosimetry calculations in situ for clinically relevant photon sources and their correlation with the early DNA damage response
Abstract
Background: Radiobiological data suggests variations in relative biological effectiveness (RBE) between clinically used photon-based sources. A microdosimetric formalism using Monte Carlo (MC) methods can mechanistically describe the photon RBE. Experimentally derived RBE based on DNA double-strand breaks ( ) has been shown to scale with the microdosimetry quantity dose-mean lineal energy ( ).
Purpose: To calculate microdosimetric spectra for clinically relevant photon sources, spanning from soft x-rays produced by a 50 kVp x-ray source through various brachytherapy sources up to a 6 MV medical linac. Furthermore, we investigated the correlation between and of different photon sources.
Methods: Photon sources simulated include low-energy x-rays (50 kVp), orthovoltage x-rays (225 kVp), high-dose-rate brachytherapy sources (75Se, 192Ir and 60Co), and a 6 MV medical linac. Secondary electron spectra at the cellular level were calculated for in vitro cell irradiation setups using Geant4 MC-based packages, RapidBrachyMCTPS and RapidExternalBeam. The obtained spectra were used in MicroDose, a microdosimetry simulation software, to obtain microdosimetric quantities, including single-event lineal energy ( ) and specific energy ( ) spectra, and dose-mean and frequency-mean quantities ( , , , ). Uniform spherical targets (1-14 radius) and realistic HeLa and PC3 cell nucleus models were simulated using cell size data obtained from literature and nuclei size data from confocal microscopy imaging. Radiobiological experiments using foci quantified DNA double-strand breaks for HeLa and PC3 cells after irradiations with 50 and 225 kVp, 192Ir, and 6 MV linac, and was determined using 225 kVp as the reference.
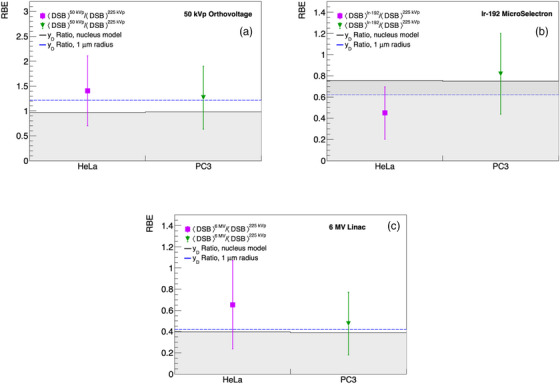
Results: The calculated ( ) is within the 3.5-1.2 keV/ range (1.8-0.2 keV/ ) for 1 simulated target size between the lowest energy 50 kVp x-ray source and the highest energy 6 MV linac source, respectively. For the HeLa and PC3 cell nuclei models based on microscopy data, ( ) spans from 1.6 to 0.6 keV/ (0.7 to 0.2 keV/ ). When compared between different target sizes, ( ) ranges from 3.5 to 1.0 (1.8-0.4) keV/ between 1 and 10 radius targets for the 50 kVp x-ray source. A smaller change is observed for 6 MV linac, ranging from 1.2 to 0.5 keV/ and 0.23 to 0.22 keV/ for and , respectively. For the simulated 75Se source currently under investigation, the calculated values are 11%-24% higher relative to those of 192Ir in the range of target sizes between 1 and 14 in radius. for HeLa cells was 1.4 0.7 for 50 kVp x-rays, 0.5 0.2 for 192Ir, and 0.7 0.4 for 6 MV linac irradiations. For PC3 cells, was 1.3 0.6, 0.8 0.4 and 0.5 0.3 for 50 kVp, 192Ir and 6 MV linac, respectively. Measured values are consistent with ratios of the corresponding photon sources for HeLa and PC3 nucleus models.
Conclusions: Microdosimetric spectra strongly depend on the simulated energy of photon sources and target size, with and decreasing by a factor of 2-3 between diagnostic 50 kVp and 6 MV therapeutic x-rays for target sizes from 1-14 in radius. The early damage indicates this stochastic change in energy density between various photon sources as the yields of foci per nucleus scale with of the source.
Keywords: double‐strand breaks; microdosimetry; multiscale dosimetry; relative biological effectiveness.
© 2025 American Association of Physicists in Medicine.
Conflict of interest statement
The authors have no relevant conflicts of interest to disclose.
Figures


Similar articles
-
Entry skin dose reduction in an inline MRI-linac using an electron contamination deflector coupled with a helium volume.Med Phys. 2025 Jul;52(7):e17923. doi: 10.1002/mp.17923. Med Phys. 2025. PMID: 40665620 Free PMC article.
-
Radiotherapeutic efficacy of gold nanoparticles for high dose-rate brachytherapy compared to conventional radiotherapy: An in vitro study.Med Phys. 2025 Jul;52(7):e18006. doi: 10.1002/mp.18006. Med Phys. 2025. PMID: 40665548 Free PMC article.
-
Microdosimetric evaluation of a clinical carbon ion beam using a tissue-equivalent proportional counter.Phys Med Biol. 2025 Jul 18;70(14). doi: 10.1088/1361-6560/adeb3e. Phys Med Biol. 2025. PMID: 40602421
-
Portion, package or tableware size for changing selection and consumption of food, alcohol and tobacco.Cochrane Database Syst Rev. 2015 Sep 14;2015(9):CD011045. doi: 10.1002/14651858.CD011045.pub2. Cochrane Database Syst Rev. 2015. PMID: 26368271 Free PMC article.
-
Management of urinary stones by experts in stone disease (ESD 2025).Arch Ital Urol Androl. 2025 Jun 30;97(2):14085. doi: 10.4081/aiua.2025.14085. Epub 2025 Jun 30. Arch Ital Urol Androl. 2025. PMID: 40583613 Review.
References
-
- Beyreuther E, Lessmann E, Pawelke J, Pieck S. DNA double‐strand break signalling: x‐ray energy dependence of residual co‐localised foci of gamma‐H2AX and 53BP1. Int J Radiat Biol. 2009;85(11):1042‐50. - PubMed
-
- Nikjoo H, Lindborg L. RBE of low energy electrons and photons. Phys Med Biol. 2010;55(10):R65. - PubMed
-
- Hill MA. The variation in biological effectiveness of x‐rays and gamma rays with energy. Radiat Prot Dosim. 2004;112(4):471‐481. - PubMed
-
- Li J, Chabaytah N, Babik J, et al. Relative biological effectiveness of clinically relevant photon energies for the survival of human colorectal, cervical, and prostate cancer cell lines. Phys Med Biol. 2024;69(20):205008. - PubMed
-
- Kocher DC, Hoffman FO. NCRP Report 181, Evaluation of the relative effectiveness of low‐energy photons and electrons in inducing cancer in humans: a critique and alternative analysis. Health Phys. 2019;116(6):817‐827. - PubMed
MeSH terms
Grants and funding
LinkOut - more resources
Full Text Sources
