

Genome-wide identification of MYBL2 in Brassicaceae, with a focus on the expression pattern of regulating anthocyanin synthesis in Brassica crops
- PMID: 40666295
- PMCID: PMC12259598
- DOI: 10.3389/fpls.2025.1629560
Genome-wide identification of MYBL2 in Brassicaceae, with a focus on the expression pattern of regulating anthocyanin synthesis in Brassica crops
Abstract
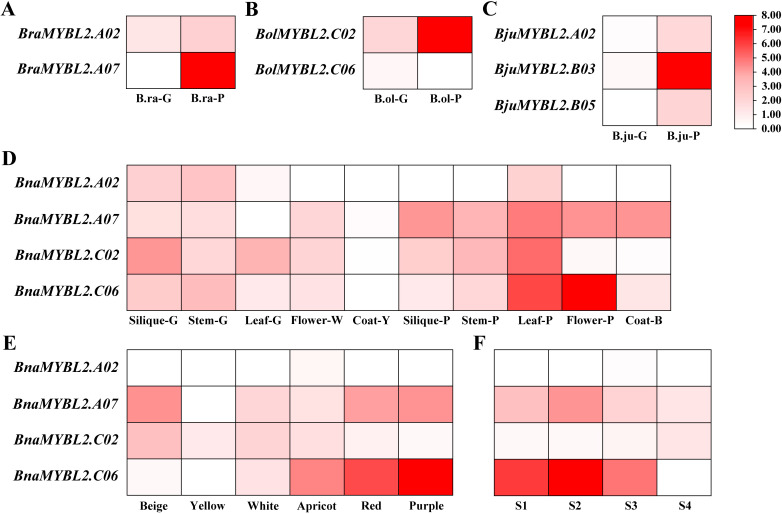
The Brassicaceae family includes the model plant Arabidopsis thaliana, along with various vegetables and oil crops, which possess significant economic and scientific value. Notably, three diploid species within the U's Triangle of Brassica have undergone natural hybridization, resulting in the formation of three allotetraploid species, which provides an excellent model for investigating the phylogenetic, evolutionary, and functional differentiation of plant homologous genes. In this study, we systematically identified MYBL2 homologous genes within the 31 Brassicaceae species, with a total of 48 homologous genes identified from 30 species, and phylogenetic analysis revealed the presence of six subfamilies, Ka/Ks analysis showed that only 10 MYBL2 homologous gene were positively selected during evolution. We subsequently concentrated on the evolution, gene structure, and conserved domain analysis of 16 MYBL2 homologous genes across six Brassica crops found in U's Triangle. Our findings indicated that these 16 MYBL2 homologous genes predominantly clustered into two branches and exhibited a high degree of evolutionary conservation. Further RNA-seq analysis of various tissues and organs from Brassica crops demonstrated that MYBL2 homologous genes were significantly up-regulated in tissues with anthocyanin accumulation. Concurrently, we employed Weighted Gene Co-expression Network Analysis (WGCNA) to identify hub genes regulated by anthocyanin in different tissues of B. napus, revealing that BnaMYBL2.C06 exhibited a strong repressor with anthocyanin biosynthetic genes (ABGs) in petals. Finally, quantitative reverse transcription PCR (qRT-PCR) analysis of B. napus leaves, stems, and petals indicated that four MYBL2 homologous genes were significantly up-regulated in leaves and petals, with expression patterns consistent with those of ABGs. Our results contribute new insights into the transcriptional regulatory mechanisms of anthocyanin in Brassica crops.
Keywords: Brassica crops; Brassicaceae; MYBL2; anthocyanins; expression pattern.
Copyright © 2025 Wang, Zhang, Liu, Shen, Wan, Chen, Tan and Chen.
Conflict of interest statement
The authors declare that the research was conducted in the absence of any commercial or financial relationships that could be constructed as a potential conflict of interest.
Figures


Similar articles
-
Genome-wide identification and evolutionary analysis of the NRAMP gene family in the AC genomes of Brassica species.BMC Plant Biol. 2024 Apr 23;24(1):311. doi: 10.1186/s12870-024-04981-1. BMC Plant Biol. 2024. PMID: 38649805 Free PMC article.
-
Systematic identification of R2R3-MYB S6 subfamily genes in Brassicaceae and its role in anthocyanin biosynthesis in Brassica crops.BMC Plant Biol. 2025 Mar 6;25(1):290. doi: 10.1186/s12870-025-06296-1. BMC Plant Biol. 2025. PMID: 40045187 Free PMC article.
-
Combined Multi-Omics and Co-Expression Network Analyses Uncover the Pigment Accumulation Mechanism of Orange-Red Petals in Brassica napus L.Biology (Basel). 2025 Jun 13;14(6):693. doi: 10.3390/biology14060693. Biology (Basel). 2025. PMID: 40563944 Free PMC article.
-
Sertindole for schizophrenia.Cochrane Database Syst Rev. 2005 Jul 20;2005(3):CD001715. doi: 10.1002/14651858.CD001715.pub2. Cochrane Database Syst Rev. 2005. PMID: 16034864 Free PMC article.
-
Systemic pharmacological treatments for chronic plaque psoriasis: a network meta-analysis.Cochrane Database Syst Rev. 2021 Apr 19;4(4):CD011535. doi: 10.1002/14651858.CD011535.pub4. Cochrane Database Syst Rev. 2021. Update in: Cochrane Database Syst Rev. 2022 May 23;5:CD011535. doi: 10.1002/14651858.CD011535.pub5. PMID: 33871055 Free PMC article. Updated.
References
LinkOut - more resources
Full Text Sources