[Preprint]. 2025 Jun 23:2025.06.22.25329156.
doi: 10.1101/2025.06.22.25329156.

Genomic characterization of normal and aberrant human milk production

Affiliations

Genomic characterization of normal and aberrant human milk production

Yarden Golan et al. medRxiv. .

Update in

Abstract

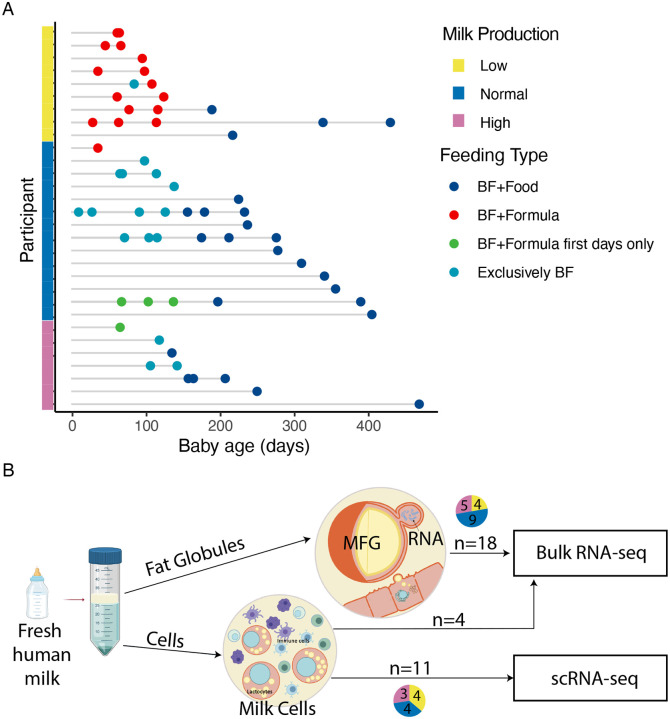
Breastfeeding is essential for reducing infant morbidity and mortality, yet exclusive breastfeeding rates remain low, often due to insufficient milk supply. The molecular causes of low milk production are not well understood. Fresh milk samples from 30 lactating individuals, classified by milk production levels across postpartum stages, were analyzed using genomic and microbiome techniques. Bulk RNA sequencing of milk fat globules (MFG), milk cells, and breast tissue revealed that MFG-derived RNA closely mirrors luminal milk cells. Transcriptomic and single-cell RNA analyses identified changes in gene expression and cellular composition, highlighting key genes (GLP1R, PLIN4, KLF10) and cell-type differences between low and high producers. Infant microbiome diversity was influenced by feeding type but not maternal milk supply. This study provides a comprehensive human milk transcriptomic catalog and highlights that MFG could serve as a useful biomarker for milk transcriptome analysis, offering insights into the genetic factors influencing milk production.


Conflict of interest statement

Competing interests: BEE is on the Scientific Advisory Board for ArrePath Inc, Crayon Bio, and Freenome; she consults for Neumora. SKN reports compensation for consulting services with Radera Biosciences. All other authors declare that they have no competing interests.

Figures

Fig. 1.
Fig. 1.. Samples and milk fractions used in this study.
(A) Graph showing the samples used in the study, their categorization into milk production groups, lactation stage, and infant feeding type (BF = breastfeeding) at the time of sample collection. (B) Schematic showing the milk fraction observed after centrifugation of fresh milk samples (milk fat globules (MFG) at the top and milk cells at the bottom) and the experiments carried out on them.
Fig. 2:
Fig. 2:. Transcriptomic comparison between MFG, milk cells and non-lactating mammary gland tissue.
(A) Volcano plot showing RNA-seq differentially expressed (DE) genes between milk cells (left side) and MFG (right side) as detected by DESeq2(51). A log-fold change >1 cutoff and BH adjusted p-value<0.05 was used. (B-C) Gene Ontology Biological Process (GOBP) pathway analysis(48) of DE genes from (A) including pathways upregulated in milk cells (B) and in MFG (C). (D) Volcano plot of DE genes comparing milk cells (left side) and non-lactational breast tissue (right side). (E) Corresponding GOBP pathway analysis of DE genes up in milk cells from (D) (right side). (F) Volcano plot of DE genes between MFG (left side) and non-lactational breast tissue (right side). (G) Corresponding GOBP pathway analysis of DE genes up in MFG from (F) (right side). (H) Dot plot of the fold change of the DE genes from (D) and (G) showing similarity in gene expression between milk cells and MFG compared to breast tissue (blue) and DE genes in cells (red) or MFG (green). Full gene and GOBP lists in Table S2. Gene ratio is the ratio of input genes that are annotated in a term (pathway of genes).
Fig. 3:
Fig. 3:. The MFG transcriptome is more similar to the epithelial subcluster LC2 compare to LC1.
(A) UMAP low dimensional visualization of scRNA-seq data colored by cell type cluster. (B) BisqueRNA package (52) was used to deconvolve bulk transcriptomes from MFG into component cell type proportions as a proxy for cell type. Cells proportion as represent in MFG RNA transcript (y-axis) was calculated for each participant (x-axis). (C) Bar chart showing the numbers and the overlap of DE genes between milk cells, MFG, and non-lactational breast tissue. Upper bars indicate intersection size between sets indicated by dark dots below, left horizontal bars indicate size of each set of genes. (D) Violin plot of the gene set signature score (see Methods), calculated from genes upregulated in MFG compared to milk cells in bulk RNA sequencing (highlighted in yellow in (B)). The score is plotted for each cell across the cell types identified in scRNA-seq data (x-axis). (E) Genes associated with MFG formation in the LC1 and LC2 epithelial clusters. Dot size represents the percentage of cells in cluster (y-axis) expressing the gene at a level > 0 and color indicates the mean log2-normalized expression of that gene in the cells of that cluster.
Fig. 4:
Fig. 4:. Transcriptomic changes in low and high milk production.
(A) Volcano plot of DE genes between individuals with high (n=3) and normal (n=7) milk production (log-fold change logFC > 1 and BH adjusted p < 0.05). (B) Volcano plot of DE genes between individuals with low (n=4) and normal (n=7) milk production (logFC > 1 and adjusted p < 0.05). (C) Heatmap showing DE with log2foldchange > 2.5 genes between the different milk production groups colored by column-standardized gene expression. (D) qRT-PCR results for 39 MFG RNA samples at different time points postpartum. The y-axis represents the fold change in gene expression from the mean of normal producers normalized to GAPDH expression. A linear mixed effect model was used to determine differences in gene expression between milk production groups, controlling for days postpartum. Lines represent the fixed-effect regression with confidence intervals.
Fig. 5:
Fig. 5:. Cellular composition changes in the different milk production groups.
(A) proportion of cells in each sample as revealed from scRNA-seq. (B) ratio of LC1 and LC2 subtype proportion for each sample divided into groups based on milk production. (*credible effect of difference using scCODA differential abundance) (C) Proportion of epithelial subclusters in each sample. (D) Milk fat content in samples from each milk production level. (E) Scatter plot of fat content in each sample compared to the proportion of LC2-C cells among other epithelial cells. Spearman correlation r = 0.775, p ≤ 0.03. (F) DE genes in the LC2 clustered between low, normal, and high milk producers. Dot size represents the percentage of cells in a cluster (y-axis) expressing the gene at a level > 0 and color indicates the mean log2-normalized expression of that gene in the cells in that cluster.
Fig. 6:
Fig. 6:. Transcriptional changes in production groups originate primarily from LC2 cells and macrophages.
(A) Proportion of immune cells in each sample. (B) DE genes in the macrophages cluster between low, normal, and high milk producers. Dot size represents percentage of cells in cluster (y-axis) expressing the gene at a level > 0 and color indicates the mean log2-normalized expression of that gene in the cells in that cluster. (C) Mean gene set scores of Hallmark TNF-a signaling pathway in macrophage cells per sample in the different milk production groups computed using Scanpy gene scoring.
Fig. 7.
Fig. 7.. Characterization of the maternal and infant gut microbiome from different milk production groups.
(A) Infant gut microbiome samples were grouped using k-means clustering with k=3. The samples are color-coded by their dominant bacteria, with point shapes indicating maternal milk supply (circles for low and triangles for normal milk production) and point sizes representing the Shannon diversity of each sample. (B) Shannon diversity in infant and maternal stool samples from this cohort (including only samples up to 150 days) is shown. Points are colored according to the infant feeding type at the time of sampling.

References

    1. Meek J. Y., Noble L., Section on Breastfeeding, Policy Statement: Breastfeeding and the Use of Human Milk. Pediatrics 150 (2022). - PubMed
    1. Breastfeeding. https://www.who.int/health-topics/breastfeeding.
    1. Breastfeeding, UNICEF DATA (2021). https://data.unicef.org/topic/nutrition/breastfeeding/.
    1. CDC, Results: Breastfeeding rates, Centers for Disease Control and Prevention; (2023). https://www.cdc.gov/breastfeeding/data/nis_data/results.html.
    1. Gatti L., Maternal perceptions of insufficient milk supply in breastfeeding. J. Nurs. Scholarsh. 40, 355–363 (2008). - PMC - PubMed

Publication types