

The implications of abnormal signal patterns of break-apart FISH probes used in the diagnosis of bone and soft tissue tumours
- PMID: 40666501
- PMCID: PMC12259478
- DOI: 10.3389/pore.2025.1612142
The implications of abnormal signal patterns of break-apart FISH probes used in the diagnosis of bone and soft tissue tumours
Abstract
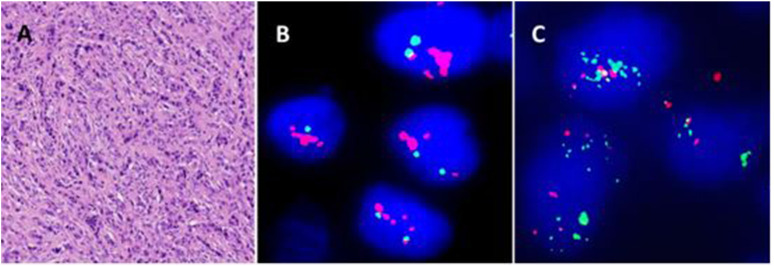
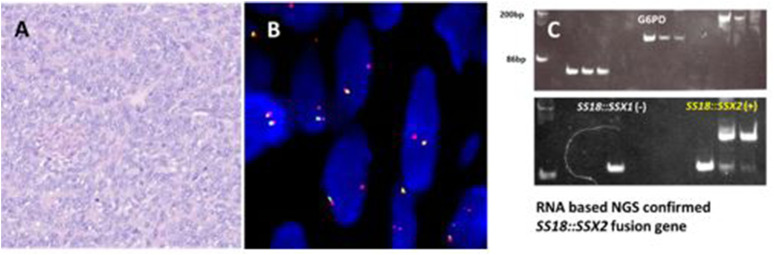
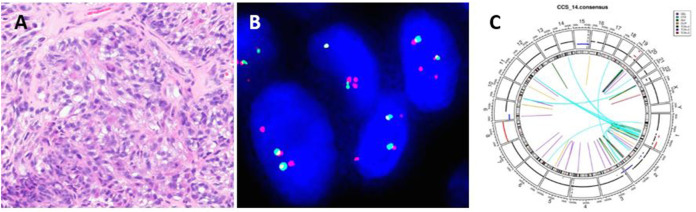
Many subtypes of bone and soft tissue tumours harbour specific chromosome translocations leading to chimeric fusion genes. The identification of these specific fusion genes is the basis of molecular diagnoses in such tumours. Break-apart FISH is a robust method that is commonly used to identify these translocations and provide diagnostic support to histological interpretations. The signal patterns of the break-apart probes are usually easily interpreted. However, some cases show abnormal signal patterns leading to equivocal and challenging interpretation. The incidence of these abnormal patterns is largely unknown. Using a retrospective cohort we explored the incidence of abnormal signal patterns across common bone and soft tissue tumour types to raise awareness of this occurrence and to aid in the interpretation. In total, 1,087 bone and soft tissue tumours tested by break-apart probes were examined. The abnormal signal patterns were classified as deletion, additional copy and amplification, which were found at highest frequency in low-grade fibromyxoid sarcoma (32%, 6/19), and at moderate frequencies in those from alveolar rhabdomyosarcoma (10%, 9/94), nodular fasciitis (9%, 18/209), synovial sarcoma (8%, 17/207) and Ewing sarcoma/round cell sarcoma with EWSR1-non-ETS fusions (6%, 29/497). The lowest frequency was found in clear cell sarcoma (1%, 1/61). Despite the equivocal results from the abnormal signal patterns, the specific fusion genes were confirmed by orthogonal molecular techniques such as FISH with fusion probes, RT-PCR or next-generation sequencing.
Keywords: FISH; abnormal signal pattern; bone and soft tissue tumour; break-apart probe; cancer; gene rearrangement; genomics; translocation.
Copyright © 2025 Ye, Berisha, Rowles, Munasinghe, Davies, Farswan and Pillay.
Conflict of interest statement
The authors declare that the research was conducted in the absence of any commercial or financial relationships that could be construed as a potential conflict of interest.
Figures


References
-
- The WHO Classification of Tumours Editorial Board, soft tissue and bone tumours (2020) 5th ed (Lyon: IARC; ).
-
- Amary FM, Berisha F, Bernardi FDC, Herbert A, James M, Reis-Filho S, et al. Detection of SS18-SSX fusion transcripts in formalin-fixed paraffin-embedded neoplasms: analysis of conventional RT-PCR, qRT-PCR and dual color FISH as diagnostic tools for synovial sarcoma. Mod Pathol (2007) 20(4):482–96. 10.1038/modpathol.3800761 - DOI - PubMed
MeSH terms
Substances
LinkOut - more resources
Full Text Sources
Medical