. 2025 Jul 1:16:1604452.
doi: 10.3389/fimmu.2025.1604452. eCollection 2025.

T-cell repertoire correlates with cytokine imbalance in multiple sclerosis patients

Affiliations

T-cell repertoire correlates with cytokine imbalance in multiple sclerosis patients

Lisa Weidner et al. Front Immunol. .

Abstract

Indroduction: Multiple sclerosis (MS) is mediated by innate and adaptive immune response deviation involving immune cells and cytokines. Here, we investigated whether combined cytokine profiling and T-cell receptor (TCR) repertoire analysis can better display the complex landscape of MS-driving immune responses.

Methods: We used advanced computational methods to systematically cluster highly variable individual levels of 48 cytokines in cerebrospinal fluid (CSF) and blood of 24 MS patients compared to that of nine controls. Relevant TCR sequences were compared to 88 healthy controls. We correlated cytokines with predominant shared TCR sequences to identify immune response networks.

Results: MS patients had significantly elevated MIP-1α and IP-10 levels in CSF, and additional 36 blood cytokines variably but significantly elevated. We identified 77 predominantly pro-inflammatory cytokine correlations in MS-CSF. TCR sequencing revealed more productive rearrangements in CSF of MS and a significantly higher shared clone recovery rate in blood. We found significant associations involving 492 unique sequences and 34 cytokines in blood. Particularly, the less significant individual cytokine deviations were found to contribute to a general Th1-biased type I immune response correlating with clonal expansion of T cells directed against EBV, CMV, and other infectious agents.

Discussion: Correlation of significantly altered T-cell repertoire with cytokine deviations in MS despite individual patient data variability indicates that future diagnostic strategies may need to address immune response patterns rather than individual protein targets.

Keywords: T cell repertoire; bioinformatics; cytokine imbalance; multiple sclerosis; neuroscience.


Conflict of interest statement

The authors declare that the research was conducted in the absence of any commercial or financial relationships that could be construed as a potential conflict of interest.

Figures
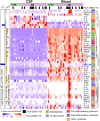
Figure 1
Figure 1
Differential cytokine expression pattern in CSF and blood of MS and control (CTRL) patients. Samples were sorted column-wise as indicated. HLA-DRB1*15:01 positive (+) patients are marked at the top with a black square. Cytokine expression levels were normalized row-wise using Z-score and clustered by Euclidian distance metrics. Violet/blue Z-score indicates lower and red indicates higher expression. Values shown in white were not detected. Cytokines were classified according to their predominant biological function as color-coded on the right (see Table 1 ). The dendrogram at the right indicates the degree of similarity in expression patterns by the length of the branches. Cytokines with more similar expression levels cluster together with shorter branch lengths. At the left y-axis, significant log2-fold differences between MS vs. CTRL in CSF (blue bars) and between CSF and blood sample types (orange bars), respectively, are shown. The scale on top left indicates the amplitude and the direction of the log2-fold change (Mann–Whitney U-test, adjusted p < 0.05).
Figure 2
Figure 2
Cytokine correlation. Significant correlations (absolute r > 0.6 and adjusted p < 0.05) between cytokines in MS and control patients for CSF and blood are depicted. Each node represents a cytokine connected by lines representing the significant correlation (red, positive correlation; blue, negative correlation). Line width reflects the correlation strength. Node color indicates growth factors, chemokines, and pro- vs. anti-inflammatory and other cytokines as shown. Nodes with higher transparency levels did not have any significant correlation.
Figure 3
Figure 3
Cytokine correlation network. The force-directed network (Fruchterman–Reingold algorithm) displays significant correlations (r > 0.6, adjusted p < 0.05) between cytokines. Each node represents a cytokine, and the lines represent significant correlation (red, positive correlation; blue, negative correlation). Node color indicates growth factors, chemokines, and pro- vs. anti-inflammatory and other cytokines as indicated. Line width reflects the correlation strength. Nodes with higher transparency levels and transparent text do not have any significant correlation. Clusters identified in MS patients are circled with dashed lines and numbered (1a–1d, 2, 3, and 4).
Figure 4
Figure 4
T-cell analysis. CSF data top, blood data lower row as indicated. (A, E) T-cell numbers, (B, F) productive templates and (C, G) maximum frequency (max. freq.) given in percent, and (D, H) Simpson clonality index obtained by T-cell receptor sequencing of CSF and blood from MS and control patients. Welch’s t-test *p < 0.05; ns, not significant; MS n = 22.
Figure 5
Figure 5
Shared and unique T-cell clones. Percentages of T-cell clones that are shared (red) or unique (blue) between both sources (A) in blood and (B) in CSF. MS patient and CTRL patient ID at the x-axis. HLA-DRB1*15:01–positive patients are marked at the top with a black square. Three patients whose blood was not available for TCR sequencing were excluded. Percentages of shared T-cell clones in (C) blood and (D) CSF. Percentages of shared T-cell clones in HLA-DRB1*15:01 positive (pos) vs. negative (neg) patients in (E) blood and (F) CSF. Unpaired T-test and Welch’s F-test revealed significant differences despite different sample size; *p = 0.0266, **p<0.005; ns, not significant.
Figure 6
Figure 6
T-cell receptor beta variable (TRBV) gene usage in blood and CSF of HLA-DRB1*15:01–positive and HLA-DRB1*15:01–negative patients. Box plots showing the relative proportions of TRBV gene usage in blood (top) and CSF (bottom) samples from HLA-DRB1*15:01–positive (purple boxes) compared to HLA-DRB1*15:01–negative patients (green boxes). No significant differences were found (Mann–Whitney U-test, Benjamini-Hochberg (BH) adjusted p < 0.05).
Figure 7
Figure 7
TCR CDR3 amino acid (aa) sequence clone count and cytokine paired correlations in MS patient’s blood. Dot chart illustrating correlation between TCR sequences (CDR3.aa log2-fold changes) and cytokine expression level in blood of MS patients. We selected 2,644 MS-”predominant” sequences found in at least five MS patients but not in controls (circles) or in both MS and control patients with at least ten-fold enrichment for the normalized clone count analysis in MS (diamonds). Each point represents a unique significant TCR sequence-cytokine pair (adjusted p < 0.05, Kendall rank correlation > 0.5). Symbol color indicates strength and direction of correlation as indicated in the legend and the size of each point reflects the log2-fold enrichment of normalized clone counts in MS patients compared to controls. Sequences that have significant correlation with more than two cytokines are shown above the chart. Red text color indicates the six sequences that have a 100% match in the McPAS database ( Table 3 ).

References

    1. Rodríguez Murúa S, Farez MF, Quintana FJ. The immune response in multiple sclerosis. Annu Rev Pathol. (2022) 17:121–39. doi: 10.1146/annurev-pathol-052920-040318 - DOI - PubMed
    1. Attfield KE, Jensen LT, Kaufmann M, Friese MA, Fugger L. The immunology of multiple sclerosis. Nat Rev Immunol. (2022) 22:734–50. doi: 10.1038/s41577-022-00718-z - DOI - PubMed
    1. Bjornevik K, Cortese M, Healy BC, Kuhle J, Mina MJ, Leng Y, et al. Longitudinal analysis reveals high prevalence of Epstein-Barr virus associated with multiple sclerosis. Science. (2022) 375:296–301. doi: 10.1126/science.abj8222 - DOI - PubMed
    1. Lanz TV, Brewer RC, Ho PP, Moon JS, Jude KM, Fernandez D, et al. Clonally expanded B cells in multiple sclerosis bind EBV EBNA1 and GlialCAM. Nature. (2022) 603:321–7. doi: 10.1038/s41586-022-04432-7 - DOI - PMC - PubMed
    1. Melamud MM, Ermakov EA, Boiko AS, Kamaeva DA, Sizikov AE, Ivanova SA, et al. Multiplex analysis of serum cytokine profiles in systemic lupus erythematosus and multiple sclerosis. Int J Mol Sci. (2022) 23:13829. doi: 10.3390/ijms232213829 - DOI - PMC - PubMed

LinkOut - more resources