[Preprint]. 2025 Jun 26:2025.06.21.660886.
doi: 10.1101/2025.06.21.660886.

Epigenetic Programming of Estrogen Receptor in Adipose Tissue by High Fat Diet Regulates Obesity-Induced Inflammation

Affiliations

Epigenetic Programming of Estrogen Receptor in Adipose Tissue by High Fat Diet Regulates Obesity-Induced Inflammation

Rui Wu et al. bioRxiv. .

Update in

Abstract

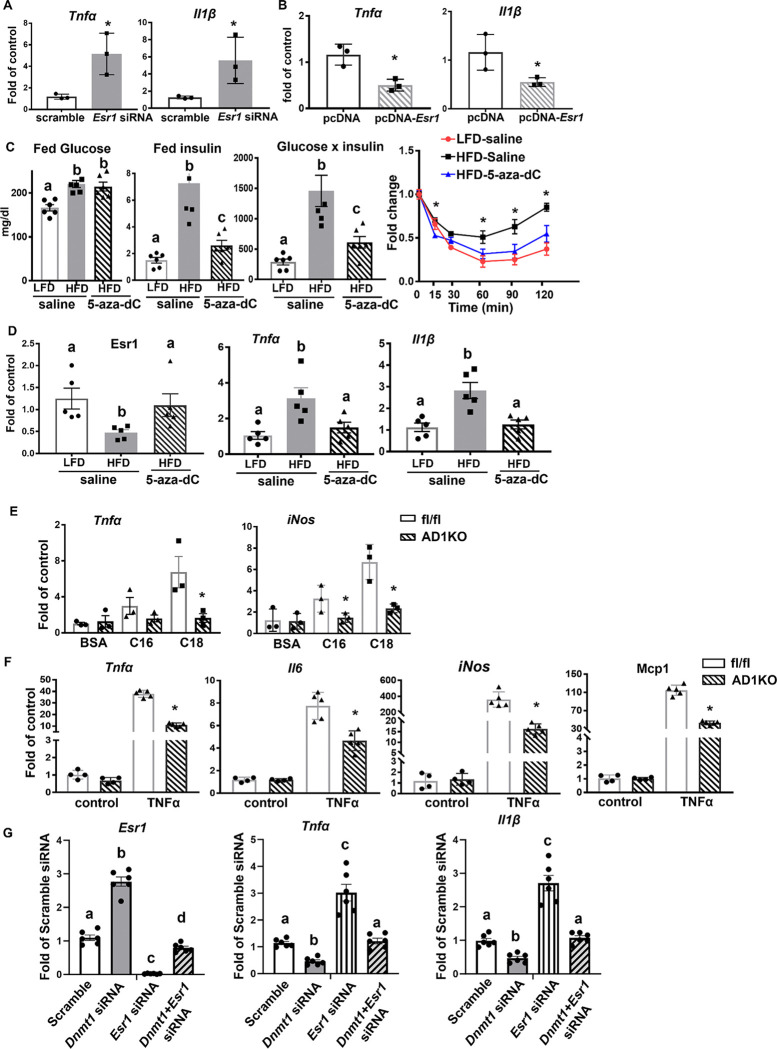
Adipose inflammation plays a key role in obesity-induced metabolic abnormalities. Epigenetic regulation, including DNA methylation, is a molecular link between environmental factors and complex diseases. Here we found that high fat diet (HFD) feeding induced a dynamic change of DNA methylome in mouse white adipose tissue (WAT) analyzed by reduced representative bisulfite sequencing. Interestingly, DNA methylation at the promoter of estrogen receptor α (Esr1) was significantly increased by HFD, concomitant with a down-regulation of Esr1 expression. HFD feeding in mice increased the expression of DNA methyltransferase 1 (Dnmt1) and Dnmt3a, and binding of DNMT1 and DNMT3a to Esr1 promoter in WAT. Mice with adipocyte-specific Dnmt1 deficiency displayed increased Esr1 expression, decreased adipose inflammation and improved insulin sensitivity upon HFD challenge; while mice with adipocyte-specific Dnmt3a deficiency showed a mild metabolic phenotype. Using a modified CRISPR/RNA-guided system to specifically target DNA methylation at the Esr1 promoter in WAT, we found that reducing DNA methylation at Esr1 promoter increased Esr1 expression, decreased adipose inflammation and improved insulin sensitivity in HFD-challenged mice. Our study demonstrates that DNA methylation at Esr1 promoter plays an important role in regulating adipose inflammation, which may contribute to obesity-induced insulin resistance.

Keywords: Adipose inflammation; DNA methylation; Estrogen receptor.


Conflict of interest statement

Conflicts of Interest: The authors have no conflict of interest to declare.

Figures

Figure 1.
Figure 1.. High fat diet (HFD) regulates Esr1 expression via promoter DNA methylation.
(A) Distribution of DMRs in the genome in gWAT of male mice fed with LFD or HFD for 12 weeks. (B) RRBS profiling of DNA methylation levels at Esr1 promoter in gWAT of LFD- and HFD-fed mice. RRBS was performed in gWAT from male C57BL/6J mice fed with either LFD or HFD for 12 weeks starting at 6 weeks of age. Genomic DNA from 4 animals was pooled in each group for RRBS analysis. (C) DNA methylation levels at individual CpG sites at Esr1 promoter in gWAT of male C57BL/6J mice fed either LFD or HFD for 12 weeks, n=4/group. *p<0.05 vs. LFD by Student’s t test. (D-E) Average DNA methylation levels at Esr1 promoter (D, n=5/group) and Esr1 expression (E, n=4/group) in gWAT of male C57BL/6J mice fed either LFD or HFD for 12 or 24 weeks. *p<0.05 vs. LFD by Student’s t test. (F-G) DNA methylation levels at individual CpG sites at Esr1 promoter (F) and Esr1 expression (G) in gWAT of female C57BL/6J mice fed either LFD or HFD for 12 weeks, n=5/group. *p<0.05 vs. LFD by Student’s t test. (H) DNA methylation levels at individual CpG sites at Esr1 promoter in 3T3-L1 adipocytes treated with palmitate (C16) or stearate (C18), n=3/group. Groups labeled with different letters are statistically different from each other as analyzed by ANOVA with Fisher’s least significant difference (LSD) post hoc test. (I) Esr1 promoter luciferase activity in 3T3-L1 adipocytes transfected with fully methylated or unmethylated constructs, n=3. *p<0.05 vs. all other groups as analyzed by ANOVA with Fisher’s LSD post hoc test. (J) Esr1 promoter luciferase activity in 3T3-L1 adipocytes transfected with unmethylated constructs in the presence of BSA, palmitate (C:16, 200μM), or stearate (C:18, 200μM). n=3. *p<0.05 vs. BSA by ANOVA with Fisher’s LSD post hoc test. All data are expressed as mean ± SEM.
Figure 2.
Figure 2.. DNMT1 mediates HFD-induced increase of DNA methylation at Esr1 promoter.
(A-B) ChIP analysis of binding of DNMT1 (A) and DNMT3a (B) at Esr1 promoter in gWAT of male mice fed with LFD or HFD for 12 weeks, n=3/group. *p<0.05 vs. LFD by Student’s t test. (C-D) Expression of Dnmt1 (C) and Dnmt3a (D) in gWAT of male mice fed with LFD or HFD for 12 weeks, n=4/group. *p<0.05 vs. LFD by Student’s t test. (E) DNMT1 protein levels in gWAT of male mice fed with LFD or HFD for 12 weeks, n=3/group. (F-G) Expression of Esr1 in 3T3-L1 adipocytes with Dnmt1 or Dnmt3a knockdown at day 5 (F) or day 8 (G) of differentiation, n=3/group. Groups labeled with different letters are statistically different from each other as analyzed by ANOVA with Fisher’s LSD post hoc test. (H) Expression of Esr1 in primary adipocytes differentiated from AD1KO and their fl/fl littermates, n=4/group. *p<0.05 vs. fl/fl by Student’s t test. All data are expressed as mean ± SEM.
Figure 3.
Figure 3.. Inhibiting DNA methylation increases Esr1 expression and decreases inflammation in adipocytes.
(A-B) Pro-inflammatory gene expression in 3T3-L1 adipocytes with Esr1 knockdown (A) or overexpression (B), n=3/group. *p<0.05 vs. Scramble in (A) or pcDNA in (B) by Student’s t test. (C) Plasma glucose, insulin, glucose × insulin products, and ITT in DIO mice treated with 5-aza-dC (0.25mg/kg BW, three times per week) for 6 weeks, n=4–6/group. Groups labeled with different letters are statistically different from each other; *p<0.05 vs. other groups. Statistical significance was analyzed by ANOVA with Fisher’s LSD post hoc test. (D) Esr1, and pro-inflammatory gene expression in gWAT of DIO mice treated with 5-aza-dC (0.25mg/kg BW, three times per week) for 6 weeks, n=5/group. Groups labeled with different letters are statistically different from each other as analyzed by Kruskal-Wallis non-parametric ANOVA by rank for Esr1 and ANOVA with Fisher’s LSD post hoc test for Tnfα and Il1β. (E) Proinflammatory gene expression in adipocytes differentiated from AD1KO and fl/fl mice and treated with palmitate (C16) or stearate (C18), n=3/group. *p<0.05 vs. fl/fl by Student’s t test. (F) Proinflammatory gene expression in adipocytes differentiated from AD1KO and fl/fl mice and treated with TNFα, n=4–5/group. *p<0.05 vs. fl/fl by Student’s t test. (G) Esr1, Tnfα and Il1β expression in 3T3-L1 adipocytes with Dnmt1 and/or Esr1 knockdown. Day 5 differentiated 3T3L1 cells were transfected with scramble, Dnmt1, Esr1 or both Dnmt1 and Esr1 siRNA. Two days later, cells were treated with TNFα and samples were collected for gene expression analysis. n=6. Groups labeled with different letters are statistically different from each other as analyzed by ANOVA with Fisher’s LSD post hoc test. All data are expressed as mean ± SEM.
Figure 4.
Figure 4.. Adipocyte Dnmt1 deletion improves metabolic phenotypes in female mice fed HFD.
(A-B) Body weight (A) and adipose tissue and liver weight (B) in female AD1KO and fl/fl mice fed HFD, n=6/group. *p<0.05 vs. fl/fl by Student’s t test. (C) H&E staining of gWAT of female AD1KO and fl/fl mice fed HFD. (D) Energy expenditure in female AD1KO and fl/fl mice fed HFD, n=4/group. *p<0.05 vs. fl/fl by Student’s t test. (E-F) GTT (E) and ITT (F) in female AD1KO and fl/fl mice fed HFD, n=6/group. *p<0.05 vs. fl/fl by ANOVA with repeated measures followed by Fisher’s LSD post hoc test. (G) Thermogenic expression in iBAT of female AD1KO and fl/fl mice fed HFD. n=5. *p<0.05 vs. fl/fl by Student’s t test. (H) UCP1 immunostaining in iBAT of female AD1KO and fl/f mice on HFD. (I) Thermogenic expression in gWAT of female AD1KO and fl/fl mice fed HFD. n=5. *p<0.05 vs. fl/fl by Student’s t test. All data are expressed as mean ± SEM.
Figure 5.
Figure 5.. Adipocyte Dnmt1 deletion upregulates Esr1 expression and reduces adipose tissue inflammation in female mice fed HFD.
(A-B) Esr1 promoter DNA methylation level (A) and mRNA expression level (B) in female AD1KO and fl/fl mice fed HFD, n=6/group. *p<0.05 vs. fl/fl by Student’s t test. (C-E) Volcano plot (C), pathway analysis (D) and heat map (E) analyzed from RNAseq data from gWAT of female AD1KO and fl/fl mice fed HFD. (F) CD68-immunostaining of gWAT of female AD1KO and fl/fl mice fed HFD. (G) FACS analysis of F4/80+CD11C+ ATMs in gWAT of female AD1KO and fl/fl mice fed HFD. (H) Percentage of F4/80+ ATMs, F4/80+CD11C+ ATMs, CD8+ T lymphocytes and CD45R/B220+ B lymphocytes in gWAT of female AD1KO and fl/fl mice fed HFD, n=5/group. *p<0.05 vs. fl/fl by Student’s t test. All data are expressed as mean ± SEM.
Figure 6.
Figure 6.. Targeted methylation at the Esr1 promoter regulates adipocyte inflammation/chemotaxis and insulin sensitivity.
(A-B) Macrophage migration assay (A) and inflammatory gene expression (B) in RAW264.7 macrophages co-cultured with 3T3-L1 adipocytes infected with lentivirus expressing scramble sgRNA or S7 sgRNA targeting Esr1 promoter along with dCas9-DNMT3a, n=3/group, *p<0.05 vs. Scramble by Student’s t test. (C-D) Macrophage migration assay (C) and inflammatory gene expression (D) in RAW264.7 macrophages co-cultured with 3T3-L1 adipocytes infected with lentivirus expressing scramble sgRNA or S7 sgRNA targeting Esr1 promoter along with dCas9-TET1, n=3/group, *p<0.05 vs. Scramble by Student’s t test. (E-F) GTT (E) and ITT (F) in HFD-fed female C57BL/6J mice surgically injected with dCas9-TET1 along with either scramble sgRNA or S7 sgRNA targeting Esr1 promoter in gWAT, n=4. *p<0.05 vs. Scramble sgRNA by ANOVA with repeated measures followed by Fisher’s LSD post hoc test. (G-I) Gene expression (G), FACS analysis of F4/80+CD11C+ ATMs (H), and percentage of F4/80+ ATMs, F4/80+CD11C+ ATMs, and CD8+ T lymphocytes (I) in gWAT of HFD-fed female C57BL/6J mice surgically injected with dCas9-TET1 along with either scramble sgRNA or S7 sgRNA targeting Esr1 promoter in gWAT, n=4. *p<0.05 vs. Scramble sgRNA by Student’s t test. All data are expressed as mean ± SEM.

References

    1. Hotamisligil GS. Inflammation and metabolic disorders. Nature. 2006;444(7121):860–7. - PubMed
    1. Olefsky JM, and Glass CK. Macrophages, inflammation, and insulin resistance. Annu Rev Physiol.72:219–46. - PubMed
    1. Schenk S, Saberi M, and Olefsky JM. Insulin sensitivity: modulation by nutrients and inflammation. J Clin Invest. 2008;118(9):2992–3002. - PMC - PubMed
    1. Suzuki MM, and Bird A. DNA methylation landscapes: provocative insights from epigenomics. Nat Rev Genet. 2008;9(6):465–76. - PubMed
    1. Backdahl L, Bushell A, and Beck S. Inflammatory signalling as mediator of epigenetic modulation in tissue-specific chronic inflammation. Int J Biochem Cell Biol. 2009;41(1):176–84. - PubMed

Publication types

LinkOut - more resources