[Preprint]. 2025 Jun 29:2025.06.26.661633.
doi: 10.1101/2025.06.26.661633.

Riboflavin drives nucleotide biosynthesis and iron-sulfur metabolism to promote acute myeloid leukemia

Affiliations

Riboflavin drives nucleotide biosynthesis and iron-sulfur metabolism to promote acute myeloid leukemia

Stefan Bjelosevic et al. bioRxiv. .

Abstract

Riboflavin is a diet-derived vitamin in higher organisms that serves as a precursor for flavin mononucleotide and flavin adenine dinucleotide, key cofactors that participate in oxidoreductase reactions. Here, using proteomic, metabolomic and functional genomics approaches, we describe a specific riboflavin dependency in acute myeloid leukemia and demonstrate that, in addition to energy production via oxidative phosphorylation, a key biological role of riboflavin is to enable nucleotide biosynthesis and iron-sulfur cluster metabolism. Genetic perturbation of riboflavin metabolism pathways or exogenous depletion in physiological culture medium induce nucleotide imbalance and DNA damage responses, as well as impair the stability and activity of proteins which utilize [4Fe-4S] iron-sulfur clusters as cofactors. We identify a window of therapeutic opportunity upon riboflavin starvation or chemical riboflavin metabolism perturbation and demonstrate that this strongly synergizes with BCL-2 inhibition. Our work identifies riboflavin as a critical metabolic dependency in leukemia, with functions beyond energy production.


Conflict of interest statement

S. Bjelosevic is a current equity holder in Ramsay Healthcare Ltd. D.E. Root receives research funding from Abbvie, BMS, Janssen and Merck, and is a member of the Board of Directors of Addgene, Inc. M.G. Vander Heiden is on the scientific advisory board of Agios Pharmaceuticals, iTeos Therapeutics, Drioa Ventures, Sage Therapeutics, Lime Therapeutics, Pretzel Therapeutics, and Auron Therapeutics, and is on the advisory board of Developmental Cell. K. Stegmaier received grant funding from Novartis and consults for and has stock options with Auron Therapeutics.

Figures

Figure 1.
Figure 1.. Physiologically relevant metabolite depletion screens identify riboflavin as a leukemia dependency.
A. Schema of vitamin depletion screens in AML cells. B. Proliferation of NB4 and MOLM-13 cells upon systematic removal of vitamins from Plasmax medium at day 6. Cell number is normalized to Plasmax complete medium. Cells cultured in Plasmax complete medium and treated with 1μM all-trans retinoic acid (ATRA) served as an anti-proliferation/differentiation control. Data representative of n=4 pooled replicates from two independent biological experiments. C. Representative histograms of cell surface CD11b-APC in NB4 and MOLM-13 cells upon systematic removal of vitamins from Plasmax medium at day 6. D. Quantification of CD11b geometric mean fluorescence intensity (MFI) in NB4 and MOLM-13 cells from C. at day 6. The average of 2 replicates per condition was normalized to the isotype control and compared to Plasmax complete. E. Cell death in NB4, MOLM-13, MV4–11 and OCI-AML2 cells as measured by Annexin V-APC cell surface staining at day 6 (NB4, OCI-AML2), day 8 (MV4–11) and day 11 (MOLM-13) post riboflavin withdrawal from Plasmax. Data representative of n=3 biological replicates. F. Schema of riboflavin depletion experiments in NSG mice. SST, succinylsulfathiazole; LC-MS/MS, liquid chromatography with tandem mass spectrometry. G. Quantification of riboflavin, FMN and FAD in blood plasma of mice fed adequate (n=5) versus deficient (n=4) riboflavin diets at 21 days. H. Average mouse mass of mice fed adequate (n=5) versus deficient (n=4) riboflavin diets over 21 days. I. Complete blood counts of mice fed adequate versus deficient riboflavin diets at start of experiment (baseline, day 0) and at 21 days. WBC, white blood cell count; RBC, red blood cell count; Hb, hemoglobin test; PLT, platelet count. J. Cell number of healthy CD34+ HSPC cells after 6 days of culture in Plasmax complete or Plasmax lacking isoleucine (anti-proliferative control) or riboflavin. Cell number is normalized to Plasmax complete medium. Data representative of n=3 biological replicates. The experiment was repeated with two separate donors. Data are presented as the mean ± SD. *P < 0.05; **P < 0.01; ***P < 0.001 and ****P < 0.0001 by ordinary one-way ANOVA with Bonferroni’s multiple comparisons test (B, J) and unpaired two-tailed Student’s t-test (E, G, I).
Figure 2.
Figure 2.. Riboflavin kinase (RFK) is a metabolic dependency in acute myeloid leukemia.
A. Schema of cellular riboflavin processing pathways. FMN, flavin mononucleotide; FAD, flavin adenine dinucleotide; ALP, alkaline phosphatase; RFK, riboflavin kinase; FLAD1, flavin adenine dinucleotide synthase 1. B. Dependency on RFK in cancer cell lines by disease lineage from the Broad Institute’s DepMap 24Q2 database. Gene essentiality reported as Gene Effect Chronos score, where more negative values equal higher essentiality and each data point represents an individual cell line. Myeloid and lymphoid lineage are highlighted in red, pooled solid cancer cell lines in blue. Boxplots ranked by median RFK dependency. C. Schema of in vitro competitive proliferation assays. D. Competitive proliferation experiments in NB4 and MV4–11 AML cell lines over 21 days in RPMI medium. Two independent RFK sgRNAs and a control targeting the conserved ROSA26 locus (sgRosa) were used, and relative proliferation was measured using GFP as a readout of edited cells. Data representative of n=3 biological replicates. E. Competitive proliferation experiments in Cas9-competent PDX17–14 cells subjected to short-term in vitro culture over 21 days in PDX medium. An RFK sgRNA and a control targeting Rosa was used, and relative proliferation was measured using GFP as a readout of edited cells. Data representative of n=3 biological replicates. Western immunoblot of RFK KO shown, with β-actin serving as the loading control. F. Competitive proliferation experiments in the MV4–11 AML cell line over 21 days in Plasmax complete medium. Two independent RFK sgRNAs and a control (sgRosa) were used, and relative proliferation was measured using GFP as a readout of edited cells. Plasmax medium was refreshed every 72 hours. Data representative of n=3 biological replicates. G. Proliferation of NB4 or PDX16–01 cells upon induction of a doxycycline inducible sgRNA targeting sgRosa, RFK, or endogenous RFK knockout cells expressing a wild type (WT) CRISPR-resistant RFK cDNA construct over 12 days (NB4) or 19 days (PDX16–01). Data representative of n=3 biological replicates. Validation western immunoblots of endogenous RFK and V5-tagged RFK over-expression and knockout shown, with β-actin serving as the loading control. H. Cell number of EW8 Ewing sarcoma and SKNAS neuroblastoma cells upon genetic deletion of RFK using two independent sgRNAs and a control (sgRosa) at 14 days. Cell number is normalized to sgRosa. Data representative of n=3 biological replicates. I. Scatter plots of the in vitro and in vivo depletion scores of RFK at the gene level in MV4–11, U937 and PDX16–01. Data points representing the median value of RFK (red circles) and its matching intronic control (blue circles) are shown. J. Schema of in vivo experiment examining the anti-leukemic effects of RFK loss in MV4–11 cells. K. Examination of key hematological compartments at 14 days post RFK depletion in vivo. Data reported as percentage of human CD45-positive cells of total cells. Data are presented as the mean ± SD. ***P < 0.001 and ****P < 0.0001 by ordinary one-way ANOVA with Bonferroni’s multiple comparisons test (B, H), ordinary two-way ANOVA with Bonferroni’s multiple comparisons test (G), and individual unpaired two-tailed Student’s t-test (K).
Figure 3.
Figure 3.. Global analysis of total proteome under riboflavin metabolism perturbation.
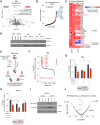
A. Schema of proteomic experiments performed upon genetic depletion of RFK (at day 9) or exogenous depletion of riboflavin (at day 4) in NB4 cells. B. Volcano plot of relative fold change (log2) in protein abundance in NB4 cells upon RFK deletion versus Rosa control at day 9 ranked by significance (left) or riboflavin starvation versus complete medium at day 4 ranked by significance (right). Multiple comparisons were controlled by applying a Benjamini-Hochberg correction (false discovery rate, FDR). The dotted line denotes P < 0.05. Red circles, FAD-containing proteins; blue circles, FMN-containing proteins; purple circles, iron-sulfur cluster-containing only proteins; orange circles, iron starvation response-associated proteins. C. Pearson correlation plot of the log2 change in protein abundance in exogenous riboflavin medium depletion at day 4 versus genetic depletion of RFK at day 9 in NB4 cells. Pearson correlation coefficient R = 0.511, P < 2.2 × 10⁻¹⁶. D. Bubble plots of enriched gene ontology molecular function (left) and biological process (right) associated with differentially downregulated proteins from RFK deletion (B, left pane). q-values with Bonferroni correction are reported. E. Blue Native (BN) polyacrylamide gel electrophoresis (PAGE) of NB4 and MV4–11 cells at 9 days post deletion of RFK and after 4 and 7 days of exogenous riboflavin starvation. F. Oxygen consumption rate (OCR) of NB4 and MV4–11 cells after 9 days of RFK deletion compared to Rosa control, or 4- or 7-days post riboflavin starvation compared to complete medium control. FCCP, carbonyl cyanide 4-(trifluoromethoxy) phenylhydrazone.
Figure 4.
Figure 4.. Riboflavin metabolism perturbation induces nucleotide imbalance.
A. Volcano plot of relative fold change (log2) in metabolite abundance in NB4 cells upon RFK deletion versus Rosa control at day 9 ranked by significance. The dotted line denotes P < 0.05. Blue circles, starch/sucrose/nucleotide sugar metabolism; green circles, nucleotide metabolism; yellow circles, phosphatidylethanolamine/phosphatidylcholine metabolism. B. Dot plot of genetic co-dependency of genes with RFK ranked by Pearson correlation. Data from DepMap 24Q2. Blue shading denotes nucleotide metabolism-associated genes. C. Heatmap of nucleotide metabolites in RFK deleted NB4 cells versus Rosa controls cultured in RPMI for 7 days. Relative log2 of metabolite abundances shown. Data representative of n=4 biological replicates per condition. D. Western immunoblot for DHODH in NB4 and MV4–11 cells upon genetic KO of RFK for 9 days (left) or 4 and 7 days of exogenous riboflavin starvation (right). β-Actin served as the loading control. Blot membrane was stripped and reprobed for other proteins of interest, and data from the same gel, including loading control, are also used in Figure S5A. E. Schema of CRISPR screen using metabolic library in NB4 cells cultured in Plasmax complete or riboflavin depleted medium. F. Dot plot of genes ranked by relative log2 enrichment or depletion in Plasmax complete versus riboflavin depleted culture medium as measured by sgRNA abundance. Genes whose abundance increased conferred resistance to riboflavin depletion. Red denotes genes associated with purine biosynthesis. G. Cell number of NB4 cells at day 6 post culture in Plasmax complete or lacking riboflavin and treated with vehicle (water), or cocktails of purine (A+G, adenosine + guanosine) or pyrimidine (C+T, cytidine + thymidine) nucleosides. Cell number normalized to Complete + Vehicle. Data representative of n=3 biological replicates. H. Cell number of MV4–11 cells at day 8 post induction of Rosa or RFK sgRNAs, treated with vehicle (water), or cocktails of purine (A+G, adenosine + guanosine) or pyrimidine (C+T, cytidine + thymidine) nucleosides in Plasmax medium for 4 days. Cell number normalized to sgRosa + Vehicle. Data representative of n=3 biological replicates. I. Western immunoblot for ɣH2A.X in MV4–11 cells at day 8 post induction of Rosa or RFK sgRNAs, treated with vehicle (water), or cocktails of purine (A+G, adenosine + guanosine) or pyrimidine (C+T, cytidine + thymidine) nucleosides in Plasmax medium for 4 days. Short exposure (top) and long exposure (bottom). Vinculin served as the loading control. J. Dot plot of the correlation between RFK dependency and metabolite abundance in the DepMap 24Q2 dataset ranked by significance. Each circle denotes an individual metabolite. Dotted line denotes P < 0.05. Data are presented as the mean ± SD. **P < 0.01, ***P < 0.001 and ****P < 0.0001 by ordinary two-way ANOVA with Bonferroni’s multiple comparisons test (G, H).
Figure 5.
Figure 5.. Riboflavin perturbation impairs iron-sulfur cluster dependent proteins.
A. Dot plot of genes ranked by relative log2 enrichment or depletion in Plasmax complete versus riboflavin depleted culture medium as measured by sgRNA abundance. Genes whose abundance decreased conferred sensitivity to riboflavin depletion. Colors show indicated gene families. B. Dot plot of genetic co-dependency of genes with RFK ranked by Pearson correlation. Data from DepMap 24Q2. Purple shading indicates iron-sulfur cluster containing genes, and orange iron starvation response-associated genes. C. Simplified schema of the synthesis of [2Fe-2S] iron-sulfur clusters, their trafficking, and involvement in the synthesis of [4Fe-4S] iron-sulfur clusters. The client proteins of [4Fe-4S] clusters are highlighted, and stars indicate CRISPR screen hits that sensitize cells to death upon riboflavin starvation. D. Western immunoblot analysis of indicated proteins in cell lysates isolated from NB4 and MV4–11 cells at day 5 (left blots) and day 9 (right blots) post induction of Rosa or RFK sgRNAs. β-Actin served as the loading control. E. Volcano plot of relative fold change (log2) of differentially regulated genes versus −log10 (P-values) in NB4 cells upon RFK deletion in RPMI medium at day 7. F. Aconitase activity (mOD/min/μg of protein) in whole-cell lysates of RFK deleted NB4 cells at day 9. mOD, milli optical density. Data representative of n=3 biological replicates. G. Cell number of NB4 and MV4–11 cells at day 7 post induction of Rosa or RFK sgRNAs, or day 7 post riboflavin starvation, treated with vehicle (DMSO, dimethyl sulfoxide), or the iron chelator deferoxamine (DFO) for 3 days. Cell number normalized to sgRosa + DMSO, or Plasmax Complete medium + DMSO. Data representative of n=3 biological replicates. Data are presented as the mean ± SD. *** P < 0.001, ****P < 0.0001 by unpaired two-tailed Student’s t-test (F) and ordinary two-way ANOVA with uncorrected Fisher’s LSD test (G).
Figure 6.
Figure 6.. Perturbing riboflavin metabolism synergizes with BCL-2 inhibition.
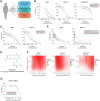
A. Schema of RFK perturbation via genetic, exogenous depletion and small molecule approaches in combination with the BCL-2 inhibitor venetoclax. B. Relative viability of doxycycline-inducible sgRNA-expressing NB4, MV4–11 and PDX16–01 cells targeting Rosa or RFK treated with venetoclax for 72 hours. Cells were treated with doxycycline for 4 days prior to venetoclax treatment to induce gene knockout. C. Relative viability of NB4 and MV4–11 cells cultured in Plasmax complete or riboflavin deficient medium and treated with venetoclax for 72 hours. Cells were pre-conditioned in appropriate medium for 4 days prior to venetoclax treatment. D. Chemical structure of roseoflavin, 8-dimethylaminoriboflavin. E. Relative viability of NB4 or MV4–11 cells treated with venetoclax alone, or venetoclax and two fixed concentrations of roseoflavin (3.13 μM, blue; or 6.25 μM, red) for 72 hours. F. NB4, MV4–11 and PDX16–01 cells were treated with escalating concentrations of venetoclax and roseoflavin for 72 hours to determine viability effects. The presence of treatment synergy was determined using SynergyFinder and the Bliss synergy index and is denoted as regions of red in the graphs. The mean of three biological replicates was used for each data point. G. Relative viability of CD34+ HSPC cells treated with escalating concentrations of roseoflavin for 72 hours. Concentrations used to sensitize NB4 and MV4–11 cells in E. are highlighted (3.13 μM, blue; or 6.25 μM, red). Data are presented as the mean ± SD.

References

    1. Thapa M., and Dallmann G. (2020). Role of coenzymes in cancer metabolism. Semin Cell Dev Biol 98, 44–53. 10.1016/j.semcdb.2019.05.027. - DOI - PubMed
    1. Stein L.R., and Imai S. (2012). The dynamic regulation of NAD metabolism in mitochondria. Trends Endocrinol Metab 23, 420–428. 10.1016/j.tem.2012.06.005. - DOI - PMC - PubMed
    1. Lienhart W.D., Gudipati V., and Macheroux P. (2013). The human flavoproteome. Arch Biochem Biophys 535, 150–162. 10.1016/j.abb.2013.02.015. - DOI - PMC - PubMed
    1. Forneris F., Binda C., Vanoni M.A., Mattevi A., and Battaglioli E. (2005). Histone demethylation catalysed by LSD1 is a flavin-dependent oxidative process. FEBS Lett 579, 2203–2207. 10.1016/j.febslet.2005.03.015. - DOI - PubMed
    1. Helliwell K.E., Wheeler G.L., and Smith A.G. (2013). Widespread decay of vitamin-related pathways: coincidence or consequence? Trends Genet 29, 469–478. 10.1016/j.tig.2013.03.003. - DOI - PubMed

Publication types

LinkOut - more resources