[Preprint]. 2025 Jun 18:2025.06.13.659520.
doi: 10.1101/2025.06.13.659520.

Thymic DC2 are heterogenous and include a novel population of transitional dendritic cells

Affiliations

Thymic DC2 are heterogenous and include a novel population of transitional dendritic cells

Matouš Vobořil et al. bioRxiv. .

Abstract

Myeloid cells, including dendritic cells (DCs) and macrophages, are essential for establishing central tolerance in the thymus by promoting T cell clonal deletion and regulatory T cell (Treg) generation. Previous studies suggest that the thymic DC pool consists of plasmacytoid DC (pDC), XCR1+ DC1 and SIRPα+ DC2. Yet the precise origin, development, and homeostasis, particularly of DC2, remain unresolved. Using single-cell transcriptomics and lineage-defining mouse models we identify nine major populations of thymic myeloid cells and describe their lineage identities. What was previously considered to be "DC2" is actually composed of 4 distinct cell lineages. Amongst these are monocyte-derived DCs (moDC) and monocyte derived macrophages (moMac), which are dependent on thymic interferon to upregulate MHCII and CD11c. We further demonstrate that conventional DC2 undergo intrathymic maturation through CD40 signaling. Finally, amongst "DC2" we identify a novel thymic population of CX3CR1+ transitional DC (tDC), which represent transendothelial DCs positioned near thymic microvessels. Together, these finding reveal the thymus as a niche for diverse, developmentally distinct myeloid cells and elucidate their specific requirements for development and maturation.


Conflict of interest statement

J.I. reported personal fees from Immunitas Therapeutics outside the submitted work. The other authors declare no competing interests.

Figures

Figure 1.
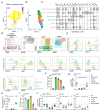
Figure 1.. Single-cell RNA sequencing reveals heterogeneity in thymic DC2.
(A) Single-cell RNA sequencing of CD11c+ and CD11b+ FACS-sorted cells from thymus of 7-week-old C57BL/6 mice. Cells were bioinformatically filtered to include only clusters expressing Flt3, Csf1r, and Csf3r. UMAP plots show the analysis of 8,514 transcriptome events, identifying 9 major clusters, marked by color-coded lines. (B) Violin plots displaying normalized expression of signature genes associated with cell clusters defined in (A). (C) Representative flow cytometry gating strategy for identifying the cell populations defined in (A) and (B). Cells were pre-gated as shown in Fig. S1D. The gating strategy identifies granulocytes (Ly6G/SiglecF+CD11b+), plasmacytoid dendritic cells (pDC; SiglecH+), macrophages (Ly6CCD64+), monocytes (Ly6C+CD11b+), activated DC type I (aDC1; CD11c+MHCII+CCR7+XCR1+), aDC2 (aDC1; CD11c+MHCII+CCR7+SIRPα+), DC1 (CD11c+MHCII+ XCR1+), DC2 (CD11c+MHCII+SIRPα+CD11b+), and CX3CR1+ DC2 (CD11c+MHCII+SIRPα+CD11bLowCX3CR1+). (D) Frequency of thymic myeloid cell populations among total CD11c+ and CD11b+ cells in the thymus of C57BL/6 mice from birth (0 days old) to 105 days old mice, n = 2-7 mice from two independent experiments. (E) Total numbers of cells per thymus in 7 weeks old C57BL/6 mice, n = 3 mice. (F) Representative gating strategy for thymic CD11c+MHCII+ SIRPα+ cells. The graph represents the percentage distribution of individual thymic subpopulations in 7 weeks old C57BL/6 mice, n = 2 mice from two independent experiments. Data are shown as mean ± SD.
Figure 2.
Figure 2.. The thymus contains interferon-activated populations of monocyte-derived DC and macrophages.
(A) Feature plot showing the normalized expression of Mafb in clusters identified in Fig. 1A. (B) Single-cell RNA sequencing of CD11c+ and CD11b+ FACS-sorted cells from thymus of 7-week-old C57BL/6 mice. Cells were bioinformatically filtered to include only clusters expressing Mafb. UMAP plots show the analysis of 1,020 transcriptome events, identifying 5 clusters. (C) Violin plots displaying the normalized expression of signature genes associated with cell clusters defined in (B). (D) Representative flow cytometry gating strategy for identifying the four major populations defined in (B) and (C). The gating strategy identifies monocytes (Ly6C+CD11b+MHCII), monocyte-derived DC (moDC; Ly6C+CD11b+MHCII+), macrophages (CD64+CD11cMHCII), and monocyte-derived macrophages (moMac; CD64+CD11c+MHCII+). (E) Representative flow cytometry plots showing normalized expression of CD26, CD11c, CD11b, LY6C, CD64, CX3CR1, F4/80, MERTK, VCAM1, and TIM4 in thymic dendritic cells (DC; Ly6CCD64CD11c+MHCII+) and thymic monocyte and macrophage populations described in (D). (F) Frequency of tdTomato+ thymic cells (gated as in D) in Ms4a3Cre ROSA26tdTomato (Ms4a3tdTomato) mice, n = 9 mice from 3 independent experiments. (G) Numbers of thymic DC, monocyte, and macrophage (gated as in D) populations in Zeb2Δ1+2+3 mice, shown as KO/WT ratio of cell numbers, n = 8 mice from 3 independent experiments. (H) Numbers of thymic and splenic cells (gated as in D), shown as spleen/thymus ratio of cell frequencies, n = 6 mice from 3 independent experiments. (I) Frequency of eGFP+ thymic cells (gated as in D) in Mx1eGFP mice, n = 5 mice from 2 independent experiments. (J) Numbers of thymic cells (gated as in D) in Ifnar1−/−Ifnlr1−/−, Cd40l−/−, and Tcra−/− mice, shown as KO/WT ratio of cell numbers, n = 4-17 mice from at least 2 independent experiments. Data are shown as mean ± SD. Statistical analysis was performed by a one-sample t test and Wilcoxon test with a theoretical mean of 1, *p≤0.05, **p≤0.01, ***p≤0.001, ****p≤0.0001, n.s. = not significant.
Figure 3.
Figure 3.. Activation of conventional DC1 and DC2 requires distinct signals.
(A) Single-cell RNA sequencing of CD11c+ and CD11b+ FACS-sorted cells from thymus of 7-week-old C57BL/6 mice. Cells were bioinformatically filtered to include only clusters expressing Flt3. UMAP plots show the analysis of 6,928 transcriptome events, identifying 7 major clusters, marked by color-coded lines. (B) Violin plots displaying the normalized expression of signature genes associated with cell clusters defined in (A). (C) Representative flow cytometry gating strategy for identifying thymic dendritic cells (DC; Ly6CCD64 CD11c+MHCII+), DC1 (CCR7XCR1+), activated DC1 (aDC1; CCR7+XCR1+), DC2 (CCR7SIRPα+), and aDC2 (CCR7+SIRPα+). (D) Representative flow cytometry plots showing expression of eYFP by thymic DC populations described in (C) in Xcr1iCreRosa26eYFP (Xcr1eYFP) mice. Gray cells represent all thymic cells gated as in (C); green cells represent eYFP+ cells. (E) Frequency of eYFP+ cells (gated as in C) in Xcr1iCreRosa26eYFP (Xcr1eYFP) mice, n = 4 mice from 3 independent experiments. (F) Numbers of thymic DCs (gated as in C) in Batf3−/− and Zeb2Δ1+2+3 mice, shown as KO/WT ratio of cell numbers, n = 7-9 mice from 3 independent experiments. (G) Numbers of thymic DCs (gated as in C) in Ifnar1−/−Ifnlr1−/−, Cd40l−/−, and Tcra−/− mice, shown as KO/WT ratio of cell numbers, n = 4-13 mice from at least 2 independent experiments. Data are shown as mean ± SD. Statistical analysis was performed by a one-sample t test and Wilcoxon test with a theoretical mean of 1, **p≤0.01, ***p≤0.001, ****p≤0.0001, n.s. = not significant.
Figure 4.
Figure 4.. The thymus contains a population of CX3CR1+ transitional DC.
(A) Single-cell RNA sequencing of CD11c+ and CD11b+ FACS-sorted cells from thymus of 7-week-old C57BL/6 mice. Cells were bioinformatically filtered and displayed as described in Fig. 3A. DC2, CX3CR1+ DC2, and pDC are marked by color-coded lines. (B) UMAP plots showing the distribution of filtered DC2, CX3CR1+ DC2, and pDC thymic populations defined in A. (C) Violin plots displaying the normalized expression of signature genes associated with cell clusters defined in (B). (D) Representative flow cytometry plots showing the normalized expression of MHCII, CD11b, Ly6C, SiglecH, TCF4, CX3CR1, and CD14, in thymic dendritic cells populations defined in (B) and gated according to the Fig. S4B. (E) Frequency of tdTomato+ thymic dendritic cells populations (gated as in Fig. S4B) in Ms4a3Cre ROSA26tdTomato (Ms4a3tdTomato) mice, n = 9 mice from 3 independent experiments and moDC are used as control. (F) Frequency of eYFP+ thymic DC populations (gated as in Fig. S4B) in hCD2iCre ROSA26eYFP (hCD2eYFP) mice, n = 5 mice from 3 independent experiments. (G) Numbers of thymic populations (gated as in Fig. S4B) in ItgaxCreTcf4fl/fl mice, shown as KO/WT ratio of cell numbers, n = 3 mice from 2 independent experiments, ItgaxCre- mice were used as controls. Data are shown as mean ± SD. Statistical analysis was performed by a one-sample t test and Wilcoxon test with a theoretical mean of 1, *p≤0.05, **p≤0.01, n.s. = not significant.
Figure 5.
Figure 5.. Transitional DC represent transendothelial cells.
(A) Numbers of thymic monocyte-derived dendritic cells (moDC) and DCs (gated as in Fig. S4B) in Ifnar1−/− and Ifnlr1−/− mice, shown as KO/WT ratio of cell numbers, n = 5-6 mice from 2 independent experiments. (B) Numbers of thymic moDC and DCs in Cd40l−/− mice, shown as KO/WT ratio of cell numbers, n = 4-7 mice from 2 independent experiments. (C) Numbers of thymic moDC and DCs in Tcra−/− mice, shown as KO/WT ratio of cell numbers, n = 4 mice from 2 independent experiments. (D) Frequency of eGFP+ thymic moDC and DCs in Mx1eGFP mice, n = 5-7 mice from 3 independent experiments. (E) Representative flow cytometry plots showing thymic SIRPα+ DCs (gated as shown in Fig. S4B) from birth (0 days) to 49 days old mice. (F) Frequency of DC2 and tDC among total CD11c+ and CD11b+ cells in the thymus of C57BL/6 mice from birth (0 days old) to 49 days old mice, n = 6 mice. (G) Frequency of labeled thymic moDC and DCs by intra venous (I.V.) administration of anti-CD11c-PE antibody. Mice were euthanized 2 minutes after administration, n = 6 mice per 3 independent experiments. The cells were gated as shown in Fig. S5C. (H) Representative confocal microscopy images comparing the localization of TCF4+ cells in the thymus of WT C57BL/6 and Zeb2Δ1+2+3 mice. The association with thymic microvessels were assessed by colocalization of TCF4+ cells with CD31+ positivity. Medullary region was identified by Hoechst staining. Scale bars represent 100 μm. (I) Numbers of free and CD31-associated TCF4+ cells in the specific thymus area of WT C57BL/6 and Zeb2Δ1+2+3 mice. Data are shown as mean ± SD. Statistical analysis was performed by a one-sample t test and Wilcoxon test with a theoretical mean of 1 (A, B, and C), one-way ANOVA with multiple comparisons analysis (D and G), and two-sided Fisher’s exact test (I), *p≤0.05, **p≤0.01, ***p≤0.001, ****p≤0.0001, n.s. = not significant.

References

    1. Akiyama T., Shimo Y., Yanai H., Qin J., Ohshima D., Maruyama Y., Asaumi Y., Kitazawa J., Takayanagi H., Penninger J.M., Matsumoto M., Nitta T., Takahama Y., and Inoue J.-I.. 2008. The tumor necrosis factor family receptors RANK and CD40 cooperatively establish the thymic medullary microenvironment and self-tolerance. Immunity. 29:423–437. doi: 10.1016/j.immuni.2008.06.015. - DOI - PubMed
    1. Alcántara-Hernández M., Leylek R., Wagar L.E., Engleman E.G., Keler T., Marinkovich M.P., Davis M.M., Nolan G.P., and Idoyaga J.. 2017. High-Dimensional Phenotypic Mapping of Human Dendritic Cells Reveals Interindividual Variation and Tissue Specialization. Immunity. 47:1037–1050.e6. doi: 10.1016/j.immuni.2017.11.001. - DOI - PMC - PubMed
    1. Ardouin L., Luche H., Chelbi R., Carpentier S., Shawket A., Montanana Sanchis F., Santa Maria C., Grenot P., Alexandre Y., Grégoire C., Fries A., Vu Manh T.-P., Tamoutounour S., Crozat K., Tomasello E., Jorquera A., Fossum E., Bogen B., Azukizawa H., Bajenoff M., Henri S., Dalod M., and Malissen B.. 2016. Broad and Largely Concordant Molecular Changes Characterize Tolerogenic and Immunogenic Dendritic Cell Maturation in Thymus and Periphery. Immunity. 45:305–318. doi: 10.1016/j.immuni.2016.07.019. - DOI - PubMed
    1. Ashby K.M., and Hogquist K.A.. 2024. A guide to thymic selection of T cells. Nat Rev Immunol. 24:103–117. doi: 10.1038/s41577-023-00911-8. - DOI - PubMed
    1. Ashby K.M., Vobořil M., Salgado O.C., Lee S.T., Martinez R.J., O’Connor C.H., Breed E.R., Xuan S., Roll C.R., Bachigari S., Heiland H., Stetson D.B., Kotenko S.V., and Hogquist K.A.. 2024. Sterile production of interferons in the thymus affects T cell repertoire selection. Sci Immunol. 9:eadp1139. doi: 10.1126/sciimmunol.adp1139. - DOI - PMC - PubMed

Publication types