[Preprint]. 2025 Jun 26:2025.06.24.661170.
doi: 10.1101/2025.06.24.661170.

Paclitaxel-induced mitotic arrest results in a convergence of apoptotic dependencies that can be safely exploited by BCL-XL degradation to overcome cancer chemoresistance

Affiliations

Paclitaxel-induced mitotic arrest results in a convergence of apoptotic dependencies that can be safely exploited by BCL-XL degradation to overcome cancer chemoresistance

Xingping Qin et al. bioRxiv. .

Abstract

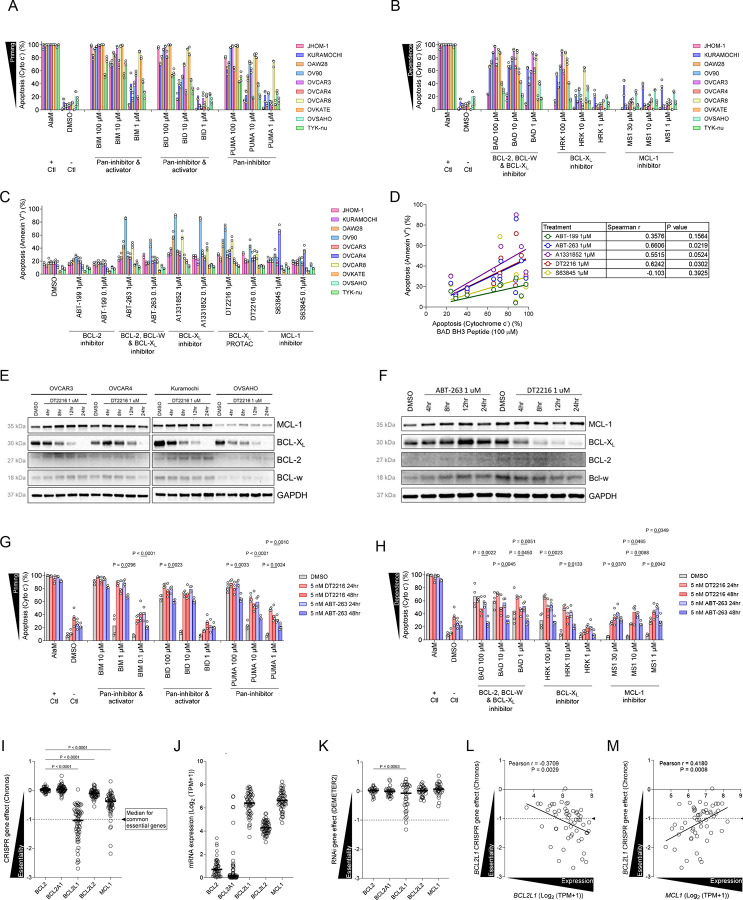
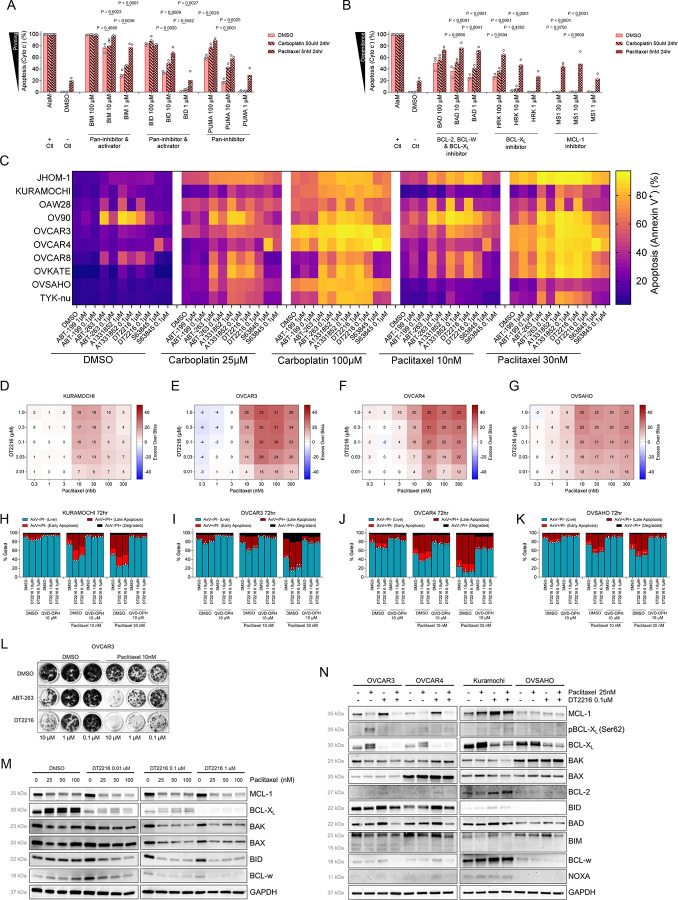
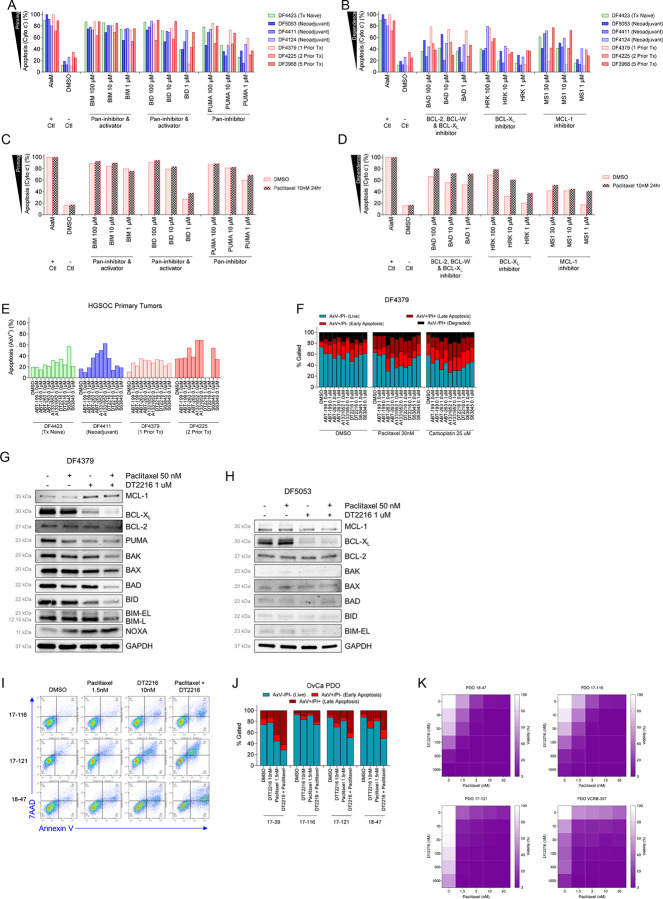
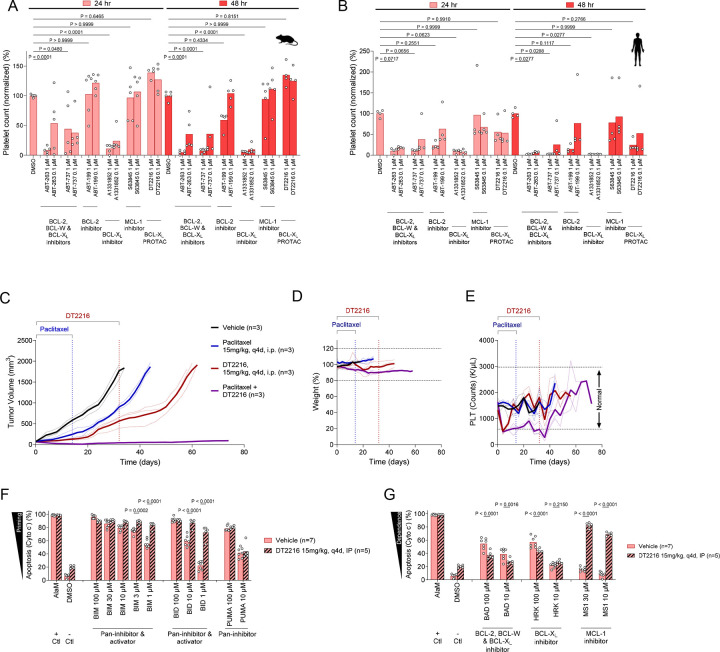
Paclitaxel and other microtubule-targeting agents are cornerstone therapies for diverse cancers, including lung, breast, cervical, pancreatic, and ovarian malignancies. Paclitaxel induces tumor cell apoptosis during mitosis by disrupting microtubule dynamics required for chromosome segregation. However, despite initial responsiveness, many tumors develop resistance, limiting therapeutic durability. Here, we used high-grade serous ovarian carcinoma (HGSOC), the most common and lethal subtype of ovarian cancer, as a model to dissect the mechanisms underlying this resistance. We find that paclitaxel-induced mitotic arrest triggers degradation of the pro-survival protein MCL-1 and upregulation of BCL-XL, followed by inactivating phosphorylation of BCL-XL at Ser62 to promote apoptosis. In resistant cells, this MCL-1 downregulation is insufficient to commit cells to apoptosis but instead results in a transient convergence of apoptotic dependencies by forcing BCL-XL to sequester the pro-apoptotic proteins BIM, BAX, and BAK. During this state, BCL-XL inhibition induces synergistic apoptosis, even in chemoresistant cells. Surprisingly, we also discover that loss of substrate attachment recapitulates this apoptotic convergence both in vitro and in vivo, with HGSOC cells growing in metastasis-promoting malignant ascites displaying heightened apoptotic priming and dependence on BCL-XL relative to solid tumors. In HGSOC xenografts, targeted degradation of BCL-XL using the platelet-sparing proteolysis-targeting chimera (PROTAC) DT2216 matches the efficacy of paclitaxel monotherapy while avoiding the chronic thrombocytopenia induced by BCL-XL inhibitors such as navitoclax (ABT-263). Strikingly, combination therapy leveraging the synergy between paclitaxel and DT2216 leads to complete eradication of HGSOC cell line and patient-derived xenografts. Moreover, DT2216 treatment blunts the rapid apoptotic adaptation caused by other BCL-XL inhibitors, indicating that targeted degradation of pro-survival proteins may yield more durable responses than inhibition alone. These findings uncover a mechanistic framework for safely exploiting the apoptotic dependency convergence caused by mitotic arrest and substrate detachment and support the clinical development of BCL-XL-targeting PROTACs to overcome chemoresistance in ovarian cancer and other solid tumors.


Conflict of interest statement

Declaration of interests: Co-author D.Z. is a co-inventor of DT2216 and a co-founder of and has equity in Dialectic Therapeutics, which develops DT2216 to treat cancer. All other authors declare no competing interests.

Figures

Figure 1:
Figure 1:. Ovarian cancer (OvCa) cell lines are primed for apoptosis and dependent on BCL-XL for survival.
(A) BH3 profiling of OvCa cell lines with BIM and BID activator peptides that inhibit all pro-survival proteins and also directly activate BAX and BAK and the PUMA BH3 sensitizer peptide that only inhibits all pro-survival proteins but does not activate BAX or BAK. Cytochrome c release, as indicated by the percentage of cells that are cytochrome c negative, signals initiation of apoptosis and indicates level of apoptotic priming. (B) BH3 profiling of OvCa cell lines with BAD, HRK and MS1 peptides that only inhibit indicated pro-survival proteins and do not activate BAX or BAK. Cytochrome c release indicates initiation of apoptosis and indicates level of dependence on pro-survival protein being inhibited. Mean ± SEM is shown for n = 3 biological replicates. (C) Annexin V/PI staining and flow cytometry analysis of OvCa cell lines treated with agents targeting BCL-2 family proteins including ABT-199 (inhibits BCL-2 only), ABT-263 (inhibits BCL-2, BCL-XL and BCL-W), DT2216 (degrades BCL-XL), A1331852 (inhibits BCL-XL), or S63845 (inhibits MCL-1) for 72 hours. Mean ± SEM is shown for n = 3 biological replicates. (D) Spearman’s rho correlation analysis comparing responses to BAD BH3 peptide at 100 μM in BH3 profiling versus apoptosis induced by indicated BH3 mimetic in annexin/PI chemosensitivity analysis. (E) Immunoblotting analysis of indicated proteins in OvCa cells treated with DT2216 for indicated duration. (F) Immunoblotting analysis of indicated proteins in OVCAR3 cells treated with ABT-263 or DT2216. (G-H) BH3 profiling of KURAMOCHI cells that were treated with DT2216 or ABT-263 for 24 or 48 hours to measure apoptotic priming (G) or dependencies (H). Mean is shown for n = 3 biological replicates. (I-M) Data from the Cancer Dependency Map (DepMap) showing (I) effect of CRISPR knockout of indicated gene on fitness of OvCa cell lines, (J) mRNA expression of pro-survival BCL-2 family genes, (K) effect of siRNA knockdown of indicated gene on fitness of OvCa cell lines, (L-M) comparison of the effects of BCL2L1 knockout and expression of BCL2L1 (L) or MCL1 (M) mRNA expression levels. Data in A-C are shown from individual experiments with bars representing means ± SEM from at least n=3 independent experiments. P values compare biological replicates in a one- or two-way ANOVA with Holm-Sidak’s adjustment for multiple comparisons.
Figure 2:
Figure 2:. HGSOC tumors commonly express cytoplasmic BCL-XL
(A) Immunohistochemical analysis of BCL-XL expression across subtypes of OvCa tumors. Subtype, expression level (High, Medium, Low or Not Detected), % of cells staining positive and localization of BCL-XL are noted for each specimen). (B-D) BCL-XL staining analysis across subtypes of ovarian tumors. (E) Gene expression analysis from RNA-seq performed on HGSOC primary tumors before and after administration of neoadjuvant chemotherapy. P values compare biological replicates in a one-way ANOVA with Holm-Sidak’s adjustment for multiple comparisons.
Figure 3:
Figure 3:. Paclitaxel and carboplatin increase apoptotic priming and BCL-XL dependence in OvCa cell lines.
(A-B) BH3 profiling of OvCa cell lines that were treated with carboplatin or paclitaxel for 24 hours to measure apoptotic priming (A) or dependencies (B). Mean ± SEM is shown for n = 4 biological replicates. (C) Annexin V staining and flow cytometry analysis of OvCa cell lines treated with carboplatin or paclitaxel in combination with agents targeting BCL-2 family proteins. Mean is shown for n = 3 biological replicates. (D-G) Bliss synergy analysis of OvCa cell lines treated with paclitaxel and DT2216. (H-K) Annexin V/PI staining and flow cytometry analysis of OvCa cell lines treated with paclitaxel and DT2216 in the presence of pan-caspase inhibitor QVD-OPH for 72 hours. Mean ± SEM is shown for n = 4 biological replicates. (L) Colony formation assay performed on OVCAR3 cells treated with paclitaxel in combination with indicated agents targeting BCL-XL. Data are representative of n = 3 biological replicates. (M) Immunoblotting analysis of indicated proteins in OVCAR3 cells treated with indicated agents for 24 hours. (N) Immunoblotting analysis of indicated proteins in OvCa cell lines treated with indicated agents for 24 hours. P values compare biological replicates in a one- or two-way ANOVA with Holm-Sidak’s adjustment for multiple comparisons.
Figure 4:
Figure 4:. OvCa primary tumors and patient-derived organoids are primed for apoptosis and dependent on BCL-XL.
(A-B) BH3 profiling of OvCa primary tumors to measure apoptotic priming (A) or dependencies (B). (C-D) BH3 profiling of OvCa primary tumor DF4379 treated with carboplatin or paclitaxel for 24 hours to measure apoptotic priming (C) or dependencies (D). Mean is shown for n = 1–2 technical replicates. (E) Annexin/PI staining and flow cytometry analysis of OvCa primary tumors treated with agents targeting BCL-2 family proteins. Mean is shown for n = 1–2 technical replicates. (F) Annexin/PI staining and flow cytometry analysis of OvCa primary tumor DF4379 treated with paclitaxel and agents targeting BCL-2 family proteins for 72 hours. Mean is shown for n = 1–2 technical replicates. (G-H) Immunoblotting analysis of DF4379 (G) and DF5053 (H) treated with indicated agent for 24 hours. (I-J) Annexin/7AAD staining and flow cytometry analysis of OvCa patient derived organoids treated with paclitaxel and DT2216 for 5 days. Mean is shown for n = 1 biological replicates. (K) ATP measurements in OvCa patient derived organoids treated with paclitaxel and DT2216 for 5 days.
Figure 5:
Figure 5:. HGSOC PDX models are broadly sensitive to combination treatment with paclitaxel and DT2216 due to release of BIM, BAX and BAK from BCL-XL.
(A) OvCa PDX models collected during in vivo growth were cultured ex vivo for 48 hours, then treated with DT2216 ± paclitaxel and viability was measured after 96 hours by adding luciferin and measuring luminescence. Mean is shown for n = 4 technical replicates from one biological replicate that is representative of n = 2 biological replicates. (B-C) Immunoprecipitation of BCL-XL (B) or MCL-1 (C) in OVCAR3 cells treated with DT2216 ± paclitaxel for 24 hours. Input lanes show all proteins collected in various treatments. IP indicates immunoprecipitation (bound proteins) while SN indicates supernatant (unbound proteins). Data are representative of n = 2 biological replicates. (D-E) BH3 profiling of non-mitotic and mitotic OVCAR3 cells that were treated with paclitaxel for 24 hours to measure apoptotic priming (D) or dependencies (E). Mean is shown for n = 3 biological replicates. (F) Immunoblotting of non-mitotic and mitotic OVCAR3 cells that were treated with paclitaxel at 20 nM for 24 hours.
Figure 6:
Figure 6:. HGSOC xenograft tumors are sensitive to combination treatment with paclitaxel and DT2216.
(A-B) Annexin/PI staining and flow cytometry analysis of platelets collected from mice (A) or humans (B) and treated in vitro with indicated BH3 mimetic or PROTAC. Mean is shown for n = 3 biological replicates. (C) OVCAR3 xenograft tumor growth in mice treated with indicated agents for indicated periods. (D-E) Weight (D) and platelet (E) measurements of mice treated with indicated agents. (F-G) BH3 profiling of OVCAR3 xenograft tumors at time of euthanasia treated with indicated agents to measure apoptotic priming (F) or dependencies (G). Mean is shown for n = 5 biological replicates. P values compare biological replicates in a one- or two-way ANOVA with Holm-Sidak’s adjustment for multiple comparisons.
Figure 7:
Figure 7:. HGSOC patient-derived xenograft (PDX) tumors are sensitive to combination treatment with paclitaxel and DT2216.
(A-B) BH3 profiling of OvCa PDX models to measure apoptotic priming (A) or dependencies (B). Mean is shown for n = 3–6 biological replicates. (C-D) BH3 profiling of DF83 PDX model during in vitro treatment with paclitaxel or carboplatin to measure apoptotic priming (C) or dependencies (D). Mean is shown for n = 3 biological replicates. (E) Immunoblotting analysis of indicated proteins in OvCa PDX models. (F) DF83 PDX tumor growth and survival of mice treated with indicated agents for indicated periods. (G-H) BH3 profiling of DF83 PDX tumors at time of euthanasia treated with indicated agents to measure apoptotic priming (G) or dependencies (H). Mean is shown for n = 3–5 biological replicates. (I) Immunoblotting of indicated proteins in DF83 PDX tumors at time of euthanasia treated with indicated agents. (J-K) Weight (J) and platelet counts (K) of mice treated with indicated agents. (L-M) BH3 profiling of platelets isolated from mice treated with indicated agents to measure apoptotic priming (L) or dependencies (M). Mean is shown for n = 7 biological replicates. (N) Annexin staining and quantification in EPCAM+ cells from DF83 xenograft tumor treated for 48 hours with indicated agents. Mean is shown for n = 4 biological replicates. (O) Immunoblotting analysis of indicated proteins in DF83 PDX tumors treated with indicated agents for 48 hours. Data in (A-D), (G-H) and (L-M) are shown from independent experiments with bars representing means from at least three independent experiments. P values were calculated using one- or two-way ANOVA with Holm-Sidak’s adjustment for multiple comparisons.

Similar articles

References

    1. Schmid B. C. & Oehler M. K. New perspectives in ovarian cancer treatment. Maturitas 77, 128–36 (2014). - PubMed
    1. Wang Z. C. et al. Profiles of Genomic Instability in High-Grade Serous Ovarian Cancer Predict Treatment Outcome. Clinical cancer research: an official journal of the American Association for Cancer Research 18, 5806–5815 (2012). - PMC - PubMed
    1. Verhaak R. G. W. et al. Prognostically relevant gene signatures of high-grade serous ovarian carcinoma. 123, 517–525 (2013). - PMC - PubMed
    1. Cancer Genome Atlas Research Network, T. et al. Integrated genomic analyses of ovarian carcinoma. Nature 474, 609–15 (2011). - PMC - PubMed
    1. Stickles X. B. et al. In vitro analysis of ovarian cancer response to cisplatin, carboplatin and paclitaxel identifies common pathways that are also associated with overall patient survival. British Journal of Cancer 106, 1967–1975 (2012). - PMC - PubMed

Publication types