[Preprint]. 2025 Jul 14:2025.06.22.660773.
doi: 10.1101/2025.06.22.660773.

TDP-43 pathology induces CD8+ T cell activation through cryptic epitope recognition

Affiliations

TDP-43 pathology induces CD8+ T cell activation through cryptic epitope recognition

Shahab Chizari et al. bioRxiv. .

Abstract

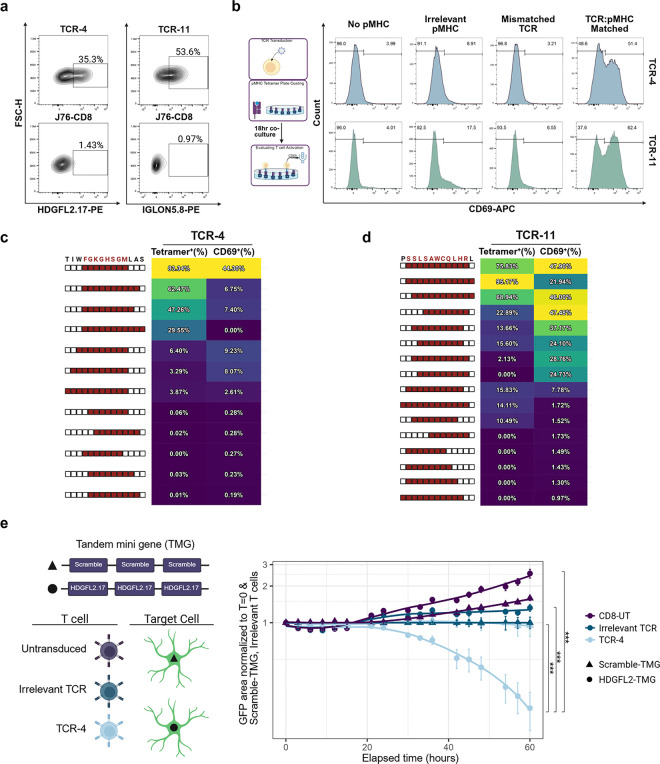
Aggregation and nuclear depletion of the RNA binding protein TDP-43 are the crucial pathological features of amyotrophic lateral sclerosis (ALS) and inclusion body myositis (IBM), two degenerative diseases of the CNS and muscle. The loss of TDP-43 nuclear function results in the aberrant inclusion of cryptic exons in mRNA transcripts, leading to the expression of de novo proteins. Clonally expanded and highly differentiated CD8+ T cells have been observed in individuals with TDP-43 proteinopathies and therapeutics modulating the T cell response have recently been found to extend survival. However, the target antigens mediating T cell activation have remained elusive. Here, we investigate whether the de novo proteins induced by aberrant cryptic splicing due to TDP-43 nuclear loss can act as neo-antigens. We detect the HDGFL2 cryptic peptide and multiple other TDP-43 cryptic exons in IBM skeletal muscle, where their presence correlates with enrichment of T cells and class I antigen presentation pathways. Furthermore, we identify epitopes deriving from HDGFL2 and IGLON5 cryptic peptides which are recognized by clonally expanded and functionally differentiated populations of CD8+ T cells in ALS and IBM Patients. Finally, we demonstrate that T cells engineered to express the identified TCRs can bind and activate in response to the cryptic peptide derived epitopes (cryptic epitopes) and are able to kill TDP-43 deficient astrocytes. This work identifies for the first time specific T cell antigens in ALS and IBM, directly linking adaptive immune response to TDP-43 pathology.


Conflict of interest statement

Competing interests: The University of Pennsylvania has applied for patents on the antigens and TCRs.

Figures

Extended Data Fig 1.
Extended Data Fig 1.. Additional data from the tissue proteomics.
(a) MHC-I and -II antigen processing pathway expression in controls and IBM cases, divided by condition and coloured based on the upper or lower 50% by TDP43 levels. (b) Normalized count distribution for the proteomics cohort. (c) GO analysis summary from the proteomics analysis. (d) PCA plot from normalised protein expression from the proteomics experiment. (e) PCA for the NHNN RNA-seq cohort. Note how the PCA from proteomics and that from RNA are fairly overlapping.
Extended Data Fig 2.
Extended Data Fig 2.. Additional data from RNA-seq analysis.
(a). IGV tracks for MYO18A cryptic exon in a subset of controls and IBM muscle biopsy RNA-seq. (b) PCA for the full RNA-seq cohort. The clear split between two groups in PC1 is likely driven by different library preparation methods. (c) Heatmap showing gene expression of genes with cryptic peptides in skeletal muscle and frontal cortex. Expression data obtained from ASCOT (d) IGV tracks for STMN2 cryptic exon in a subset of controls and IBM muscle biopsy RNA-seq. (e) RNA-seq normalized read counts for TCR constant chains (TRAC, TRBC1, and TRBC2), CD3E, HLA-A, HLA-B, HLA-C, and beta2-microglobulin (B2M) in control and IBM cases.
Fig. 1.
Fig. 1.. Cryptic peptides and MHC I / TCR pathways are found in IBM tissues.
(a) Schematic of the experimental workflow. IHC, proteomics, and RNA sequencing were used to analyze the expression of cryptic peptide, TCR, and MHC expression and T cell infiltration in IBM muscle tissues (left). Validated cryptic peptides were used to informatically predict epitopes binding to patient specific HLA molecules. Then, fluorescence labeled and DNA-barcoded pMHC tetramers were generated and used to sort cryptic epitope Tetramer+ CD8+ T cells for downstream single cell analysis and in vitro characterization (right). (b) Visualization of seriate immunohistochemistry staining for TDP-43, p62, and HDGFL2 cryptic peptide in muscle from one control and two IBM cases. For each case, arrows show colocalisation of HDGFL2 cryptic peptide in fibers with p62 and TDP-43 nuclear depletion and/or aggregation. (c) Semi-quantitative scores for immune infiltrates, TDP-43 loss, p62 and HDGFL2 cryptic peptide in control and IBM cases. (d) Normalized protein expression as quantified by mass spectrometry. The same group of four controls and 10 IBM cases were grouped based on the expression level of HDGFL2 cryptic peptide quantified by antibody in (c). Box plots show median and all points are shown. (e) Volcano plot showing upregulated splicing junctions upon TDP-43 knockdown in iPSC-derived skeletal muscles (circles) and iPSC-derived glutamatergic cortical neurons (triangles). (f) Normalized counts of RNA-seq reads covering cryptic exon junctions in controls (n = 15) and IBM cases (n = 25). (g) Correlation between RNA-seq normalized read counts for TCR ɑ and β constant chain genes (TRAC, TRBC1, and TRBC2), CD3E, HLA-A, HLA-B, HLA-C, and β2-microglobulin (B2M) and cryptic exon normalized counts in controls (n = 15) and IBM cases (n = 25).
Fig. 2.
Fig. 2.. TDP-43 dysfunction leads to a heterogenous and polyclonal CD8+ T cell response to cryptic epitopes.
(a) Representative FACS plot depicting cryptic epitope Tetramer+ cells (x-axis) and control viral Tetramer+ cells (y-axis) across three donors. (b) Summary of the complete data represented in (A). Cryptic epitope Tetramer+ CD8+ T cell frequency was normalized by the number of total pMHC Tetramers for each individual donor. Wilcoxon Rank Sum test was used to evaluate significance. (c) Violin plot of clone size normalized by starting number of CD8+ T cells across ALS, IBM, and healthy donors. The Wilcoxon Rank Sum test was used to evaluate significance. (d) T cell clonality per donor ordered by greatest to least clonality. Clones were stratified by their CDR3β according to the following bins: Hyperexpanded (15 < X <= 100), Large (10 < X <= 15), Medium (3 < X <= 10), Small (X = 2), Singleton (X = 1). (e) UMAP representation of single cells by a weighted nearest neighbor calculation of gene and surface protein expression. Clusters were manually annotated based on their differential gene and protein expression. Genes are italicized. (f) Donut graph of phenotypic composition across ALS, IBM, and healthy controls. (g) Tetramer specificity assignments on T cell clones overlaid on UMAP. Clonal specificities were assigned such that at least 60% of the cells in a given clonotype must share the same epitope assignment based on tetramer barcode sequencing. Cells that do not meet that threshold are colored grey. (h/i) Box plot visualization of tetramer barcode UMI counts for TCR-4 and TCR-11 with assigned specificities to HDGFL2.17 (left) and IgLON5.8 (right) epitopes. Each dot depicts an individual cell’s signal for each tetramer barcode (x-axis) within the specified clone. All tetramer barcodes were grouped into their parent cryptic protein except for the top hit (represented by the red box). All points are shown and center line represents median (j) Depiction of identified cryptic epitopes across HDGFL2 and IgLON5. Epitopes found to be targeted are marked by a bar which spans the epitope sequence. The tick marks within each bar represent different T cell clones targeting the same epitope and the distance within each tick represents the relative clone size. The color intensity represents the sum of all T cell clones targeting the particular epitope.
Fig. 3.
Fig. 3.. T cells with engineered cryptic epitope specific TCRs can bind and activate in response to cryptic epitopes.
(a) pMHC tetramer binding of J76-CD8 T cell expressing TCR-4 targeting the HDGFL2 epitope FGKGHSGM, and TCR-11 targeting the IgLON5 epitope SSLSAWCQLHR. (b) Flow cytometry histogram plots of CD69 upregulation following 18 hour incubation in a cryptic epitope tetramer coated plate across the following conditions: no pMHC coated on the plate, CMV pp65 (irrelevant) pMHC coated on the plate, irrelevant TCR co-cultured with the matched cryptic epitope pMHC, matched TCR co-cultured with the matched cryptic epitope pMHC. Results for TCR-4 (top row) and TCR-11 (bottom row) are shown. (c/d) Evaluation of pMHC tetramer binding and activation of J76-CD8 T cell expressing TCR-4 (c) and TCR-11 (d) across various possible epitope variations of identified cognate cryptic epitopes. The values shown on the heatmaps are background subtracted based on an irrelevant CMV pp65-specific TCR. (e) Constructs carrying HDGFL2.17 epitope or scramble epitope were transduced into CCF-STTG1-GFP astrocytes and co-incubated with primary CD8+ T cells transduced to express TCR-4 or irrelevant TCR or untransduced primary CD8+ T cells. GFP area over time was detected as a measure of cell death over time. GFP signals were normalized to the scramble construct with the irrelevant T cell condition. The Kolmogorov–Smirnov (two-sided) test was performed on possible differences in the means of the curves. The standard error for each normalized value is shown across four technical replicates.
Fig. 4.
Fig. 4.. HDGFL2 cryptic epitope specific CD8+ T cells can efficiently kill TDP-43 deficient astrocytes.
(a) siRNA knockdown and HDGFL2 cryptic exon PCR strategy diagram (left) and Tapestation trace of final HDGFL2 cryptic exon PCR product across control and TDP-43 knockdown (right). (b) Cytotoxicity of HDGFL2 cryptic epitope specific CD8+ T cells toward astrocyte-like cell line, CCF-STTG1-GFP, and its HLA-negative version, CCF-STTG1-GFP-β2M-shRNA, across time as measured by GFP expression. Three T cell conditions across control and siRNA TDP-43 knockdown were measured. CD8-TCR-4: human primary activated CD8+ T cells transduced to express TCR-4 and enriched via flow cytometry to be 100% tetramer positive using HDGFL2.17 pMHC tetramer; CD8-UT: primary activated and TCR untransduced CD8+ T cells from matching donor; No T cell: no T cells were added to the co-culture. GFP signals were normalized to the No T cell condition. The Kolmogorov–Smirnov (two-sided) test was performed on possible differences in the means of the curves between CD8-TCR-4 and CD8-UT in both panels. ***p = 8.305e-07. ns, p = 0.5041. (c) representative images of the CCF-STTG1-GFP:CD8-TCR-4 co-culture across TDP-43 (top) and control (bottom) siRNA knockdown. The red mask marks cells undergoing cell death as indicated by caspase 3/7 dye. The standard error for each normalized value is shown across three technical replicates.

References

    1. Neumann M., Sampathu D. M., Kwong L. K., Truax A. C., Micsenyi M. C., Chou T. T., Bruce J., Schuck T., Grossman M., Clark C. M., McCluskey L. F., Miller B. L., Masliah E., Mackenzie I. R., Feldman H., Feiden W., Kretzschmar H. A., Trojanowski J. Q. & Lee V. M.-Y. Ubiquitinated TDP-43 in Frontotemporal Lobar Degeneration and Amyotrophic Lateral Sclerosis. Science 314, 130–133 (2006). - PubMed
    1. de Boer E. M. J., Orie V. K., Williams T., Baker M. R., De Oliveira H. M., Polvikoski T., Silsby M., Menon P., van den Bos M., Halliday G. M., van den Berg L. H., Van Den Bosch L., van Damme P., Kiernan M., van Es M. A. & Vucic S. TDP-43 proteinopathies: a new wave of neurodegenerative diseases. J. Neurol. Neurosurg. Psychiatry 92, 86–95 (2021). - PMC - PubMed
    1. Ling J. P., Pletnikova O., Troncoso J. C. & Wong P. C. TDP-43 repression of nonconserved cryptic exons is compromised in ALS-FTD. Science 349, 650–5 (2015). - PMC - PubMed
    1. Brown A. L., Wilkins O. G., Keuss M. J., Hill S. E., Zanovello M., Lee W. C., Bampton A., Lee F. C. Y., Masino L., Qi Y. A., Bryce-Smith S., Gatt A., Hallegger M., Fagegaltier D., Phatnani H., Newcombe J., Gustavsson E. K., Seddighi S., Reyes J. F., Coon S. L., Ramos D., Schiavo G., Fisher E. M. C., Raj T., Secrier M., Lashley T., Ule J., Buratti E., Humphrey J., Ward M. E., Fratta P. & Consortium N. A. TDP-43 loss and ALS-risk SNPs drive mis-splicing and depletion of UNC13A. Nature 603, 131–137 (2022). - PMC - PubMed
    1. Seddighi S., Qi Y. A., Brown A. L., Wilkins O. G., Bereda C., Belair C., Zhang Y. J., Prudencio M., Keuss M. J., Khandeshi A., Pickles S., Kargbo-Hill S. E., Hawrot J., Ramos D. M., Yuan H., Roberts J., Sacramento E. K., Shah S. I., Nalls M. A., Colon-Mercado J. M., Reyes J. F., Ryan V. H., Nelson M. P., Cook C. N., Li Z., Screven L., Kwan J. Y., Mehta P. R., Zanovello M., Hallegger M., Shantaraman A., Ping L., Koike Y., Oskarsson B., Staff N. P., Duong D. M., Ahmed A., Secrier M., Ule J., Jacobson S., Reich D. S., Rohrer J. D., Malaspina A., Dickson D. W., Glass J. D., Ori A., Seyfried N. T., Maragkakis M., Petrucelli L., Fratta P. & Ward M. E. Mis-spliced transcripts generate de novo proteins in TDP-43-related ALS/FTD. Sci Transl Med eadg7162 (2024) doi: 10.1126/scitranslmed.adg7162. - DOI - PMC - PubMed

Publication types