[Preprint]. 2025 Aug 15:2025.06.18.660378.
doi: 10.1101/2025.06.18.660378.

Projection-Specific Intersectional Optogenetics for Precise Excitation and Inhibition in the Marmoset Brain

Affiliations

Projection-Specific Intersectional Optogenetics for Precise Excitation and Inhibition in the Marmoset Brain

Luke Shaw et al. bioRxiv. .

Abstract

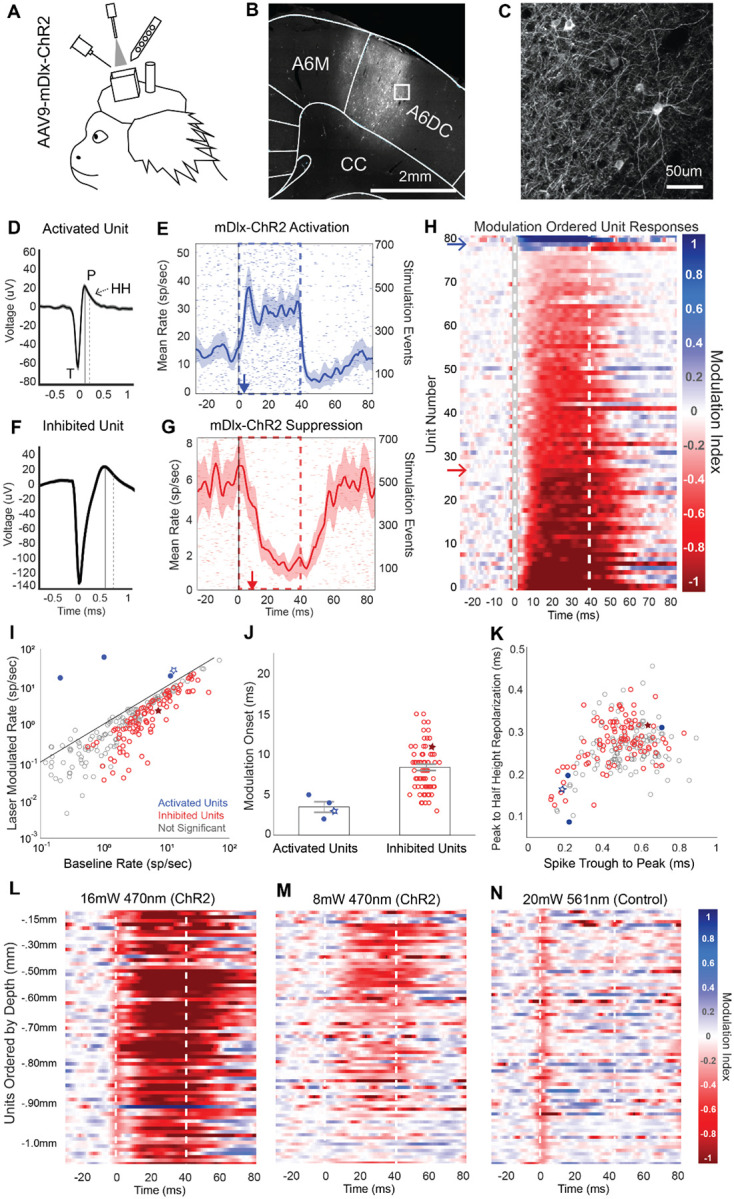
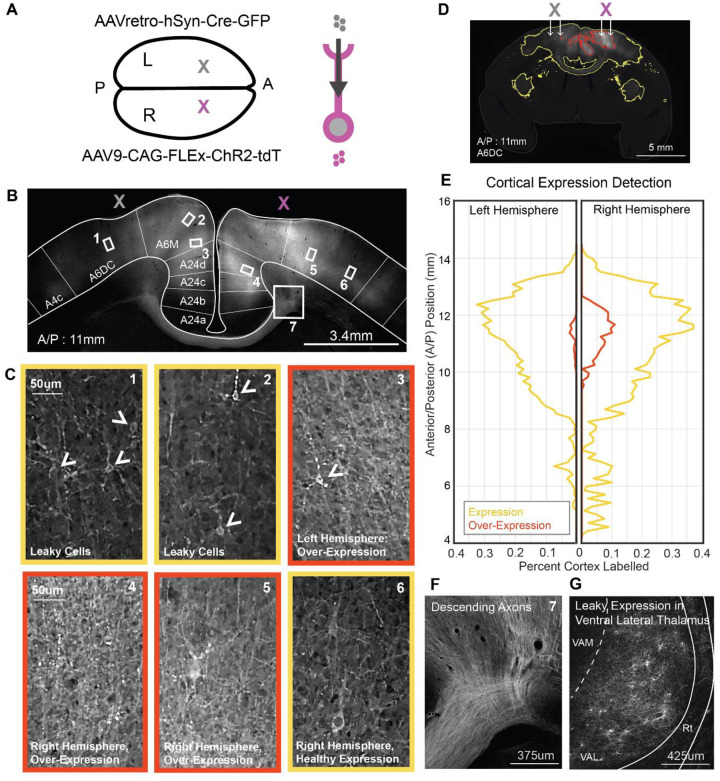
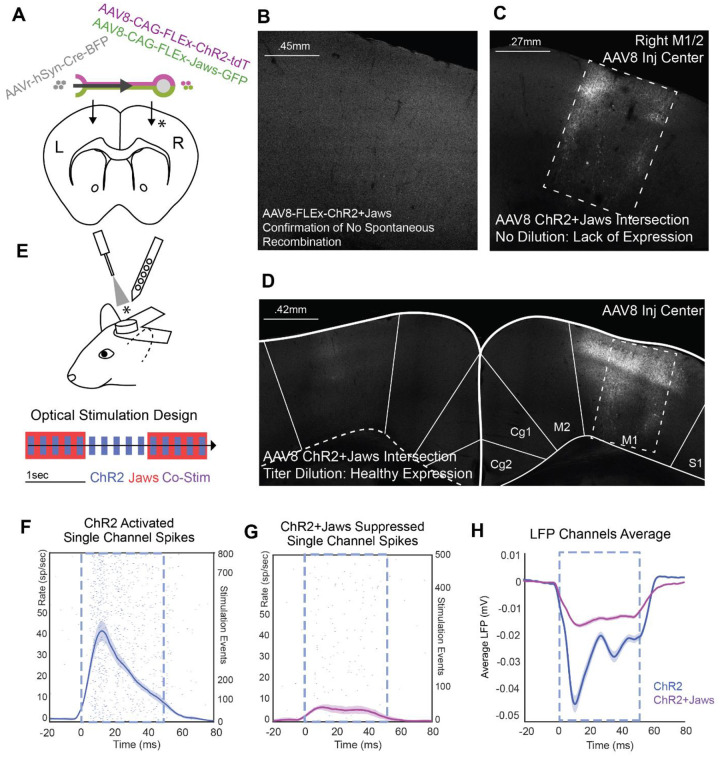
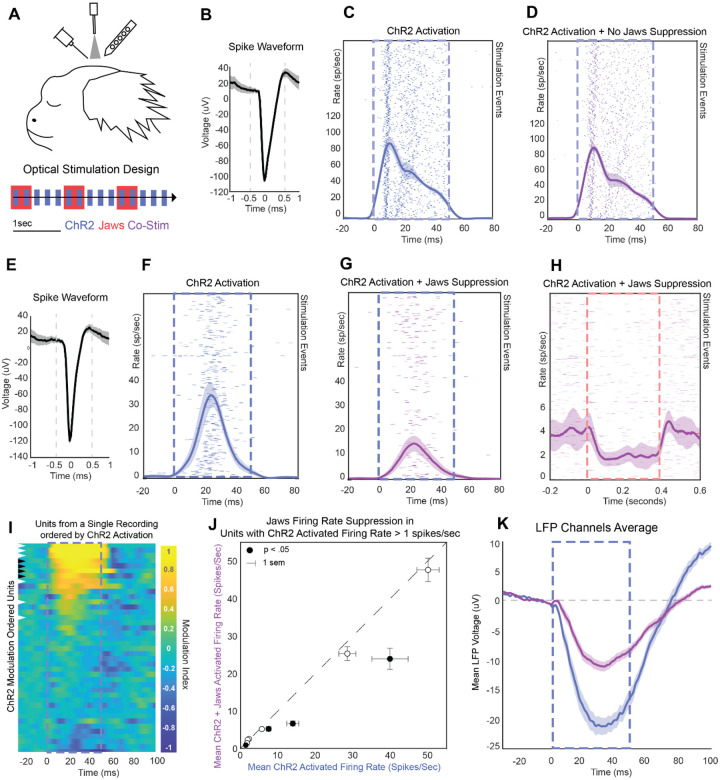
The primate cerebral cortex relies on long-range connections to integrate information across spatially distributed and functionally specialized areas, yet tools for selectively modulating these pathways remain limited. Here, we present an optimized intersectional viral and optogenetic strategy for precisely exciting and inhibiting projection-specific neurons in the common marmoset. Building on a mouse-to-marmoset pipeline, we first validated that optogenetic activation of inhibitory neurons (via AAV9-Dlx-ChR2) enables robust local cortical inhibition. We then combined retrograde delivery of Cre-recombinase (AAVretro-Cre) with locally injected Cre-dependent vectors encoding excitatory or inhibitory opsins (AAV8-FLEx-ChR2 or Jaws) to achieve directionally selective expression in callosal and frontoparietal pathways. Dual-opsin co-expression enabled precise stimulation or suppression of projection neurons in vivo with minimal off-target labeling. These results establish a scalable framework for projection-specific optogenetic interrogation of distributed circuits in primates, expanding the experimental toolkit for causal studies of higher-order brain function with enhanced anatomical precision and functional specificity.

Keywords: Cre recombinase; Dlx-enhancer; Intersectional optogenetics; adeno-associated virus; excitation and inhibition; laminar recording; marmosets; projection-specific; retrograde labeling.


Conflict of interest statement

CONFLICT OF INTEREST The authors declare no competing financial interests.

Figures

Figure 1.
Figure 1.. AAV9-mDlx-ChR2-mediated Local Cortical Inhibition in the Marmoset
A Electrophysiology during optical stimulation was conducted in an awake, head fixed marmoset freely viewing natural images. AAV9-mDlx-ChR2 was injected within a craniotomy over premotor area A6DC. B-C Native fluorescence of mDlx-ChR2+ inhibitory interneurons. D Average spike waveform of an excited unit. T indicates the trough of the spike. P indicates the post-depolarization voltage peak, marked in time by the solid line. HH indicates the half height of the repolarization voltage curve, which is marked in time by the dashed line. This unit is displayed as a red star in panels I-J. E Laser triggered PSTH of the unit in D. The red arrow indicates the modulation onset time. Shaded regions indicate ±2 standard errors of the mean (SEM). F Average spike waveform of an example suppressed unit. The solid and dashed lines indicate the peak and repolarization half height, as in D. This unit is displayed as a blue star in panels I-J. G Light triggered PSTH of the unit in F. The blue arrow indicates the modulation onset time. H Spike-sorted units ordered by degree of laser-induced firing modulation. Red indicates excitation; blue indicates suppression. Dotted lines indicate the laser stimulation period. Modulation index calculation is detailed in Methods. I Laser-triggered firing rate of units plotted against their baseline firing rate. Red points are significantly activated relative to baseline; blue points are suppressed. J Excited and inhibited units plotted by the onset of laser-triggered modulation. Onset was estimated by the first time point at which the laser-modulated firing rate rose above or fell below baseline ±2 SEM. K Spike waveforms characterized by trough (T) to peak (P) duration and peak (P) to repolarization half-height (HH) duration. L-N Blue laser (470 nm) power was reduced to test the modulation of laser-triggered optogenetic effect in a continuous recording. High-power green light (561 nm) was used as a control to confirm no neural suppression from laser-induced heating. Units are ordered by cortical depth. Apparent suppression at time 0 ms reflects software-based removal of spikes coinciding with the optical-electric artifact triggered by laser onset.
Figure 2.
Figure 2.. AAV9-based Intersectional Strategy Yields Efficient but Leaky Cross-Callosal ChR2 Expression
A Intersectional viruses were delivered to left (Cre-gray) and right (ChR2-magenta) A6DC in marmoset premotor cortex. B Example native fluorescence of tdTomato in premotor cortex at the section showing peak expression, with numbered boxes for subsequent zoom-ins. C Example cortical ROIs at the Cre injection site and ChR2 injection site showing native tdTomato fluorescence. Leaky expression is visible at the Cre site (arrowheads), with variable expression levels across cases. Panels with red borders highlight examples of over-expression, characterized by blebbing puncta and elevated parenchymal fluorescence. Panels outlined in yellow indicate typical expression patterns. D An example coronal section shows results of automated tissue classification based on native tdTomato fluorescence. Despite visible subcortical axonal labeling in the basal ganglia and claustrum, only cortical regions were included in quantification. E Both hemispheres showed widespread cortical labeling, quantified as the percent of cortical area exhibiting either healthy expression or over-expression relative to total cortical area in each coronal section. F Labeled decussating axons highlight the robustness of cross-callosal tdTomato expression. G “Leaky” somatic labeling by tdTomato was detected in motor-related thalamic regions, including Ventral Anterior Lateral Thalamus (VAL). VAM: Ventral Anterior Medial Thalamus; Rt: Reticular nucleus.
Figure 3.
Figure 3.. Evaluation and Titration of AAV8-Based Intersectional Jaws and ChR2 Expression in the Mouse Brain
A Design of a cross-callosal intersection strategy in the mouse using a 1:1 mixture of AAV8-FLEx-ChR2-tdTomato and AAV8-FLEx-Jaws-GFP injected into one hemisphere, and AAVretro-hSyn-Cre injected into the contralateral hemisphere. B Injection of AAV8-flex-ChR2+Jaws in the absence of Cre virus confirmed no unexpected recombination-related expression. This and subsequent panels present a grayscale composite of native tdTomato (ChR2) and GFP (Jaws) fluorescence signals. C Undiluted viral solutions produced poor expression around the injection site (dashed box), which could not be attributed to mechanical damage from the injection. D A 1:2 dilution of the AAV8-ChR2+Jaws mixture yielded healthy expression near the injection site (dashed box). Axon terminals were evident in the contralateral hemisphere at the AAVretro-Cre injection site. E Optical stimulation and electrophysiological recording design in head-fixed, awake mice. ChR2 stimulation pulses (blue) were delivered with or without concurrent long-duration Jaws pulses (red). Co-stimulation events are shown in purple. Recordings were obtained at the site of ChR2+Jaws injection. F ChR2 laser stimulation induced an increase in firing rate, as shown in the PSTH of multi-unit activity from a single recording channel (± 2 SEM). G During co-stimulation, the ChR2-driven excitation was effectively suppressed by Jaws stimulation. H This effect was evident in the grand average of local field potentials across multiple recording channels.
Figure 4.
Figure 4.. Efficient and Specific Cross-Callosal Intersectional Expression of ChR2 and Jaws using AAV8
A Intersection viruses were tested in the marmoset targeting the callosal projection from right A6DC/A4ab to left A6DC/A4ab. B Overview of the injection site in a coronal section, displaying a grayscale composite of native fluorescence of ChR2-tdTomato and Jaws-GFP. Squares indicate zoom-ins for panels C and F. C Zoom-in of the AAV8-ChR2 (magenta) + Jaws (green) injection site shows superficial and deep cortical layer expression. D Higher magnification from Panel C shows healthy soma and dendritic labelling. Circles mark neurons co-expression Jaws (green) and ChR2 (magenta). E Manual counts of labeled somata in right and left cortex show greater expression in the right hemisphere, indicating low leakiness. Each dot represents the number of labeled somata in a single coronal section. F Zoom-in of the Cre injection site shows robust axonal expression and limited leaky soma labeling. G Native ChR2-tdTomato fluorescence in the motor thalamus (Ventral Anterior Lateral nucleus, VAL) primarily reflects axonal labeling, with minimal leaky somatic expression, contrasting with the extensive somatic labeling observed with the AAV9 intersection strategy.
Figure 5.
Figure 5.. Efficient and Specific Premotor-Parietal Intersectional Expression of ChR2 and Jaws using AAV8
A Intersectional viruses were delivered to parietal (AAVretro-Cre) and premotor (AAV8-ChR2 + AAV8-Jaws) cortex in the marmoset. B–C Illustration of manual soma counting over coronal sections, with drawn brain perimeter and corpus callosum. Each counted cell is marked as grey (Cre+), green (Jaws+), or magenta (ChR2+). D Summary of manual soma quantification across sections, indicating expression of Jaws, ChR2, and co-expression. Each dot represents one counted section. E Example section at the center of the premotor injection site showing abundant Jaws+ cell bodies. F–G Higher magnification from panel E showing labeled Jaws+ and ChR2+ somata. H Two-channel overlay from the region highlighted in F–G, with white circles indicating co-labeled neurons. Jaws+: green; ChR2+: magenta. I Example section at the parietal injection center showing dense ChR2+ terminals. J Zoom-in from I showing abundant ChR2+ terminals in both deep and superficial layers. Lines mark the cortical surface and white matter boundary. K Zoom-in from I showing Cre+ cell nuclei but no detectable Jaws+ axons, based on anti-GFP/anti-BFP immunostaining. L Anterior parietal section showing additional ChR2+ terminals, absence of Jaws+ labeling, and a single putative leaky soma.
Figure 6.
Figure 6.. Excitation and Inhibition of Projection Neurons via Intersectional Co-Expression of ChR2 and Jaws
A Optogenetic testing was performed in an anesthetized marmoset. Corresponding histological data for this experiment are shown in Figure 5. Optical stimulation included 50 ms pulses of 480 nm light for ChR2 activation (blue, bottom inset), delivered either alone or in combination with 400 ms pulses of 561 nm light for Jaws activation (red), yielding ChR2-only or ChR2+Jaws co-stimulation conditions (purple). B–D Spike waveform and peri-stimulus time histogram (PSTH) for a single unit showing robust firing in response to ChR2 stimulation and minimal suppression during co-stimulation with Jaws. Shaded areas represent ±2 SEM. E–G A second example unit in the same format as B–D, showing marked suppression of ChR2-evoked firing during concurrent Jaws activation. H Time-locking this unit’s activity to the 400 ms Jaws pulses during co-stimulation reveals significant firing suppression relative to baseline. I Heatmap of ChR2 modulation effects across all units (yellow = excitation, blue = suppression), ordered by degree of ChR2-evoked modulation. Black and white arrowheads indicate the example units shown in B–G. J Scatterplot comparing the mean firing rate during ChR2-alone vs. ChR2+Jaws co-stimulation for units that exhibited >1 Hz ChR2-evoked increases over baseline. Black circles indicate units with significantly reduced firing during co-stimulation. K Mean population local field potential (LFP) traces show that Jaws co-stimulation reduced the ChR2-evoked LFP deflection by 62% at peak amplitude, indicating effective population-level suppression.

References

    1. Deisseroth K. (2014). Circuit dynamics of adaptive and maladaptive behaviour. Nature 505, 309–317. 10.1038/nature12982. - DOI - PMC - PubMed
    1. Felleman D.J., and Van Essen D.C. (1991). Distributed hierarchical processing in the primate cerebral cortex. Cereb Cortex 1, 1–47. 10.1093/cercor/1.1.1-a. - DOI - PubMed
    1. Boyden E.S., Zhang F., Bamberg E., Nagel G., and Deisseroth K. (2005). Millisecond-timescale, genetically targeted optical control of neural activity. Nat Neurosci 8, 1263–1268. 10.1038/nn1525. - DOI - PubMed
    1. El-Shamayleh Y., and Horwitz G.D. (2019). Primate optogenetics: Progress and prognosis. Proc Natl Acad Sci U S A 116, 26195–26203. 10.1073/pnas.1902284116. - DOI - PMC - PubMed
    1. Tremblay S., Acker L., Afraz A., Albaugh D.L., Amita H., Andrei A.R., Angelucci A., Aschner A., Balan P.F., Basso M.A., et al. (2020). An Open Resource for Non-human Primate Optogenetics. Neuron 108, 1075–1090 e1076. 10.1016/j.neuron.2020.09.027. - DOI - PMC - PubMed

Publication types

LinkOut - more resources