[Preprint]. 2025 Jun 26:2025.06.23.660389.
doi: 10.1101/2025.06.23.660389.

Synaptotagmin 1 and Synaptotagmin 7 promote MR1-mediated presentation of Mycobacterium tuberculosis antigens

Affiliations

Synaptotagmin 1 and Synaptotagmin 7 promote MR1-mediated presentation of Mycobacterium tuberculosis antigens

Se-Jin Kim et al. bioRxiv. .

Abstract

Mycobacterium tuberculosis (Mtb) is an intracellular pathogen that can be sensed by T cells, which are essential for the control of infection. In comparison to viral infections, Mtb antigens are relatively rare and hence, challenging to sample. Specialized antigen presentation pathways enable the presentation of such scarce antigens to CD8+ T cells, which are, thus, uniquely poised to survey intracellular environments. A subset of CD8+ T cells prevalent in the airways, known as mucosal associated invariant T (MAIT) cells, can be activated through the presentation of Mtb antigens via the MHC class I-related protein 1 (MR1) molecule. Prior work demonstrates that endosomal calcium signaling is critical for MR1-mediated presentation of Mtb-derived antigens. Here, we show that the calcium-sensing trafficking proteins Synaptotagmin (Syt) 1 and Syt7 specifically promote MAIT cell activation in response to Mtb-infected cells. In bronchial epithelial cells, Syt1 and Syt7 localize to late endo-lysosomes and MR1 vesicles. Loss of Syt1 and Syt7 results in enlarged MR1 vesicles and an increased number of MR1 vesicles in close proximity to Mtb-containing vacuoles during infection. This study identifies a novel pathway in which Syt1 and Syt7 facilitate the translocation of MR1 from Mtb-containing vacuoles, potentially to the cell surface for antigen presentation.


Conflict of interest statement

Competing interests The authors declare no competing interests.

Figures

Figure 1.
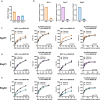
Figure 1.. Syt1 and Syt7 specifically mediate MR1 presentation of intracellular Mtb.
(a) Relative gene expression levels of Syt1 and Syt7 compared to Gapdh in BEAS-2B and PMA-differentiated THP-1 cells. (b) Genome editing efficiency and percent distribution of individual indels of Syt1 and Syt7 KO BEAS-2B cells as determined by Sanger sequencing and Interference of CRISPR Edits (ICE). (c) IFN-γ release by T cell clones (MR1- and HLA-B45-restricted) co-cultured with H37Rv Mtb-infected (MOI=8) WT, Syt1 KO, or Syt7 KO BEAS-2B cells, represented as spot forming units (SFU). (d) IFN-γ release by T cell clones (MR1- and HLA-B45-restricted) co-cultured with WT, Syt1 KO, or Syt7 KO BEAS-2B cells in the presence of Msmeg supernatant, CFP102–9 peptide, or (e) 5-A-RU prodrug, represented as SFU. All data are plotted as mean±SEM and pooled from three independent experiments. For (c-e), the means of technical duplicates were pooled, and non-linear regression analysis of pairwise comparison to WT on best-fit values of top and EC50 were used to calculate p-values by extra sum-of-squares F test.
Figure 2.
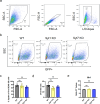
Figure 2.. Syt1 and Syt7 do not affect Mtb uptake and growth.
(a) Gating strategy of BEAS-2B cells infected overnight with auxotrophic strain mEmeraldRFP-AuxMtb (MOI=8) by gating on cells, excluding doublets using forward scatter properties, and selecting Live/Dead Near-IR stain negative cells. (b) Representative gate on GFP+ population to indicate live BEAS-2B cells infected with mEmeraldRFP-AuxMtb. (c) Percent Mtb uptake measured as proportion of live WT, Syt1 KO, or Syt7 KO BEAS-2B cells that are GFP+. (d) Colony forming units (CFU) of H37Rv Mtb in WT, Syt1 KO, or Syt7 KO BEAS-2B cells after overnight infection (MOI=8). (e) Relative gene expression levels of Mr1 compared to Gapdh in WT, Syt1 KO, or Syt7 KO BEAS-2B cells. All data are plotted as mean±SEM. (c-d) are pooled from three independent experiments and (e) is pooled from two independent experiments. For (c-e), ordinary one-way ANOVA with Dunnett’s multiple comparisons test were used to analyze significant differences. ns=not significant (p>0.05).
Figure 3.
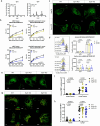
Figure 3.. Syt1 and Syt7 also mediate MR1 presentation of Mtb in THP-1 cells.
(a) Genome editing efficiency and percent distribution of individual indels of Syt1 and Syt7 KO THP-1 cells as determined by Sanger sequencing and ICE analysis. (b) IFN-γ release by MAIT cell clones co-cultured with H37Rv Mtb-infected (MOI=1) WT, Syt1 KO, or Syt7 KO THP-1 cells following PMA differentiation, represented as SFU. (c) IFN-γ release by MAIT cell clones co-cultured with WT, Syt1 KO, or Syt7 KO THP-1 cells following PMA differentiation in the presence of Msmeg supernatant, represented as SFU. All data are plotted as mean±SEM and pooled from three independent experiments. For (b-c), the means of technical duplicates were pooled, and non-linear regression analysis of pairwise comparison to WT on best-fit values of top and EC50 were used to calculate p-values by extra sum-of-squares F test.
Figure 4.
Figure 4.. Syt11 and ER-associated Esyt1 and Esyt2 do not solely affect MR1 presentation of Mtb.
(a) Relative gene expression levels of Syt11, Esyt1, and Esyt2 compared to Gapdh in BEAS-2B cells. (b) Knockdown efficiency of Syt11, Esyt1, and Esyt2 after 48 hours of knockdown with missense (Mis) or gene-specific (KD) siRNA. (c-e) IFN-γ release by T cell clones (MR1- and HLA-B45-restricted) co-cultured with BEAS-2B cells following siRNA knockdown of Syt11 (c), Esyt1 (d), or Esyt2 (e). Cells were either infected overnight with H37Rv Mtb (MOI=8) or incubated with exogenously added antigens (Msmeg supernatant and CFP102–9 peptide). IFN-γ release is represented as SFU. All data are plotted as mean±SEM and pooled from three independent experiments. For (c-e), the means of technical duplicates were pooled, and non-linear regression analysis comparing best-fit values of top and EC50 were used to calculate p-values by extra sum-of-squares F test.
Figure 5.
Figure 5.. Syt1 and Syt7 localize to late endo-lysosomes and MR1 vesicles.
(a) BEAS-2B cells transfected with Syt1- or Syt7-RFP (magenta) plasmids and incubated with CellLight BacMam 2.0 reagents for Rab5a, Rab7a, and LAMP1 (yellow) overnight. Images are representative of two independent experiments (b) Percent co-localization of Rab5a (n=9), Rab7a (n=12), and LAMP1 (n=10) with Syt1 or Syt7. Data are pooled from two independent experiments and plotted as mean±SEM. Each dot represents one cell. (c) Polyclonal BEAS-2B:TET-MR1GFP (green) cells transfected overnight with Syt1- or Syt7-RFP (magenta) plasmids. Images are representative of three independent experiments. (d) Percent co-localization of Syt1 or Syt7 with MR1 (n=17). Data are pooled from three independent experiments and plotted as mean±SEM. Each dot represents one cell. Two-way ANOVA with Sidak’s multiple comparisons test (b) and two-tailed unpaired Student’s t-test (d) were used to calculate p-values. All scale bars represent 10 μm.
Figure 6.
Figure 6.. Absence of Syt1 and Syt7 alters MR1 cellular distribution in lysosomal compartments.
Syt1 KO and Syt7 KO were generated in the background of BEAS-2B MR1KO:tetMR1-GFP clone D4 cells. (a) Syt1 and Syt7 KO clones were verified by Sanger sequencing and analyzed using the ICE tool. (b) IFN-γ release by T cell clones (MR1- and HLA-B45-restricted) co-cultured with H37Rv Mtb-infected cells (MOI=8) is represented as SFU. The means of technical duplicates were pooled from three independent experiments, and non-linear regression analysis comparing best-fit values of top and EC50 were used to calculate p-values by extra sum-of-squares F test. (c-d) WT, Syt1 KO, and Syt7 KO BEAS-2B MR1KO:tetMR1-GFP cells were incubated overnight with doxycycline and Ac-6-FP or NaOH (solvent control). Images (c) and histograms (d, left) representative of three independent experiments with pooled geometric mean fluorescence intensity (GeoMFI) (d, right) of surface MR1 and HLA-Ia expression. (e) Representative images of WT, Syt1 KO, Syt7 KO EAS-2B MR1KO:tetMR1-GFP cells incubated overnight with doxycycline and (f) measurement of area of MR1 vesicles, classified into small (1 vesicle) or large (>1 vesicle) vesicles (n=15). Each dot represents one cell. Data are pooled from three independent experiments. (g) Representative images of WT, Syt1 KO, Syt7 KO BEAS-2B MR1KO:tetMR1-GFP cells incubated overnight with doxycycline and CellLight BacMam 2.0 reagents for Rab5a and LAMP1 (yellow). (h) Percent co-localization of Rab5a (n=16) and LAMP1 (n=16) with MR1 vesicles. Each dot represents one cell. Data are pooled from four independent experiments. For (d, f, h), p-values were analyzed by two-way ANOVA with Dunnett’s multiple comparisons test. All data are plotted as mean±SEM. All scale bars represent 10 μm.
Figure 7.
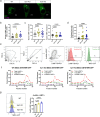
Figure 7.. Syt1 and Syt7 mediate trafficking of MR1 vesicles from the Mtb-containing vacuole.
(a) WT, Syt1 KO, Syt7 KO BEAS-2B MR1KO:tetMR1-GFP (green) cells were infected with AuxMtb (MOI=5) labeled with Alexa Fluor 555 Succinimidyl Ester (AuxMtb-Alexa Fluor555; magenta). Images representative of three independent experiments are shown. Scale bars represent 10 μm. (b) Number of MR1 vesicles within 1 μm of the center of the AuxMtb surface (n=16). (c) Total number (left, n=15) and average speed (μm/s) (right, n=14) of MR1 vesicles. (d) Overlapped area ratio of MR1 to Mtb surfaces (n=23). For (b-d), data are plotted as mean±SEM and pooled from four to five independent experiments. Each dot represents one cell. P-values were analyzed by a one-way ANOVA with Dunnett’s multiple comparisons test. (e) WT, Syt1 KO, Syt7 KO BEAS-2B MR1KO:tetMR1-GFP cells were infected overnight with AuxMtb (MOI=10) labeled with Alexa Fluor 647 Succinimidyl Ester. Mtb-containing vacuoles for each fraction from flow organellometry assay were identified by gating on vesicles, excluding doublets using forward scatter properties, and selecting the AuxMtb+LAMP1+ population (left). Total Lamp1+ and MR1+ populations were gated following the same strategy (right). Representative histograms comparing fractions 40 and 46 are shown. (f) Graphs representative of three independent experiments showing the frequency of total LAMP1+, total MR1+, and AuxMtb+LAMP1+ vesicles of all vesicles from fractions 36 to 50. (g) Representative histogram and geometric mean fluorescence intensity (GeoMFI) of MR1 in the subcellular fraction with the highest percentage of AuxMtb+LAMP1+ vesicles. Data are pooled from three independent experiments and plotted as mean±SEM. P-values were analyzed by a one-way ANOVA with Dunnett’s multiple comparisons test.

Similar articles

References

    1. Global Tuberculosis Report 2024. (World Health Organization, Geneva, 2024).
    1. Bermudez L. E. & Goodman J. Mycobacterium tuberculosis invades and replicates within type II alveolar cells. Infect. Immun. 64, 1400–1406 (1996). - PMC - PubMed
    1. Pai M. et al. Tuberculosis. Nat. Rev. Dis. Primer 2, 16076 (2016). - PubMed
    1. Cohen S. B. et al. Alveolar Macrophages Provide an Early Mycobacterium tuberculosis Niche and Initiate Dissemination. Cell Host Microbe 24, 439–446.e4 (2018). - PMC - PubMed
    1. Armstrong J. A. & Hart P. D. Response of cultured macrophages to Mycobacterium tuberculosis, with observations on fusion of lysosomes with phagosomes. J. Exp. Med. 134, 713–740 (1971). - PMC - PubMed

Publication types