

This is a preprint.
Disrupted Energy Landscape in Individuals with Mild Cognitive Impairment: Insights from Network Control Theory
- PMID: 40667091
- PMCID: PMC12262368
- DOI: 10.1101/2025.06.19.660545
Disrupted Energy Landscape in Individuals with Mild Cognitive Impairment: Insights from Network Control Theory
Abstract
Introduction: Patients with mild cognitive impairment (MCI) have shown disruptions in both brain structure and function, often studied separately. However, understanding the relationship between brain structure and function can provide valuable insights into this early stage of cognitive decline for better treatment strategies to avoid its progression. Network Control Theory (NCT) is a multi-modal approach that captures the alterations in the brain's energetic landscape by combining the brain's functional activity and the structural connectome. Our study aims to explore the differences in the brain's energetic landscape between people with MCI and healthy controls (HC).
Methods: Four hundred ninety-nine HC and 55 MCI patients were included. First, k-means was applied to functional MRI (fMRI) time series to identify commonly recurring brain activity states. Second, NCT was used to calculate the minimum energy required to transition between these brain activity states, otherwise known as transition energy (TE). The entropy of the fMRI time series as well as PET-derived amyloid beta (Aβ) and tau deposition were measured for each brain region. The TE and entropy were compared between MCI and HC at the network, regional, and global levels using linear models where age, sex, and intracranial volume were added as covariates. The association of TE and entropy with Aβ and tau deposition was investigated in MCI patients using linear models where age, sex, and intracranial volume were controlled.
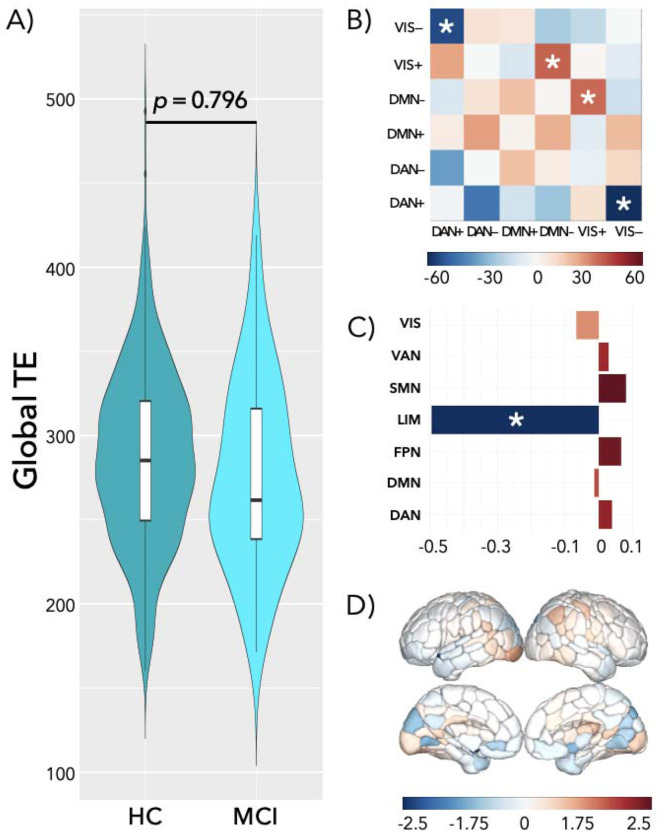
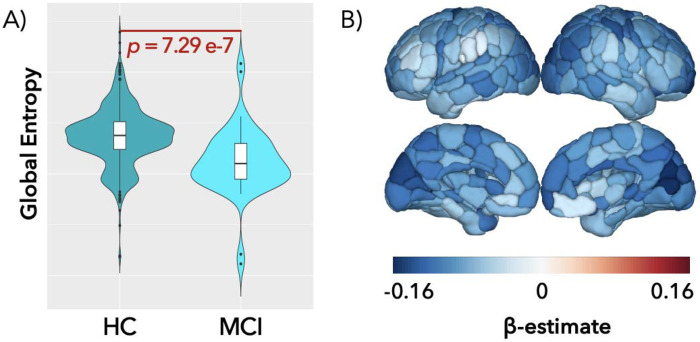
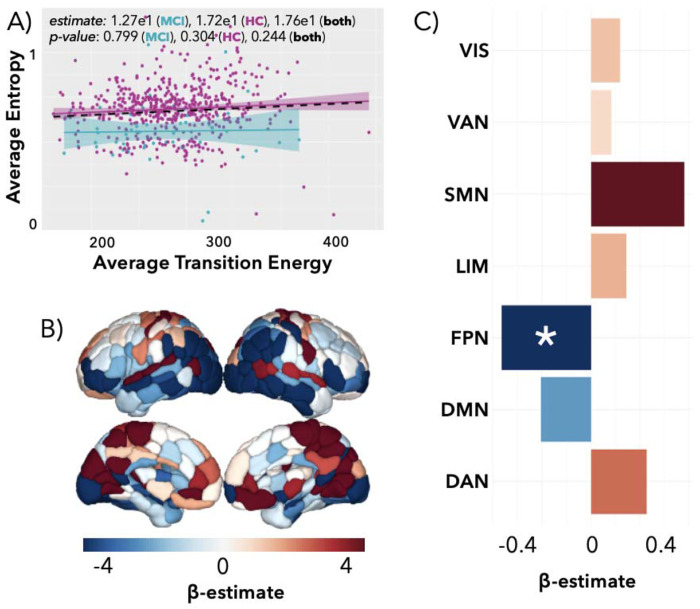
Results: Commonly recurring brain activity states included those with high and low amplitude activity in visual (+/-), default mode (+/-), and dorsal attention (+/-) networks. Compared to HC, MCI patients required lower transition energy in the limbic network (adjusted p = 0.028). Decreased global entropy was observed in MCI patients compared to HC (p = 7.29e-7). There was a positive association between TE and entropy in the frontoparietal network (p = 7.03e-3). Increased global Aβ was associated with higher global entropy in MCI patients (ρ = 0.632, p = 0.041).
Conclusion: Lower TE in the limbic network in MCI patients may indicate either neurodegeneration-related neural loss and atrophy or a potential functional upregulation mechanism in this early stage of cognitive impairment. Future studies that include people with AD are needed to better characterize the changes in the energetic landscape in the later stages of cognitive impairment.
Keywords: entropy; functional MRI; mild cognitive impairment; network control theory.
Conflict of interest statement
Disclosure of competing interests The co-authors declare that they have no competing interest.
Figures


References
-
- Bookheimer S. Y., Salat D. H., Terpstra M., Ances B. M., Barch D. M., Buckner R. L., Burgess G. C., Curtiss S. W., Diaz-Santos M., Elam J. S., Fischl B., Greve D. N., Hagy H. A., Harms M. P., Hatch O. M., Hedden T., Hodge C., Japardi K. C., Kuhn T. P., … Yacoub E. (2019). The Lifespan Human Connectome Project in Aging: An overview. NeuroImage, 185, 335–348. 10.1016/j.neuroimage.2018.10.009 - DOI - PMC - PubMed
-
- Brickman A. M., Guzman V. A., Gonzalez-Castellon M., Razlighi Q., Gu Y., Narkhede A., Janicki S., Ichise M., Stern Y., Manly J. J., Schupf N., & Marshall R. S. (2015). Cerebral autoregulation, beta amyloid, and white matter hyperintensities are interrelated. Neuroscience Letters, 592, 54–58. 10.1016/j.neulet.2015.03.005 - DOI - PMC - PubMed
-
- Broeders T. A. A., van Dam M., Pontillo G., Rauh V., Douw L., van der Werf Y. D., Killestein J., Barkhof F., Vinkers C. H., & Schoonheim M. M. (2024). Energy Associated With Dynamic Network Changes in Patients With Multiple Sclerosis and Cognitive Impairment. Neurology, 103(9), e209952. 10.1212/WNL.0000000000209952 - DOI - PMC - PubMed
Publication types
Grants and funding
LinkOut - more resources
Full Text Sources