[Preprint]. 2025 Jun 24:2025.06.19.660629.
doi: 10.1101/2025.06.19.660629.

CFIm25-Dependent Alternative Polyadenylation in AKT2 mRNA Programs Macrophage Polarization

Affiliations

CFIm25-Dependent Alternative Polyadenylation in AKT2 mRNA Programs Macrophage Polarization

Srimoyee Mukherjee et al. bioRxiv. .

Abstract

Macrophage polarization is essential for immune responses, tissue homeostasis, and progression of many diseases. It is a tightly regulated process involving an intricate network of signaling pathways and control mechanisms at the level of transcription, alternative mRNA splicing, translation and mRNA stability. However, regulation through alternative mRNA polyadenylation (APA), remains poorly understood. This study explores the function of CFIm25, a key APA regulator, in macrophage polarization. Our findings show that CFIm25 overexpression drives M1 polarization, as evident from increased nitric oxide synthase activity, CD80 expression, and pro-inflammatory cytokine secretion, but dampens the M2 phenotype. Conversely, CFIm25 knockdown suppresses M1 traits and promotes M2 characteristics. Functionally, CFIm25 enhances phagocytosis, migration, and cancer cell inhibition. Mechanistically, CFIm25 favors proximal polyadenylation site usage of AKT2 mRNA, increasing Akt2 protein levels to support M1 polarization. Blocking this site with an antisense oligonucleotide reduces Akt2 expression and M1 traits. These findings establish CFIm25 as a crucial regulator of macrophage identity, offering insights into RNA-based immune regulation and potential therapeutic targets.

Keywords: AKT2; APA; CFIm25; M1/M2 macrophages; Macrophage polarization; NF-κB signaling.


Conflict of interest statement

Declaration of interests No competing interests.

Figures
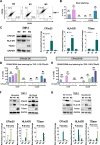
Figure 1.
Figure 1.. CFIm25 alteration drives macrophage surface marker expression in THP-1 cells
(A) Representative flow cytometry dot plots showing dual staining of M0, M1, and M2 polarized THP-1 cells for CD80 (M1 marker) and CD206 (M2 marker). Numbers indicate percentage of cells in each quadrant. (B) Quantification of flow cytometry data showing percentage of cells expressing CD80 and CD206 surface markers in M0, M1, and M2 polarized states. (C) Left: Western blot analysis of CFIm25, HLA-DR (M1 marker), and TGase (M2 marker) protein levels in M0, M1, and M2 polarized THP-1 cells. GAPDH serves as loading control. Right: Densitometric quantification of protein levels normalized to M0 state. (D) Flow cytometry analysis of CD80 and CD206 expression in CFIm25-overexpressing (OE) THP-1 cells under M0, M1, and M2 polarizing conditions. (E) Flow cytometry analysis of CD80 and CD206 expression in CFIm25-knockdown (KD) THP-1 cells under M0, M1, and M2 polarizing conditions. (F) Top: Western blot analysis comparing control and CFIm25-overexpressing THP-1 cells for expression of CFIm25, HLA-DR, and TGase under different polarization conditions. GAPDH serves as loading control. Bottom: Densitometric quantification of protein levels normalized to respective controls. (G) Top: Western blot analysis comparing control and CFIm25-knockdown THP-1 cells for expression of CFIm25, HLA-DR, and TGase under different polarization conditions. GAPDH serves as loading control. Bottom: Densitometric quantification of protein levels normalized to respective controls. For all experiments, data are normalized to respective controls and shown as mean ± SEM from three independent experiments. ***p < 0.001, **p < 0.01, *p < 0.05.
Figure 2.
Figure 2.. CFIm25 regulates macrophage biochemical properties in THP-1 cells
(A) Analysis of Nitric oxide synthase (NOS) and Arginase (Arg) activity in CFIm25-overexpressing (OE) THP-1 cells. Left: NOS activity measured by DAF-FM DA fluorescence in M0, M1, and M2 polarized cells with or without CFIm25 OE. Right: Arginase activity assay in the same conditions. (B) Analysis of NOS and arginase in CFIm25-knockdown (KD) HL-60 cells. Left: NOS activity measured by DAF-FM DA fluorescence in M0, M1, and M2 polarized cells with or without CFIm25 KD. Right: Arginase activity assay in the same conditions. For A-B, data are normalized to respective controls (M0 state) (C) ELISA measurement of M1 cytokines in CFIm25 OE cells. Left: TNF-α levels in M0, M1, and M2 conditions. Right: IL-12 levels in the same condition. (D) ELISA measurement of M1 cytokines in CFIm25 KD cells. Left: TNF-α levels in M0, M1, and M2 conditions. Right: IL-12 levels in the same condition. (E) ELISA measurement of M2 cytokines in CFIm25 OE cells. Left: TGF-β levels in M0, M1, and M2 conditions. Right: IL-10 levels in the same conditions. (F) ELISA measurement of M2 cytokines in CFIm25 KD cells. Left: TGF-β levels in M0, M1, and M2 conditions. Right: IL-10 levels in the same conditions. For C-F, data is represented as relative fluorescence units and are shown as mean ± SEM from three independent experiments **p < 0.01, *p < 0.05.
Figure 3.
Figure 3.. CFIm25 regulates core macrophage functions in THP-1 cells
Phagocytic activity in CFIm25-overexpressing (OE) THP-1 cells. Flow cytometry analysis of fluorescently labeled IgG-coated latex bead uptake in M0, M1, and M2 polarized cells with or without CFIm25 OE. Data shown as percentage of fluorescent cells, mean ± SEM from three independent experiments. **p < 0.01. (B) Phagocytic activity in M0, M1, and M2 polarized THP-1 cells with or without CFIm25 knockdown (KD). Data shown as percentage of fluorescent cells, mean ± SEM from three independent experiments. **p < 0.01. (C) Migration assay for CFIm25 OE cells. Quantification of cell migration through Transwell membranes in response to LPS. Data normalized to M0 control cells, mean ± SEM from three independent experiments. *p < 0.05. (D) Migration assay for CFIm25 KD cells. Data normalized to M0 control cells, mean ± SEM from three independent experiments. **p < 0.01, ***p < 0.001. (E) Cytotoxic activity of CFIm25-overexpressing macrophages against cancer cells. Indirect co-culture assay assessing the viability of breast cancer (MDA-MB-231) and pancreatic cancer (Mia-PaCa2) cells cultured in the lower chamber, with M1 or M2 polarized macrophages—with or without CFIm25 overexpression—seeded in the upper chamber separated by a permeable membrane. (F) Cytotoxic activity of CFIm25-overexpressing macrophages against cancer cells. Indirect co-culture assay assessing the viability of breast cancer (MDA-MB-231) and pancreatic cancer (Mia-PaCa2) cells cultured in the lower chamber, with M1 or M2 polarized macrophages—with or without CFIm25 knockdown—seeded in the upper chamber separated by a permeable membrane. Data are presented as percentage of viable cancer cells (mean ± SEM, n = 3 independent experiments). **p < 0.01, *p < 0.05.
Figure 4.
Figure 4.. CFIm25 affects polarization by alternative polyadenylation of AKT2
(A) Schematic representation of AKT2 mRNA showing the coding sequence (CDS), positions of proximal and distal polyadenylation (pA) sites (red lightning bolts), and locations of primer pairs used for total and long isoform detection (green arrows). (B) Analysis of AKT2 in M1 and M2 polarized THP-1 cells. Left: APA analysis showing Log2 ratio of long/total AKT2 mRNA. Right: Log2 fold change in total AKT2 mRNA levels. Bottom: Western blot showing Akt2 protein levels, with GAPDH as loading control. (C) Impact of CFIm25 overexpression on Akt2. Left: APA analysis showing Log2 ratio of long/total AKT2 mRNA in control and CFIm25 OE cells. Right: Log2 fold change in total AKT2 mRNA levels. Bottom: Western blot showing Akt2 protein levels, with Actin as loading control. (D) Effect of AKT2 proximal polyadenylation site blockade using antisense morpholino oligonucleotides (AMO). Left: APA analysis showing Log2 ratio of long/total AKT2 mRNA. Middle: Log2 fold change in total AKT2 mRNA levels. Right: Western blot showing Akt2 protein levels in M1 polarized cells, with GAPDH as loading control. Data for A-D are normalized to respective controls (E) Effect of AKT2 pA AMO on macrophage surface markers by dual staining. Figure shows quantification of flow cytometry data showing percentage of cells expressing CD80 and CD206 surface markers in M1 polarized cells with or without AKT2 pA AMO (F) NOS activity measured by DAF-FM DA fluorescence in M1 polarized cells with or without AKT2 AMO. (G) Arginase activity assay in M1 polarized cells with or without AKT2 AMO. (H) Arginase gene expression by qRT-PCR in M1 polarized cells with or without AKT2 AMO. (I) Impact of AKT2 AMO on cytokine production. Left: M1 cytokines (TNF-α and IL-12) levels. Right: M2 cytokines (TGF-β and IL-10) levels measured by ELISA For all experiments, data is shown as mean ± SEM from three independent experiments. ***p < 0.001, **p < 0.01, *p < 0.05. (J) Western blot analysis of NF-κB pathway components in M1 polarized cells treated with control or AKT2 pA AMO for phospho-p65, total NF-κB p65 and IκB-α where GAPDH serves as loading control.

Similar articles

References

    1. Italiani P., and Boraschi D. (2014). From Monocytes to M1/M2 Macrophages: Phenotypical vs. Functional Differentiation. Front Immunol 5, 514. 10.3389/fimmu.2014.00514. - DOI - PMC - PubMed
    1. Shapouri-Moghaddam A., Mohammadian S., Vazini H., Taghadosi M., Esmaeili S.A., Mardani F., Seifi B., Mohammadi A., Afshari J.T., and Sahebkar A. (2018). Macrophage plasticity, polarization, and function in health and disease. J Cell Physiol 233, 6425–6440. 10.1002/jcp.26429. - DOI - PubMed
    1. Wang S., Wang J., Chen Z., Luo J., Guo W., Sun L., and Lin L. (2024). Targeting M2-like tumor-associated macrophages is a potential therapeutic approach to overcome antitumor drug resistance. NPJ Precis Oncol 8, 31. 10.1038/s41698-024-00522-z. - DOI - PMC - PubMed
    1. Wang N., Liang H., and Zen K. (2014). Molecular mechanisms that influence the macrophage m1-m2 polarization balance. Front Immunol 5, 614. 10.3389/fimmu.2014.00614. - DOI - PMC - PubMed
    1. Guillemin A., Kumar A., Wencker M., and Ricci E.P. (2021). Shaping the Innate Immune Response Through Post-Transcriptional Regulation of Gene Expression Mediated by RNA-Binding Proteins. Front Immunol 12, 796012. 10.3389/fimmu.2021.796012. - DOI - PMC - PubMed

Publication types

LinkOut - more resources