[Preprint]. 2025 Jun 27:2025.06.25.661608.
doi: 10.1101/2025.06.25.661608.

Harnessing fusion of genome-edited human stem cells to rapidly screen for novel protein functions in vivo

Affiliations

Harnessing fusion of genome-edited human stem cells to rapidly screen for novel protein functions in vivo

Samantha L Smith et al. bioRxiv. .

Abstract

Genome editing has enabled the integration of fluorescent protein coding sequences into genomes, resulting in expression of in-frame fusion proteins under the control of their natural gene regulatory sequences. While this technique overcomes the well-documented artifacts associated with gene overexpression, editing genomes of metazoan cells incurs a significant time cost compared to simpler organisms, such as yeast. Editing two or more genes to express multiple fluorescent fusion proteins in a single cell line has proven to be a powerful strategy for uncovering spatio-dynamic, and therefore functional, relationships among different proteins, but it can take many months to edit each gene within the same cell line. Here, by utilizing cell fusions, we quickly generated cells expressing pairwise permutations of fluorescent fusion proteins in genome-edited human cells to reveal previously undetected protein-organelle interactions. We fused human induced pluripotent stem cells (hiPSCs) that express in-frame fusions of clathrin-mediated endocytosis (CME) and actin cytoskeleton proteins with hiPSCs that express fluorescently tagged organelle markers, uncovering novel interactions between CME proteins, branched actin filament networks, and lysosomes.


Conflict of interest statement

Competing Interests The authors declare no competing interest.

Figures

Figure 1.
Figure 1.
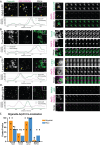
(A) Total Internal Reflection Fluorescence (TIRF) still image showing the two parent cells co-cultured without PEG fusogen where the magenta and green signals reside in different cells (left), and the two parent cells co-cultured with fusogen where the magenta and green signals are now present in the same fused cells (right). Scale bar = 40μm. (B) Inset from the fused cell image in the yellow box in (A) showing co-localization of DNM2-GFP and Clta-RFP (yellow arrowheads). Scale bar = 5 μm. (C) Flow cytometry data from a fusion experiment. The signal from the PE laser (RFP) is on the x-axis, and the signal from the FITC laser (GFP) is on the y-axis. The first plot represents the DNM2-GFP parent cell line, the second plot represents the Clta-RFP parent cell line, the third plot represents the two parent cells co-cultured without fusogen, and the fourth plot represents the two parent cells co-cultured with fusogen. Quadrants are gated to measure the enrichment of a new RFP+ GFP+ population, encircled by a red dotted line. The percentage of RFP+ GFP+ cells in the total population with and without fusogen across three replicates is shown in the bar graph. (D) Histograms representing GFP-FITC and RFP-PE signal intensity for untransfected cells that do not express a GFP or RFP fusion protein, genome-edited cells that express a GFP or RFP fusion protein, PEG-treated (fused) GFP+ RFP+ cells, and cells transfected to overexpress the GFP and RFP fusion proteins. Quantification of the mean fluorescence intensity for both GFP-FITC and RFP-PE across three replicates is shown in the bar graphs. (E) Kymographs of single CME events from three examples of clonally expanded dual-colored cells after fusion, and cells over-expressing clathrin-RFP and dynamin-GFP. Time is on the y-axis (2 minutes). (F) Bar graph plotting the ratio of persistent tracks to total tracks. Fused clones 1, 2 and 3 are normalized to the successively genome-edited control (n = 9, ***, P < 0.05, for Mann-Whitney test), and the dual transfection (CLTA-RFP and DNM2-GFP) is normalized to the transfection, successively genome-edited control (n = 15 for the control and n = 23 for the transfected, ****, P < 0.05, for Mann-Whitney test). The box plot shows the upper and lower quartiles with the median value displayed as a line. The white dots on top of each bar represent the mean ratio per experimental replicate.
Figure 2:
Figure 2:
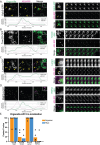
(A) Hi-Lo TIRF imaging of AP2-RFP; DNM2-GFP two-colored cell line co-cultured with AP2-RFP; ArpC3-HaloTag two-colored cell line (top). After treatment with PEG, cells express AP2-RFP, Dmn2-GFP, and ArpC3-HaloTag (bottom). Scale bar = 20 μm. (B) TIRF still image of CRISPR-Cas9 genome-edited cell line expressing fluorescent fusion proteins of three different colors (top), and a clonally expanded cell line generated from fusing two cell lines each expressing fusion proteins of two colors (bottom). Scale bar = 5 μm. (C) Kymographs showing the lifetime trace of a single CME event across a 5-minute movie. (D) Averaged intensity versus time plots of ArpC3-positive CME sites in genome-edited control cells and pooled fused clones. The lifetimes of the events plotted are between 20 and 180 seconds for 79.25% of the sites identified in the control and 88.72% of the sites identified in the fused clone. Events are aligned to the frames showing the maximum Dnm2 intensity (time = 0 sec). (E) Box and whisker plot comparing protein lifetimes for AP2, Dnm2, and ArpC3 in the genome-edited control cell line vs the fused, expanded iPSC clone cell line. The mean of each replicate is indicated by white circles. (F) Box and whisker plot comparing the fluorescent maximum intensity of AP2, Dnm2, and ArpC3 in the genome-edited control cell line and the fused, expanded iPSC cloned cell line. The mean of each replicate is indicated by white circles.
Figure 3:
Figure 3:
(A-D) Co-localization for ArpC3 and different organelle markers. Average intensity projection (z = 0.73 μm) from fixed samples. Yellow arrowheads indicate organelle co-localization with ArpC3 supported by Costes quantification. White arrowheads indicate observed co-localization that did not pass significant p-value using Costes quantification. Scale bar = 2 μm. Line scans (shown in the insets with dashed lines) were quantified and graphed (on the right). Merged colored montages from Hi-Lo TIRF movies are shown below, where each frame is 1 second for a total of 20 frames from a 2-minute movie. Scale bar = 2 μm. (E) Quantification of co-localization of ArpC3 with the different organelles for both fixed and live-cell imaging using Costes randomization.
Figure 4:
Figure 4:
(A-D) Co-localization for AP2 and the different organelle markers. Average intensity projection (z = 0.73 μm) from fixed samples. Yellow arrowheads indicate organelle co-localization with AP2 supported by Costes quantification. White arrowheads indicate observed co-localization. Scale bar = 2 μm. Line scans (shown in the insets with dashed lines) were quantified and graphed (on the right). Merged colored montages from Hi-Lo TIRF movies are shown below, where each frame is 1 second for a total of 20 frames from a 2-minute movie. Scale bar = 2 μm. (E) Quantification of co-localization of AP2 with the different organelles for both fixed and live-cell imaging using Costes randomization.
Figure 5:
Figure 5:
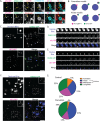
Image analysis of interactions between AP2, actin, and endolysosomal organelles. (A) Single z-slice (146 nm slice thickness) of fixed genome-edited hiPSCs expressing AP2-RFP and Dnm2-GFP stained with anti-clathrin Heavy Chain and anti-TMEM192 lysosomal protein (top row) to demonstrate co-localization of CME proteins with the lysosome (yellow-arrowheads), and phalloidin and TMEM192 (bottom row) to demonstrate co-localization of CME proteins, actin, and the lysosome (yellow-arrowheads). Scale bar = 2 μm. (B) Schematic modeling of two possible types of events involving CME proteins on the lysosome surface. (C) Single z-slice (0.4 μm) from live-cell image of genome-edited hiPSCs expressing AP2-RFP and Dnm2-GFP and incubated with 10 kDa Dextran-Cascade Blue. The inset shows a single lysosome with both AP2 and DNM2 puncta. Scale bar = 5 μm. (D) Montage of CME-like event on the lysosome surface imaged at 1 frame/3 seconds. (E) Montage of a likely pre-formed “visitor” arriving at the lysosome surface. (F) Single z-slice (0.4 μm) from live cell image of hiPSCs after 8 hours of starvation. The inset shows multiple lysosomes with AP2 and Dnm2 puncta. Scale bar = 5 μm (G) Quantitative comparison of control vs starved hiPSCs, counting how many of each type of event was observed. Thirty-six events were observed under control conditions, and 49 events were observed under starved conditions.

Similar articles

References

    1. Agoglia R. M., Sun D., Birey F., Yoon S.-J., Miura Y., Sabatini K., Pașca S. P., & Fraser H. B. (2021). Primate cell fusion disentangles gene regulatory divergence in neurodevelopment. Nature, 592(7854), 421–427. 10.1038/s41586-021-03343-3 - DOI - PMC - PubMed
    1. Aguet F., Antonescu C. N., Mettlen M., Schmid S. L., & Danuser G. (2013). Advances in Analysis of Low Signal-to-Noise Images Link Dynamin and AP2 to the Functions of an Endocytic Checkpoint. Developmental Cell, 26(3), 279–291. 10.1016/j.devcel.2013.06.019 - DOI - PMC - PubMed
    1. Avinoam O., Schorb M., Beese C. J., Briggs J. A. G., & Kaksonen M. (2015). Endocytic sites mature by continuous bending and remodeling of the clathrin coat. Science, 348(6241), 1369–1372. 10.1126/science.aaa9555 - DOI - PubMed
    1. Bolte S., & Cordelières F. P. (2006). A guided tour into subcellular colocalization analysis in light microscopy. Journal of Microscopy, 224(3), 213–232. 10.1111/j.1365-2818.2006.01706.x - DOI - PubMed
    1. Brodsky F. M. (2016). Clathrin and Clathrin-Dependent Endocytosis. In Encyclopedia of Cell Biology (pp. 384–393). Elsevier. 10.1016/B978-0-12-394447-4.20038-2 - DOI

Publication types

LinkOut - more resources