[Preprint]. 2025 Jun 18:2025.06.17.659820.
doi: 10.1101/2025.06.17.659820.

Population-specific brain charts reveal Chinese-Western differences in neurodevelopmental trajectories

Lianglong Sun  1   2   3 Wen Qin  4 Xinyuan Liang  1   2   3 Caihong Wang  5   6 Weiwei Men  7   8 Yunyun Duan  9 Xue-Ru Fan  1 Qing Cai  10 Shijun Qiu  11   12 Meiyun Wang  13 Qiyong Gong  14   15   16 Yanghua Tian  17   18   19 Peipeng Liang  20 Zeyu Liu  21 Xiaochu Zhang  22 Hongwen Song  22 Zhaoxiang Ye  23   24 Peng Zhang  23   24 Qi Dong  1 Sha Tao  1 Wenzhen Zhu  25 Jintao Zhang  1   3 Fang Xie  26 Jianfeng Feng  27   28   29 Jing Zhang  30 Chao Liu  1   3   31 Qiujin Qian  32   33   34   35 Bing Zhang  36   37   38   39 Ming Meng  40   41   42   43   44 Li Hu  45   46 Jia-Hong Gao  7 Tianzi Jiang  47 Xiongzhao Zhu  48 Yuhan Zhang  1 Liping Liu  49 Hanjun Liu  50 Weihua Liao  51   52 Dawei Wang  53   54   55   56 Huali Wang  34   35   57   58 Tengfei Guo  59 Zhengjia Dai  60 Su Lui  61 Kai Xu  62 Lingjiang Li  63   64 Peng Xie  65   66 Chunliang Feng  40   41   42   43   44 Guangbin Cui  67 Jinsong Wu  68   69   70 Xuntao Yin  71 Guosheng Ding  1   3 Junfang Xian  72 Lianping Zhao  73 Jie Lu  74 Zhifen Liu  75 Ying Han  76 Zhen Yuan  77 Xilin Zhang  40   41   42   43   44 Tianmei Si  32   33   34   35 Fuqing Zhou  78 Yanchao Bi  1   3   79   80   81   82 Dan Wu  83 Fei Gao  84 Fei Wang  85 Shaozheng Qin  1   86 Gang Wang  87 Feng Chen  88 Zhiqiang Zhang  89   90 Jing Sui  1   3 Huafu Chen  91 Jinhua Cai  92 Shuwei Liu  93 Zuojun Geng  94 Chen Zhang  95 Ning Mao  96   97   98 Hong Yin  99 Bo Liu  100 Heng Ma  96 Bo Gao  101 Yanwei Miao  102 Xiang-Zhen Kong  103   104   105 Yuan Zhou  45   46 Li Liu  1   3 Jianping Hu  106 Liang Wang  45   46 Quan Zhang  107 Hua Shu  1   108 Peijun Wang  109   110 Tatia M C Lee  111 Qingjiu Cao  32   33   34   35   112 Li Yang  32   33   34   35   112 Xi Zhang  113 Wenbo Luo  114   115 Meng Liang  4 Hongxiang Yao  116 Meng Li  117 Hao Huang  118   119 Yun Peng  120 Zaizhu Han  1   108 Chao Zhou  121 Haibo Xu  122 Ming Feng  123 Wen Shen  124 Yuzheng Hu  125 Huajun Chen  126 Ying Wang  127 Gaolang Gong  1   2   3   86 Zhihan Yan  128 Xiaojun Xu  129 Jun Liu  130 Guangxiang Chen  131 Pan Wang  132 Yunjun Yang  133 Dezhong Yao  134 Tong Han  135 Huiguang He  136 Ce Chen  137 Qihong Zou  7 Hesheng Liu  138 Hui Zhang  139 Chao Chai  124 Chunming Lu  1   3 Yiheng Tu  45   46 Yong Liu  140 Danhua Lin  141 Weihua Zhao  142 Xiufeng Xu  143 Xiaoli Liu  144 Zaixu Cui  86 Zheng Wang  145   146 Ruiwang Huang  40   41   42   43   44 Zhanjiang Li  147 Yunzhe Liu  1   3   86 Xiaojun Li  148 Xiujie Yang  108   149 Nan Zhang  150 Antao Chen  151 Bin Zhang  152 Pengmin Qin  40   43 Chen Liu  153 Zhenwei Yao  154 Yanjun Wei  155 Huishu Yuan  156 Feng Wang  157 Yu Zhang  158 Quan Zhang  159 Fang Hu  160 Huan Xie  161 Xuehai Wu  162 Jiaojian Wang  163 Guoguang Fan  164 Zhiqun Wang  165 Dongling Zhang  166 Hui Zhong  167 Yonggang Wang  168 Lijun Bai  169 Yongmei Li  170 Xinhua Wei  171 Jinhui Wang  172 Yi Zhang  173 Hongjian He  174 Shuyu Li  1 Tijiang Zhang  175 Fan Jiang  176   177   178 Jian Yang  179 Feiyan Chen  174 Feng Liu  4 Huaigui Liu  4 Nan Chen  180   181 Jinzhu Yang  182   183 Bo Hou  21 Chu-Chung Huang  10   184 Jiajia Zhu  185 Huanhuan Cai  185 Dongtao Wei  186   187 Qunlin Chen  186   187 Ying Wei  6 Peifang Miao  6 Yunxia Li  188   189 Yaou Liu  9 Ning Yang  1 Xiaoxue Gao  10 Yujie Liu  11 Yu Shen  13 Xiaoqi Huang  14   15   16 Gong-Jun Ji  19 Alzheimer’s Disease Neuroimaging Initiative, CHIMGEN Consortium, DIDA-MDD Working Group, MCADI, Chinese Lifespan Brain Mapping ConsortiumLongjiang Zhang  190 Jiang Qiu  186   187 Yongqiang Yu  185 Ching-Po Lin  191 Feng Feng  21 Kuncheng Li  180   181 Chunshui Yu  4 Yong He  1   2   3   86
Affiliations

Population-specific brain charts reveal Chinese-Western differences in neurodevelopmental trajectories

Lianglong Sun et al. bioRxiv. .

Abstract

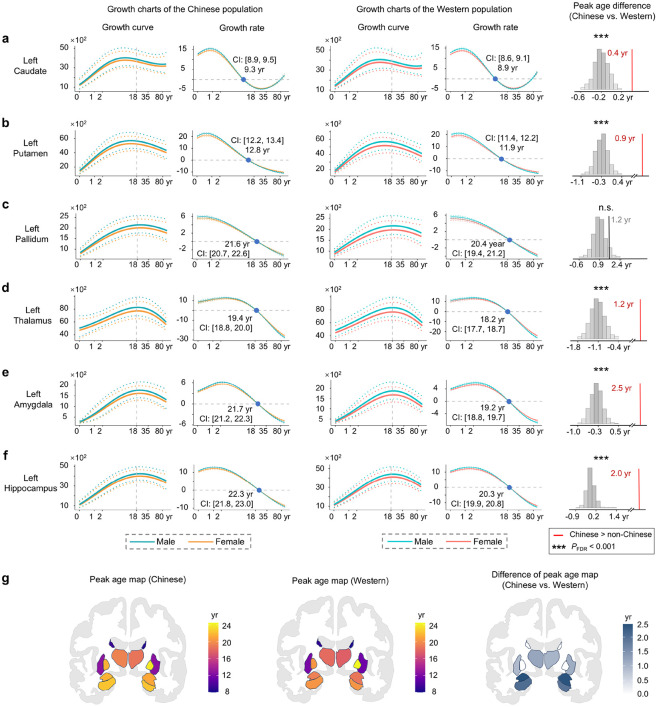
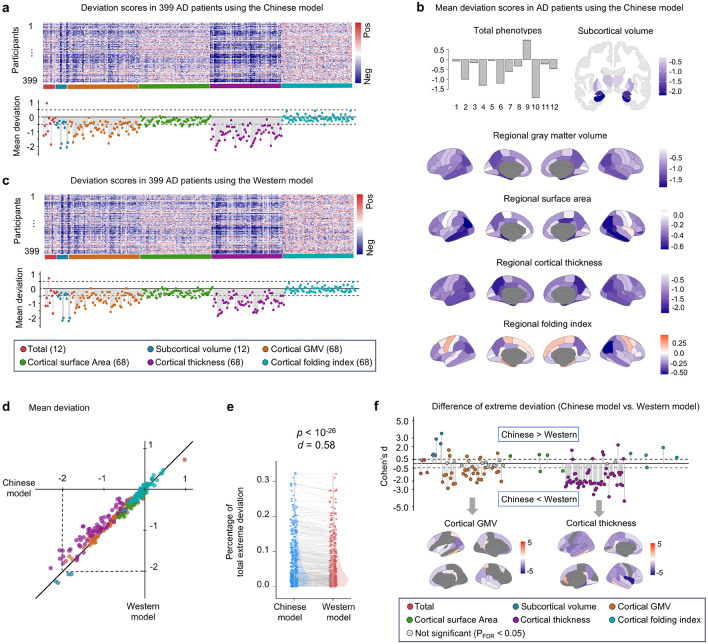
Human brain charts provide unprecedented opportunities for decoding neurodevelopmental milestones and establishing clinical benchmarks for precision brain medicine 1-7. However, current lifespan brain charts are primarily derived from European and North American cohorts, with Asian populations severely underrepresented. Here, we present the first population-specific brain charts for China, developed through the Chinese Lifespan Brain Mapping Consortium (Phase I) using neuroimaging data from 43,037 participants (aged 0-100 years) across 384 sites nationwide. We establish the lifespan normative trajectories for 296 structural brain phenotypes, encompassing global, subcortical, and cortical measures. Cross-population comparisons with Western brain charts (based on data from 56,339 participants aged 0-100 years) reveal distinct neurodevelopmental patterns in the Chinese population, including prolonged cortical and subcortical maturation, accelerated cerebellar growth, and earlier development of sensorimotor regions relative to paralimbic regions. Crucially, these Chinese-specific charts outperform Western-derived models in predicting healthy brain phenotypes and detecting pathological deviations in Chinese clinical cohorts. These findings highlight the urgent need for diverse, population-representative brain charts to advance equitable precision neuroscience and improve clinical validity across populations.

Keywords: Chinese population; MRI; brain chart; normative model.


Figures

Figure 1.
Figure 1.. Structural neuroimaging data of Chinese and Western populations.
a, Phase I dataset of the Chinese Lifespan Brain Mapping (C-LBM) Consortium, comprising neuroimaging data collected across 29 provinces in China. The right panel shows the number of participants and scanning sites within each province. b, Quality-controlled Chinese lifespan neuroimaging dataset derived from 384 scanning sites, comprising 43,037 healthy participants aged 0–100 years. c, Western neuroimaging data aggregated from eight countries: the United States, the United Kingdom, Canada, Ireland, the Netherlands, Belgium, Switzerland, and Australia. d, Quality-controlled Western lifespan neuroimaging dataset derived from 174 scanning sites, including 56,339 healthy participants aged 0–100 years. Box plots depict the age distribution of participants at each site. Boxes represent the interquartile range (25th–75th percentiles), with the median indicated by a horizontal line; whiskers extend to 1.5 times the interquartile range, and points beyond are plotted as outliers. e, Structural brain phenotypes used for normative model charts, including total brain phenotypes (n = 12), subcortical regional phenotypes (n = 12), and cortical regional phenotypes (n = 272). subs, subjects; yr, year.
Figure 2.
Figure 2.. Population-specific growth patterns of global brain phenotypes.
Growth patterns of the total intracranial volume (a), cerebral volume (b), cerebellar volume (c), cortical GMV (d), cerebellar GMV (e), subcortical GMV (f), cerebral WMV (g), cerebellar WMV (h), and ventricular volume (i). The panels showed the normative growth curves and growth rates across the lifespan for the Chinese and Western populations. In the growth curve plots, solid lines represent the median (50th percentile), and dotted lines indicate the 5th and 95th percentiles. Growth rates are calculated from the first derivative of the median curves, and 95% confidence intervals (dotted lines) are estimated via 1,000 bootstrap samples (see the Methods for details). Data distributions of these global phenotypes are shown in Supplementary Fig. 2a. The right panels depict differences in the peak age between Chinese and Western models. To quantify differences in the peak age, we performed permutation testing (1,000 iterations) on the pooled data from all Chinese and Western participants, generating a null distribution of peak age differences for each phenotype (see the Methods). GMV, grey matter volume; WMV, white matter volume; CI, confidence intervals; yr, year.
Figure 3.
Figure 3.. Population-specific growth patterns of subcortical regional phenotypes.
a, Growth patterns for the GMV of the caudate (a), putamen (b), pallidum (c), thalamus (d), amygdala (e), and hippocampus (f) in the left hemisphere. The panels show the normative growth curves and growth rates across the lifespan for the Chinese and Western populations. In the growth curve plots, solid lines represent the median (50th percentile), and dotted lines indicate the 5th and 95th percentiles. Growth rates are calculated from the first derivative of the median curves, and 95% confidence intervals (dotted lines) are estimated via 1,000 bootstrap samples (see the Methods for details). Data distributions of these subcortical phenotypes are shown in Supplementary Fig. 2b. The right panels depict differences in the peak age between Chinese and Western growth trajectories. To quantify differences in the peak age, we performed permutation testing (1,000 iterations) on the pooled data from all Chinese and Western participants, generating a null distribution of peak age differences for each phenotype (see the Methods for details). g, The peak age map of Chinese and Western populations, and the peak age difference map between these two populations. Corresponding results for the right hemisphere are shown in Supplementary Fig. 3. GMV, grey matter volume; CI, confidence intervals; yr, year.
Figure 4.
Figure 4.. Population-specific growth patterns of cortical regional phenotypes.
From top to bottom, the panels correspond to the regional cortical thickness (a), GMV (b), folding index (c), and surface area (d). This figure displays: (1) peak maturation ages across 68 cortical regions in Chinese- and Western-specific normative growth curves and their spatial correlations, and (2) regional differences in peak maturation timing between Chinese and Western populations. GMV, grey matter volume.
Figure 5.
Figure 5.. Evaluation of the out-of-sample predictive phenotypic accuracy of Chinese healthy individuals across normative models.
a, Framework for assessing the predictive accuracy (R2) via independent Chinese testing data. b, Age and sex distributions of the out-of-sample Chinese participants (testing set). c, Comparisons of the predictive accuracy between the Chinese and Western models across all 296 structural brain phenotypes. d, Percent improvement in the predictive accuracy of Chinese model than Western model. To avoid spurious values resulting from near-zero R2 values in certain phenotypes, improvement rates were computed only for phenotypes with R2>0.1. The numbers of phenotypes with R20.1 were 253 and 249 in the Chinese and Western models, respectively. The region numbers shown after each brain phenotype correspond to those in Fig. 1e. GMV, grey matter volume.
Figure 6.
Figure 6.. Misestimation of deviation scores in AD by the Western model relative to the Chinese model.
a, Top panel: Individual-level deviation z scores across 296 phenotypes for 399 AD patients, estimated using the Chinese normative model. Bottom panel: Mean deviation z scores for each phenotype across all AD patients. b, Visualization of the mean deviation scores for global, subcortical, and cortical regional phenotypes. The region numbers for the global brain phenotypes correspond to those shown in Fig. 1e. c, Corresponding results derived from the Western normative model. d, Scatter plot comparing the mean deviation scores between the Chinese and Western models across all phenotypes. e, The Chinese model identified a significantly greater proportion of extreme deviations (∣z∣ > 2.6) than did the Western model across AD patients. f, For phenotypes with ≥ 20 patients exhibiting extreme deviations in either model, we assessed whether the Western model systematically over- or underestimated the deviation scores. For the cortical GMV and cortical thickness, all group-level mean deviations were negative; thus, negative Cohen’s d values indicate underestimation of the extreme deviation magnitude, whereas positive values reflect overestimation. GMV, grey matter volume.

References

    1. Bethlehem R.A.I., et al. Brain charts for the human lifespan. Nature 604, 525–533 (2022). - PMC - PubMed
    1. Rutherford S. Charting brain growth and aging at high spatial precision. eLife 11, e72904 (2022). - PMC - PubMed
    1. Ge R., et al. Normative modelling of brain morphometry across the lifespan with CentileBrain: algorithm benchmarking and model optimisation. Lancet Digit Health 6, e211–e221 (2024). - PMC - PubMed
    1. Sun L., et al. Human lifespan changes in the brain’s functional connectome. Nat Neurosci 28, 891–901 (2025). - PubMed
    1. Rutherford S., et al. Evidence for embracing normative modeling. eLife 12, e85082 (2023). - PMC - PubMed

Publication types

LinkOut - more resources