[Preprint]. 2025 Jun 25:2025.06.25.661044.
doi: 10.1101/2025.06.25.661044.

Comprehensive investigation of SARS-CoV-2 intestinal pathogenesis in Drosophila

Affiliations

Comprehensive investigation of SARS-CoV-2 intestinal pathogenesis in Drosophila

Layla El Kamali et al. bioRxiv. .

Abstract

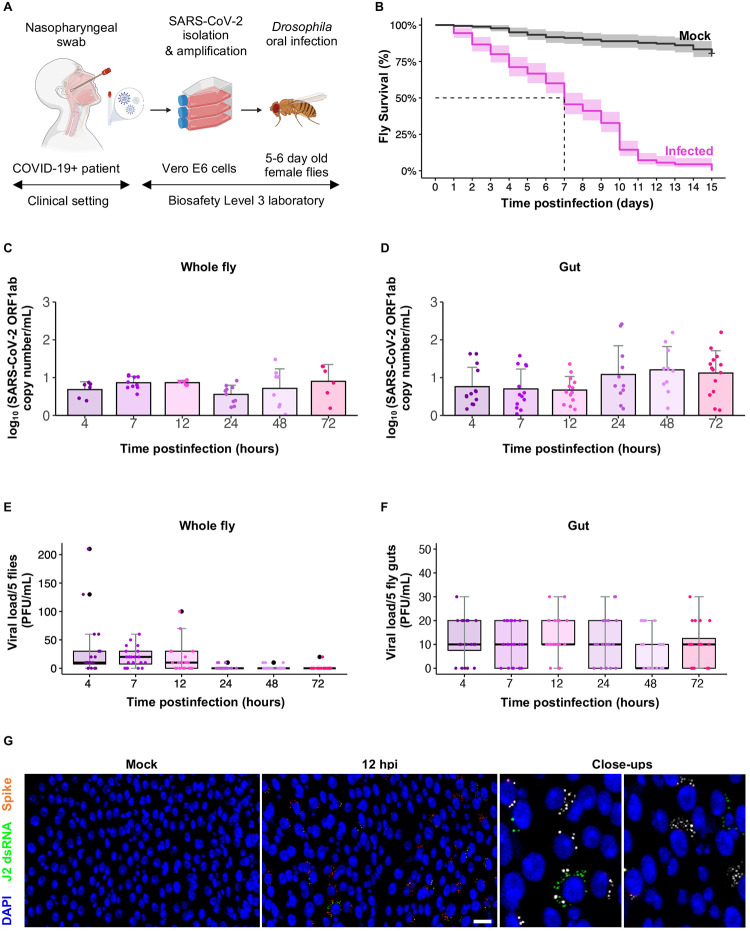
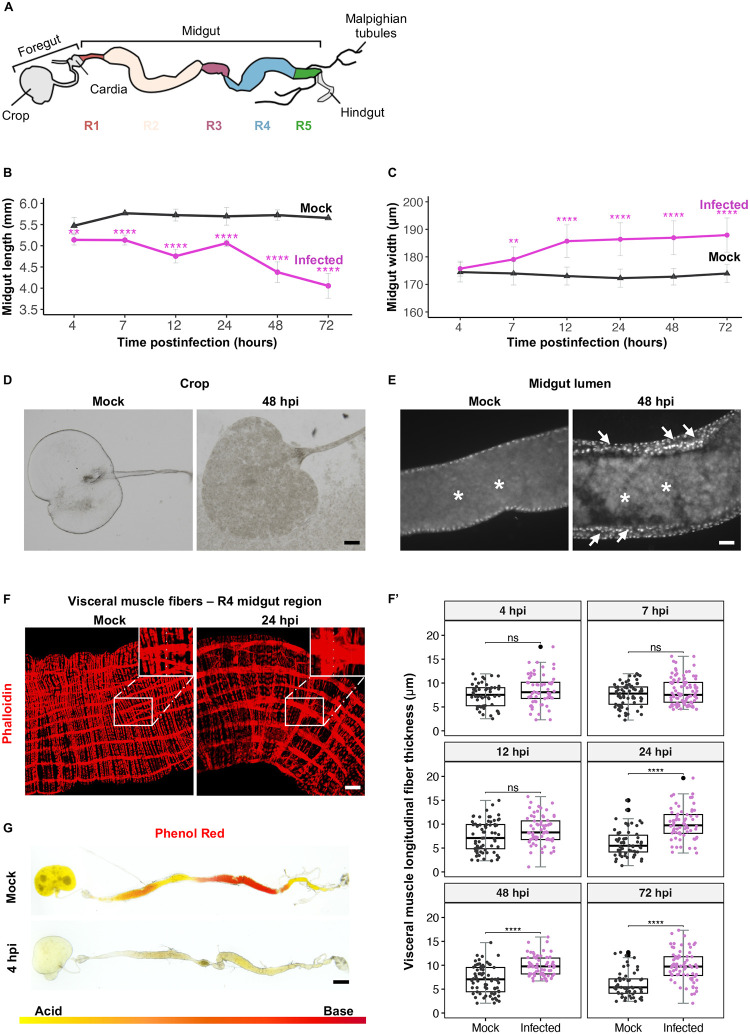
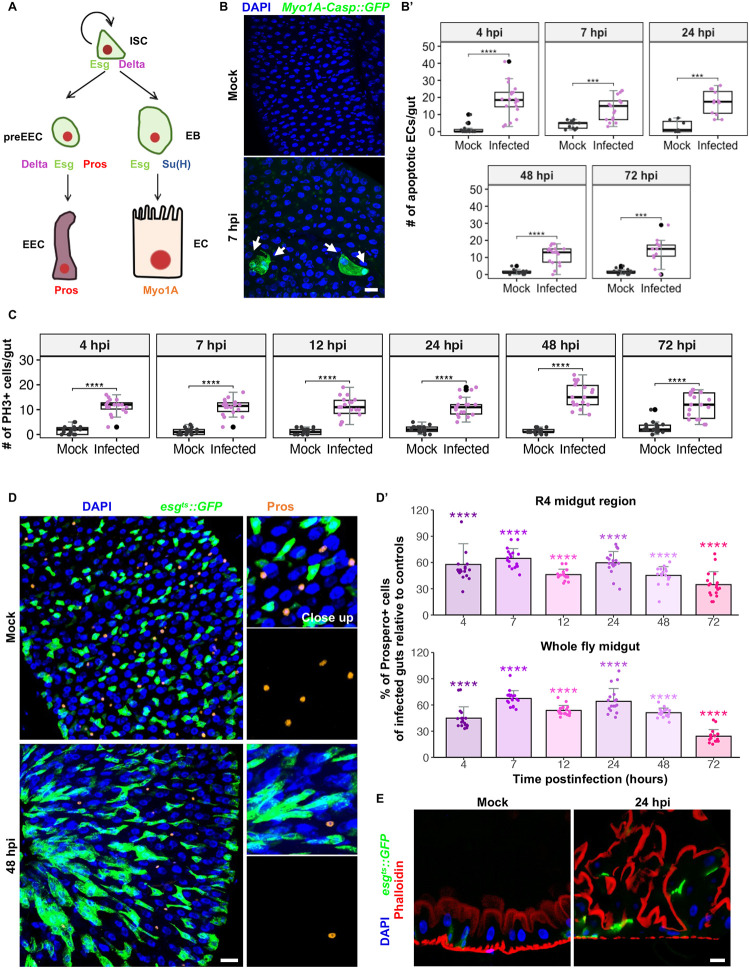
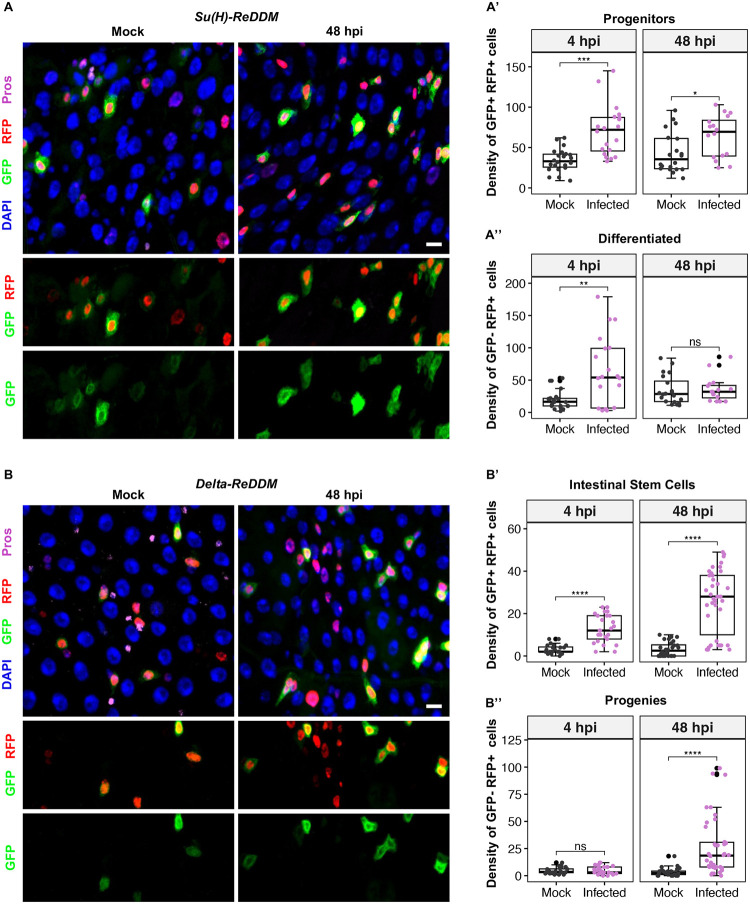
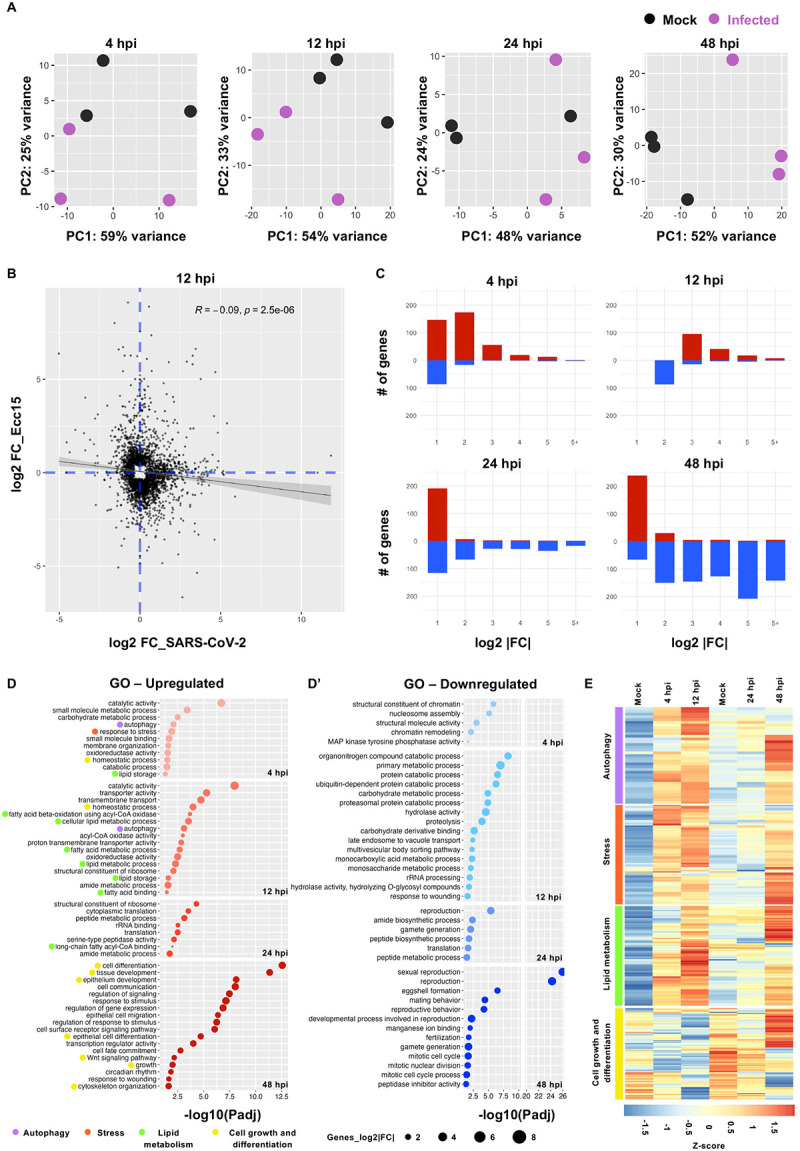
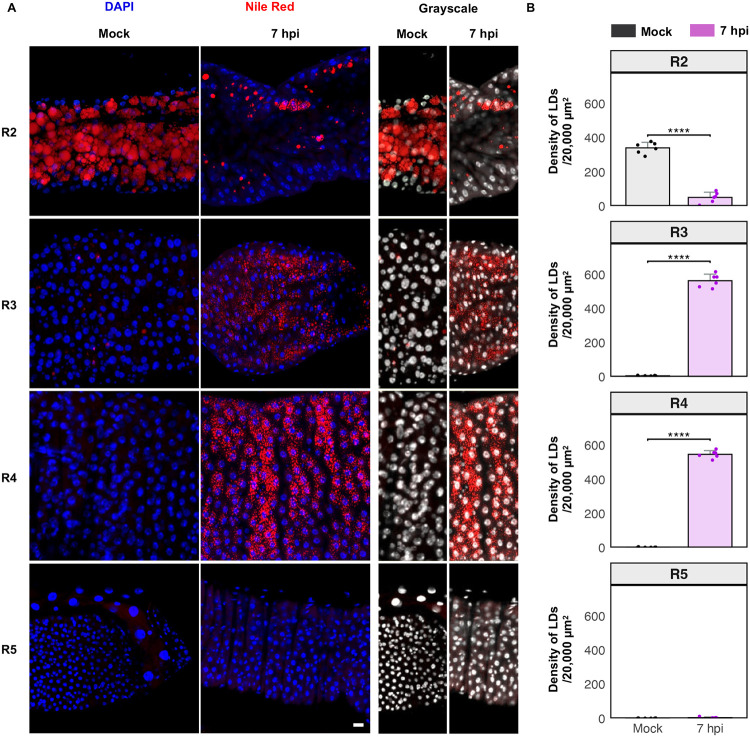
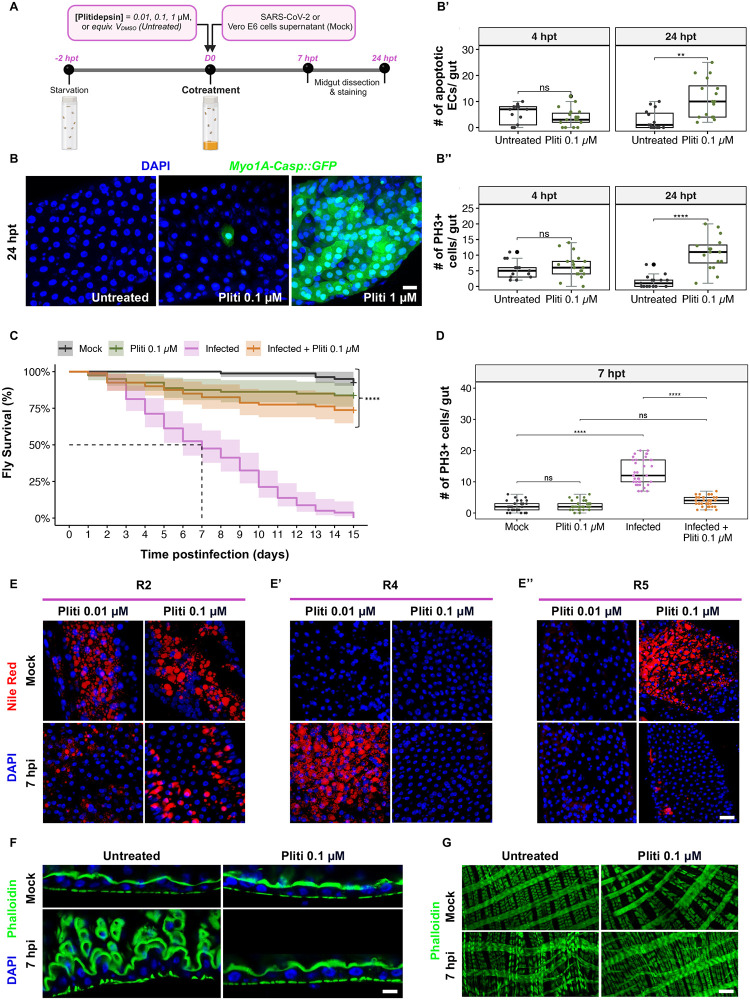
Gastrointestinal (GI) manifestations have been increasingly reported in COVID-19 patients. Here, we use the Drosophila melanogaster midgut model to investigate SARS-CoV-2-induced GI pathogenesis. The fly midgut exhibits susceptibility to orally administered virus, resulting in disrupted epithelial architecture, reduced organ size, and altered visceral muscle dynamics. These effects are accompanied by sustained proliferation of intestinal stem cells alongside decreased replenishment and viability of differentiated cells. Transcriptomic profiling reveals biphasic perturbations in midgut gene expression, particularly in pathways related to lipid metabolism. Intriguingly, SARS-CoV-2 elicits a dichotomous effect on lipid homeostasis, with lipid droplet accumulation in the posterior midgut and depletion in anterior segments. Treatment with Plitidepsin, a COVID-19 drug candidate, mitigates most SARS-CoV-2 pathogenic features in both the Drosophila midgut and human pulmonary cells, while modulating basal lipid droplet homeostasis in uninfected conditions. These findings establish the Drosophila midgut as a potent model for studying SARS-CoV-2 GI pathogenesis and evaluating antiviral compounds.

Keywords: Antivirals; Drosophila; Intestine; Lipid droplets; Plitidepsin; SARS-CoV-2.


Conflict of interest statement

Disclosure and competing interests statement The authors declare no competing interests.

Figures

Fig 1.
Fig 1.. Drosophila susceptibility and permissiveness to SARS-CoV-2 oral infection
(A) Study design: 5–6-day old female flies were orally administered a solution of SARS-CoV-2, obtained from a nasopharyngeal swab of a COVID-19 patient. The clinical strain was isolated and amplified on Vero E6 cells. Created with BioRender. (B) Kaplan-Meier survival curves comparing flies (w1118 genetic background) orally infected with SARS-CoV-2 to mock flies that ingested Vero E6 cell supernatants. Experiments represent three biological replicates, with 180 flies per condition in each replicate (total n= 540 flies per condition). Shaded areas represent the 95% confidence intervals (CI). Statistical significance was measured using the Log-rank test (p<0.01) for infected flies compared to mocks. (C) Longitudinal detection of SARS-CoV-2 genomic RNA using the Open Reading Frame 1ab (ORF1ab) RT-qPCR assay. Samples consisted of pools of 5 ground whole flies or guts (D). Three independent experiments were conducted with 4 samples each (n=12 samples/condition/timepoint). Histograms show means with error bars indicating standard deviation. Statistical analysis using one-way ANOVA revealed no significant differences in viral RNA levels over time. (E) Longitudinal quantification of infectious viral loads using plaque forming assay (PFU). Samples consisted of pools of 5 ground whole flies or guts (F). Three independent experiments were performed with 6 samples each (n=18 samples/condition/timepoint). Each dot represents values from one sample. (G) Representative images of a midgut confocal section dissected at 12 hpi, with its respective control. Midguts were stained with anti-SARS-CoV-2 spike antibody (red), anti-dsRNA J2 antibody (green), and DAPI (blue). Scale bar represents 50 μm. In the close-up views, Spike staining is shown in white to enhance contrast.
Fig 2.
Fig 2.. Effects of SARS-CoV-2 ingestion on midgut structure and pH in Drosophila
(A) Schematic representation of the adult Drosophila digestive tract. The midgut is subdivided into five functionally and morphologically distinct regions (R1-R5), each represented in a different color. (B and C) Measurements of gut length and width at different timepoints postinfection (n=18 midguts/condition/timepoint). Error bars indicate standard deviation. P-values correspond to the significant difference between conditions at the same time postinfection and were calculated using simple t-tests, corrected according to Bonferroni method. Significance levels are: ** P<0.01, **** P<0.0001. Absence of an asterisk indicates no significant difference (P≥0.05). (D) Representative images of crops from infected and mock flies at 48 hpi. Observations were performed across three independent experiments, with six crops analyzed per experiment (n = 18 crops per condition per time point). Scale bar represents 30 μm. (E) Images focusing on midgut lumens (R4 region; n=6, 3 replicates) of infected and mock flies. Guts were stained with DAPI at 48 hpi. Asterisks indicate the intestinal lumen, and arrows point to the thickened intestinal epithelium after infection. Scale bar represents 30 μm. (F) Longitudinal visceral muscle fibers (R4 region) of infected and mock flies, stained with Phalloidin (red) at 24 hpi. Scale bar represents 50 μm. (F’) Quantitative measurements of muscle fiber thickness across R4 region of dissected midguts at different times postinfection. Each dot represents measurements from a single longitudinal fiber. P-values are ns>0.05, **** <0.0001 calculated by Mann Whitney U test. (G) Full guts of wild type w1118 flies fed with either mock or viral solutions mixed with Phenol red dye at 4 hpi (n=6 per condition, 3 independent replicates). Yellow indicates acidic regions (pH≤6), orange is neutral (6<pH<8), and red is alkaline regions (pH>8). Scale bar represents 350 μm.
Fig 3.
Fig 3.. Disruptions in midgut cellular composition upon SARS-CoV-2 ingestion
(A) Schematic representation of the Drosophila adult intestinal stem cell lineage with cell specific markers. (B) Representative images of the R4 midgut region at 7 hpi showing Caspase 3 activity (GFP) driven by Myo1A-GAL4 in ECs, compared to its respective mock. Arrows point to apoptotic ECs. Scale bar represents 50 μm. Quantification of apoptotic ECs per midgut at different times postinfection is shown in (B’). (C) Quantification of mitotic ISCs (PH3-positive cells) per midgut at different times postinfection. (D) Representative images of the R4 midgut region at 48 hpi and its respective mock, showing ISCs and EBs (esgts::GFP, green), and preEE/EE cells (Pros, red). Scale bar represents 50 μm. Close-ups show merged and separate channels for Pros. (D’) Percentage of Prospero-positive cells in the R4 region and in whole infected guts relative to their controls. Histograms show means of the ratios, and error bars indicate standard deviation. (E) Confocal sections of esg-positive midguts expressing GFP in ISCs and EBs. F-actin in the brush border microvilli were stained using Phalloidin. Scale bar represents 30 μm. Data were collected from three independent replicates with 6 midguts each (n=18 midguts/condition/timepoint). In boxplots, each dot represents a count from one gut, large black dots mark outliers. P-values were calculated using simple t-tests corrected using the Bonferroni method. Statistical significance is indicated as *** P<0.001, **** P<0.0001. DAPI is blue.
Fig 4.
Fig 4.. Impact of SARS-CoV-2 infection on midgut cellular regeneration and differentiation
(A) Representative images of Su(H)-ReDDM at 48 hpi. (A’) Quantification of the density of progenitors (EBs = Su(H)+ = GFP+ RFP+ cells) and (A”) differentiated cells (ECs + EEs = RFP+ only cells). (B) Representative images of Delta-ReDDM at 48 hpi. (B’) Quantification of the density of intestinal stem cells (ISCs (+ preEEs) = delta+ = GFP+ RFP+ cells), and (B”) their progenies (ECs + EEs + EBs = RFP+ only cells). DAPI is blue, and the scale bar represents 20 μm. Images were acquired at 48 hpi using confocal microscopy. Quantification was done in a specific surface area of 20,000 μm2 of R4 at 4- and 48 hpi. Data were collected from three independent replicates with 6 midguts each (n=18 midguts/condition/timepoint). Each dot represents count from one midgut and large black dots mark outliers. P-values from the Mann Whitney U-test are ns>0.05, * <0.05, ** <0.01, *** <0.001, **** <0.0001.
Fig 5.
Fig 5.. Biphasic molecular response to SARS-CoV-2 oral infection revealed by midgut transcriptomic profiling
(A) Principal Component Analysis (PCA) of the transcriptomes of SARS-CoV-2 infected guts vs. mock at different times postinfection. Three independent replicates were considered per condition. (B) Scatterplot comparing the log2 fold change of differentially expressed genes (DEGs) following Erwina carotovora carotovora (Ecc15) oral infection (y axis) and SARS-CoV-2 oral infection (x axis) at 12 hpi. (C) Transcriptomic variation in guts at different times postinfection, showing the number of upregulated (red) and downregulated (blue) genes categorized by the level of log2 fold change (log2FC). Only significantly DEGs (p-value<0.05) are shown in this graph. (D) Gene ontology (GO) enrichment bubble plot of upregulated and (D’) downregulated genes grouped by time postinfection. (E) Clustering heatmaps of gene expression across different times postinfection compared to their respective controls. Genes were clustered based on their GO categories.
Fig 6.
Fig 6.. Region-specific disruptions in midgut lipid droplets homeostasis induced by SARS-CoV-2
(A) Representative images showing the distribution of lipid droplets in R2 to R5 regions of SARS-CoV-2 infected midguts at 7 hpi, using Nile Red staining. Comparisons are made to their respective mock samples. Nuclei are counterstained with DAPI (blue; white in grayscale panels) and scale bar represents 20 μm. A total of 20 midguts were scored for this experiment. (B) Density of lipid droplet particles in a 20,000 μm2 surface area of the R2-R5 midgut regions at 7hpi compared to mock midguts (n=6 per condition/region). Histograms show means and error bars indicate standard deviation. P-values were defined using individual t-tests and corrected using the Bonferroni method for multiple comparisons (ns P>0.05, and *** P<0.001).
Fig 7.
Fig 7.. Plitidepsin mitigates SARS-CoV-2 activity in the midgut
(A) Diagram summarizing the cotreatment procedure of flies with different doses of Plitidepsin and SARS-CoV-2. Created with BioRender. (B) Representative images of R4 midgut region, showing Caspase 3 activity (GFP) driven by Myo1A-GAL4 in ECs at 24 hours postingestion of 0.1 and 1 μM plitidepsin compared to untreated control. (B’) Quantification of apoptotic ECs (Myo1A-Casp::GFP), and (B”) mitotic ISCs (PH3-positive cells) in untreated guts or treated with 0.1 μM plitidepsin at 4 and 24 hours posttreatment. Data were collected from three independent replicates with 6 midguts each (n=18 midguts/condition/timepoint). P-values from one-way ANOVA are ns>0.05, ** <0.01, **** <0.0001. (C) Kaplan-Meier survival curves comparing flies (w1118 genetic background) orally infected with SARS-CoV-2 or cotreated with 0.1 μM Plitidepsin, to mock flies that ingested Vero E6 cell supernatants or received 0.1 μM Plitidepsin alone. Data represent three biological replicates (n=20 flies/condition/replicate). Shaded areas represent the 95% confidence intervals (CI). Statistical significance was measured using the Log-rank test (p<0.01). (D) Quantification of mitotic ISCs (PH3-positive cells) in infected gut with SARS-CoV-2 or cotreated with 0.1 μM Plitidepsin, compared to mock flies that ingested Vero E6 cell supernatants or received 0.1 μM Plitidepsin alone. Data were collected from three independent replicates, with 12 midguts analyzed per condition in each replicate (n=36 midguts per condition). Statistical significance was assessed using one-way ANOVA. P-values: ns>0.05, **** <0.0001. (E) Representative images showing the distribution of lipid droplets at 7hpi in the anterior R2, (E’) in the posterior R4 and (E”) R5 regions, stained with Nile Red (red), following cotreatment with 0.01 μM and 0.1 μM Plitidepsin. The corresponding untreated control midguts are shown in Figure 6. 20 midguts were scored for this experiment. (F) Representative confocal sections of midguts showing the brush border microvilli at 7hpi following cotreatment 0.1 μM Plitidepsin, compared to untreated guts (n=10/condition/3 biological replicates). F-actin is stained using Phalloidin (green). DAPI is blue. Scale bar represents 30 μm. (G) Visceral muscle fibers in R4 at 7hpi, stained with Phalloidin (green) following cotreatment with 0, or 0.1 μM of Plitidepsin, compared to noninfected guts (n=10/condition/3 biological replicates).

Similar articles

  • Measures implemented in the school setting to contain the COVID-19 pandemic.
    Krishnaratne S, Littlecott H, Sell K, Burns J, Rabe JE, Stratil JM, Litwin T, Kreutz C, Coenen M, Geffert K, Boger AH, Movsisyan A, Kratzer S, Klinger C, Wabnitz K, Strahwald B, Verboom B, Rehfuess E, Biallas RL, Jung-Sievers C, Voss S, Pfadenhauer LM. Krishnaratne S, et al. Cochrane Database Syst Rev. 2022 Jan 17;1(1):CD015029. doi: 10.1002/14651858.CD015029. Cochrane Database Syst Rev. 2022. Update in: Cochrane Database Syst Rev. 2024 May 2;5:CD015029. doi: 10.1002/14651858.CD015029.pub2. PMID: 35037252 Free PMC article. Updated.
  • SARS-CoV-2-neutralising monoclonal antibodies for treatment of COVID-19.
    Kreuzberger N, Hirsch C, Chai KL, Tomlinson E, Khosravi Z, Popp M, Neidhardt M, Piechotta V, Salomon S, Valk SJ, Monsef I, Schmaderer C, Wood EM, So-Osman C, Roberts DJ, McQuilten Z, Estcourt LJ, Skoetz N. Kreuzberger N, et al. Cochrane Database Syst Rev. 2021 Sep 2;9(9):CD013825. doi: 10.1002/14651858.CD013825.pub2. Cochrane Database Syst Rev. 2021. PMID: 34473343 Free PMC article.
  • Antibody tests for identification of current and past infection with SARS-CoV-2.
    Fox T, Geppert J, Dinnes J, Scandrett K, Bigio J, Sulis G, Hettiarachchi D, Mathangasinghe Y, Weeratunga P, Wickramasinghe D, Bergman H, Buckley BS, Probyn K, Sguassero Y, Davenport C, Cunningham J, Dittrich S, Emperador D, Hooft L, Leeflang MM, McInnes MD, Spijker R, Struyf T, Van den Bruel A, Verbakel JY, Takwoingi Y, Taylor-Phillips S, Deeks JJ; Cochrane COVID-19 Diagnostic Test Accuracy Group. Fox T, et al. Cochrane Database Syst Rev. 2022 Nov 17;11(11):CD013652. doi: 10.1002/14651858.CD013652.pub2. Cochrane Database Syst Rev. 2022. PMID: 36394900 Free PMC article.
  • Laboratory-based molecular test alternatives to RT-PCR for the diagnosis of SARS-CoV-2 infection.
    Arevalo-Rodriguez I, Mateos-Haro M, Dinnes J, Ciapponi A, Davenport C, Buitrago-Garcia D, Bennouna-Dalero T, Roqué-Figuls M, Van den Bruel A, von Eije KJ, Emperador D, Hooft L, Spijker R, Leeflang MM, Takwoingi Y, Deeks JJ. Arevalo-Rodriguez I, et al. Cochrane Database Syst Rev. 2024 Oct 14;10(10):CD015618. doi: 10.1002/14651858.CD015618. Cochrane Database Syst Rev. 2024. PMID: 39400904
  • Multidisciplinary collaborative guidance on the assessment and treatment of patients with Long COVID: A compendium statement.
    Cheng AL, Herman E, Abramoff B, Anderson JR, Azola A, Baratta JM, Bartels MN, Bhavaraju-Sanka R, Blitshteyn S, Fine JS, Fleming TK, Verduzco-Gutierrez M, Herrera JE, Karnik R, Kurylo M, Longo MT, McCauley MD, Melamed E, Miglis MG, Neal JD, Oleson CV, Putrino D, Rydberg L, Silver JK, Terzic CM, Whiteson JH, Niehaus WN. Cheng AL, et al. PM R. 2025 Jun;17(6):684-708. doi: 10.1002/pmrj.13397. Epub 2025 Apr 22. PM R. 2025. PMID: 40261198

References

    1. Ghai RR, Carpenter A, Liew AY, Martin KB, Herring MK, Gerber SI, et al. Animal Reservoirs and Hosts for Emerging Alphacoronaviruses and Betacoronaviruses. Emerg Infect Dis. 2021;27: 1015–1022. doi: 10.3201/eid2704.203945 - DOI - PMC - PubMed
    1. Woo PCY, Lau SKP, Lam CSF, Lau CCY, Tsang AKL, Lau JHN, et al. Discovery of Seven Novel Mammalian and Avian Coronaviruses in the Genus Deltacoronavirus Supports Bat Coronaviruses as the Gene Source of Alphacoronavirus and Betacoronavirus and Avian Coronaviruses as the Gene Source of Gammacoronavirus and Deltacoronavirus. J Virol. 2012;86: 3995–4008. doi: 10.1128/JVI.06540-11 - DOI - PMC - PubMed
    1. Alluwaimi AM, Alshubaith IH, Al-Ali AM, Abohelaika S. The Coronaviruses of Animals and Birds: Their Zoonosis, Vaccines, and Models for SARS-CoV and SARS-CoV2. Front Vet Sci. 2020;7: 582287. doi: 10.3389/fvets.2020.582287 - DOI - PMC - PubMed
    1. Zhou P, Yang X-L, Wang X-G, Hu B, Zhang L, Zhang W, et al. A pneumonia outbreak associated with a new coronavirus of probable bat origin. Nature. 2020;579: 270–273. doi: 10.1038/s41586-020-2012-7 - DOI - PMC - PubMed
    1. Gupta A, Madhavan MV, Sehgal K, Nair N, Mahajan S, Sehrawat TS, et al. Extrapulmonary manifestations of COVID-19. Nat Med. 2020;26: 1017–1032. doi: 10.1038/s41591-020-0968-3 - DOI - PMC - PubMed

Publication types

LinkOut - more resources