[Preprint]. 2025 Jun 22:2025.06.20.660633.
doi: 10.1101/2025.06.20.660633.

CDH1 loss remodels gene expression and lineage identity in human mammary epithelial cells

Affiliations

CDH1 loss remodels gene expression and lineage identity in human mammary epithelial cells

Maggie Musick et al. bioRxiv. .

Abstract

Invasive lobular carcinoma (ILC) is a common subtype of breast cancer that is defined in part by genetic loss of CDH1 caused by mutation or deletion, leading to loss of cell adhesion protein E-cadherin in >90% of ILC. Genetic loss of CDH1 is an early event in ILC oncogenesis, yet the mechanisms by which CDH1/E-cadherin acts as a tumor suppressor are not well understood. To study how early CDH1 loss drives ILC oncogenesis, we used a series of non-transformed human mammary epithelial cell (HMEC) models to target CDH1/E-cadherin, inhibiting extracellular E-cadherin signaling using antibodies versus modeling genetic CDH1 loss using siRNA or knockout via CRISPR/Cas9. Through transcriptome analyses across four HMEC models, we found that the mode of E-cadherin loss or suppression is critical for the subsequent phenotype. Antibody-mediated inhibition of cell-cell contacts induced gene signatures of epithelial-mesenchymal transition (EMT), consistent with the role of E-cadherin suppression during the EMT process. Conversely, genetic CDH1 loss - as in ILC oncogenesis - repressed EMT signatures, and instead remodeled gene expression toward a luminal epithelial phenotype. Using single cell transcriptomics and flow cytometry analyses of cell lineage markers, we found that genetic loss of CDH1 reprogrammed cells to a luminal progenitor-like phenotype. By isolating luminal versus basal cells prior to CDH1 knockout, we found that CDH1 loss led to remodeling of lineage identity in both populations, converging on a new lineage homeostasis with a luminal progenitor-like phenotype. Consistent with increased progenitor features, CDH1 loss enhanced proliferative capacity over the finite lifespan of the HMECs, highlighting a feature of early CDH1 loss that may contribute to clonal advantage during tumor initiation. Our findings support that inhibition of E-cadherin results in different transcriptional response compared to CDH1 loss, with the latter driving a transcriptional and phenotypic state characteristic of a luminal progenitor-like population, which offers new insight into early events in ILC oncogenesis.

Keywords: CDH1; E-cadherin; EMT; Invasive lobular carcinoma; breast cancer; etiology; mammary gland; oncogenesis.


Figures
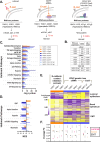
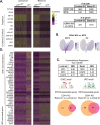
Figure 1.
Figure 1.. Genetic loss of E-cadherin represses EMT and shifts cells to a more luminal transcriptional state
(A) Workflow of RNA-seq using three methods of E-cadherin suppression; extracellular antibody inhibition (α-Ecad), siRNA transfection (siCDH1), and dox-inducible CRISPR/Cas9 (CDH1 KO). (B) Number of differentially expressed genes (DEG) and the adj. p value cutoff used to determine gene lists used for C-E. (C) Overrepresentation analysis of Hallmark pathways in all RNA-seq datasets (q value < 0.0001 across genetic loss model datasets. Color coded by contact inhibition (orange) vs. genetic loss of CDH1 (blue). (D) Fast gene set enrichment analysis (FGSEA) normalized enrichment scores (NES) of Hallmark pathways (q value < 0.05; *EMT in 240D1 q val=0.06) (E) Fold change of gene expression (p<0.05) between E-cadherin inhibition and genetic CDH1 loss within each cell line (HMEC 122D1, 153D1, 184D1, 240D1) in the EMT Hallmark, luminal epithelium, and basal epithelium gene signatures. (F) Average fold change of each gene signature from (E) across cell lines.
Figure 2.
Figure 2.. Single cell analysis supports CDH1 KO-induced reprogramming in luminal and basal cells
(A) HMEC 184D1 CDH1 KO g2 (CDH1 KO) and HMEC 184D1 NTG UMAP clustering based on sample type. ~17,000 cells per sample. (B) Cells characterized by cell cycle signatures; proportion of cells in each phase by sample type. (C) Using z scores of luminal and basal epithelium gene signatures and the AddModuleScore() function in Seurat, cells were classified as luminal (pink) or basal (orange); proportion of cells within each sample type. (D) Feature plots of representative luminal (SLPI, CD24, ALDH1A3, MUC1) and basal (ITGA6, VIM, SNAI2, TP63) markers. (E-G) The distribution of the normalized gene scores calculated using PIPseeker binning algorithm for both the luminal and basal gene signatures: (E) within all cells (F) luminal scores of the luminal and basal cells (G) basal scores of the luminal and basal cells. (H) FGSEA of the top 5 shared Hallmark pathways for luminal (CDH1 KO vs. NTG) and basal (CDH1 KO vs. NTG). (I) Proportion of cells in each cell cycle phase by cell type. −0.3>logFC >0.3, adj. p <1×10⁻¹⁰ (pathways p<0.05; except the luminal Estrogen Response Late p=0.055).
Figure 3.
Figure 3.. CDH1 KO induces reprogramming in luminal and basal cells toward a luminal progenitor-like state
(A) Differentially expressed genes of CDH1 KO vs. NTG cells within the luminal G1 and basal G1 populations relating to progenitor phenotype and cholesterol synthesis; tables on the right show the number of cells included in the analysis and the number of DGE for CDH1 KO vs. NTG within Luminal G1 and Basal G1 cells, respectively (adj. p <1×10⁻¹⁰, −0.3>FC>0.3). (B) Feature plots of two of the top 10 induced genes in CDH1 KO luminal G1 and basal G1cells: KRT16 and ID2 mapped onto original sc-RNAseq feature plot including all NTG vs. CDH1 KO cells (KRT16: avg. logFC= 1.79; pct.1=0.70; adj. p val = 0; ID2: avg. logFC= 2.03; pct.1=0.38; adj. p val = 0). (C) Motifs associated with the luminal G1 and basal G1 DGE using RCisTarget R package and the cisTarget database. Venn diagrams show the overlap of motif-associated genes between the luminal G1 and basal G1 CDH1 KO cells. The expression of overlapping genes are shown in A. (D) Differentially expressed genes of CDH1 KO vs. NTG cells within the luminal G1 and basal G1 populations relating to STAT2 and IRF3 associated genes.
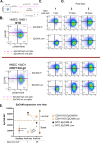
Figure 4.
Figure 4.. Cellular lineage markers support a CDH1 loss-induced luminal progenitor-like phenotype
(A) Representative plots of flow cytometry analysis of EpCAM/CD49f expression in 184D1 NTG vs. CDH1 KO. Gates were set to designate cell lineage: mature luminal (EpCAMhi CD49flow), luminal progenitor (EpCAMhi CD49fhi), and basal (EpCAMlow CD49fhi). Percentages of cells in each lineage are noted in each quadrant. (B) Changes in cell populations were measured by calculating fold change of the mean fluorescent intensity (MFI) of EpCAM within each quadrant (n=8; n=4 CDH1 KO g1; n=4 CDH1 KO g2. (C) Representative histograms show the changes in CD10 expression within the basal and luminal cell populations defined by EpCAM expression; siNT/NTG (blue) and siCDH1/CDH1 KO (red). (D) Quantification of CD10 expression changes were measured by calculating fold change of CD10 MFI of siCDH1 vs. siNT (n =14; n= 5 siCDH1 184D1, n=3 siCDH1 122D1, n=2 siCDH1 240D1, n=4 siCDH1 153D1) or CDH1 KO vs. NTG (n=8; n=4 CDH1 KO g1; n=4 CDH1 KO g2).
Figure 5.
Figure 5.. CDH1 KO HMEC 184D1s increased proliferation over finite lifespan.
(A) Total population doublings over the lifespan of the HMEC 184D1 NTG, CDH1 KO g1, CDH1 KO g2, all +/− dox were calculated by counting cells at the beginning and end of every passage (further described in the methods). The + dox cells were treated from passage 14 through passage 17 with doxycycline (population doublings during this period were excluded from final analysis to remove impact of doxycycline on proliferation). (B) Post-induction proliferation rates were calculated using the following equation: Slope = Δ Population Doublings / 5 passages (17→22). Fold changes of slope using the NTG + dox slope as a reference are shown in the final column.
Figure 6.
Figure 6.. CDH1 KO induces lineage plasticity in luminal and basal cells
(A) Schematic of flow sorting followed by flow analyses before and after induction of CDH1 KO. Cells were sorted into two populations using EpCAM: EpCAM hi (luminal) and EpCAM low (basal) and were separately treated with doxycycline. (B) Flow sorting and subsequent flow analyses were conducted in two cell lines: HMEC 184D1 NTG and HMEC 184D1 CDH1 KO g2. Dashed lines show where sorting gates were set based off EpCAM expression. (C) 24 hours post sort (before induction of CDH1 KO) the efficiency of the sort was determined by cell distribution based on EpCAM/CD49f expression as described in Fig. 4A (n=1). (D) After CDH1 KO (14 days and 25 days post dox induction) flow analysis of cell distribution based on EpCAM/CD49f was determined (n=3; n=2). (E) EpCAM MFI within parental/pre-sorted population (baseline) and each sorted population before induction of CDH1 KO (post-sort) and after CDH1 KO (post KO). Baseline population error bars show quartile distribution of EpCAM MFI.

Similar articles

References

    1. Grabenstetter A., Mohanty A.S., Rana S., Zehir A., Brannon A.R., D’Alfonso T.M., DeLair D.F., Tan L.K., Ross D.S., E-cadherin immunohistochemical expression in invasive lobular carcinoma of the breast: correlation with morphology and CDH1 somatic alterations, Hum Pathol 102 (2020) 44–53. 10.1016/j.humpath.2020.06.002. - DOI - PMC - PubMed
    1. Mouabbi J.A., Hassan A., Lim B., Hortobagyi G.N., Tripathy D., Layman R.M., Invasive lobular carcinoma: an understudied emergent subtype of breast cancer, Breast Cancer Res Treat 193 (2022) 253–264. 10.1007/s10549-022-06572-w. - DOI - PubMed
    1. Arpino G., Bardou V.J., Clark G.M., Elledge R.M., Infiltrating lobular carcinoma of the breast: Tumor characteristics and clinical outcome, Breast Cancer Research 6 (2004). 10.1186/bcr767. - DOI - PMC - PubMed
    1. Mathew A., Rajagopal P.S., Villgran V., Sandhu G.S., Jankowitz R.C., Jacob M., Rosenzweig M., Oesterreich S., Brufsky A., Distinct Pattern of Metastases in Patients with Invasive Lobular Carcinoma of the Breast, Geburtshilfe Frauenheilkd 77 (2017) 660–666. 10.1055/s-0043-109374. - DOI - PMC - PubMed
    1. Vos C., Cleton-Jansen A., Berx G., de Leeuw W., ter Haar N., van Roy F., Cornelisse C., Peterse J., van de Vijver M., E-cadherin inactivation in lobular carcinoma in situ of the breast: an early event in tumorigenesis, 1997. - PMC - PubMed

Publication types

LinkOut - more resources