[Preprint]. 2025 Jun 25:2025.06.24.661386.
doi: 10.1101/2025.06.24.661386.

Multiple groups of neurons in the superior colliculus convert value signals into saccadic vigor

Affiliations

Multiple groups of neurons in the superior colliculus convert value signals into saccadic vigor

Atul Gopal et al. bioRxiv. .

Abstract

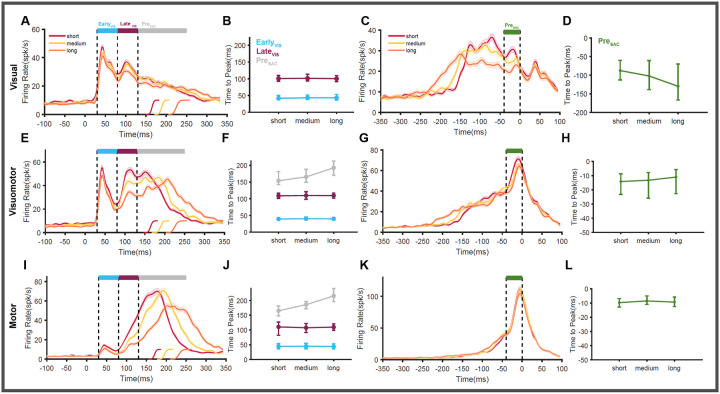
Eye movements directed to high-valued objects in the environment are executed with greater vigor. Superior Colliculus (SC) - a subcortical structure that controls eye movements - contains multiple subtypes of neurons that have distinct functional roles in generating saccades. How does value-related information processed in other parts of the brain affect the responses of these different subtypes of SC neurons to facilitate faster saccades? To test this, we recorded four subtypes of neurons simultaneously while the monkey made saccades to objects they had been extensively trained to associate with large or small rewards (i.e., good or bad). In three subtypes of neurons (visual, visuomotor, and motor), the good objects elicited more spikes than bad objects. More importantly, using a bootstrapping procedure, we identified three separable phases of activity: 1) early visual response (EVIS), 2) late visual response (LVIS), and 3) pre-saccadic (PreSAC) motor response in these neuronal subtypes. In each subtype of neurons, the value of objects (good vs. bad) was positively correlated with the activity in the LVIS and PreSAC phases but not the EVIS phase. These data suggest that the value information from other brain regions modulates the visual (LVIS) and the motor (PreSAC) responses of visual, visuomotor, and motor neurons. This enhanced activation facilitates the faster initiation and execution of the saccade based on the value of each object. In addition, we found a novel class of tonically active neurons that decrease their activity in response to object onset and remain inhibited till the end of the saccade. We suggest that these tonic neurons facilitate the saccade to objects by disinhibiting the interactions between the other three SC neurons.

Keywords: Peak Saccade Velocity; Reaction Time; Reward Modulation; Superior Colliculus; Value-based Behavior.


Conflict of interest statement

Disclosures No conflicts of interest, financial or otherwise, are declared by the authors.

Figures

Figure 1:
Figure 1:. Methods used in this study
(A) Progression of events in a single trial of the visually guided saccade task. (B) The four object sets (eight fractals in each) were used as stimuli in the task. In each set, four objects were associated with a larger volume of juice (good objects), and four objects were associated with a lower volume (bad objects). Animals learn the value of good and bad objects through repeated exposure to the task. (C) A sagittal section of the brain from monkey DWN, visualized by MRI, showing the location of the posterior recording chamber and grid. A recording track targeting the right hemisphere of SC is shown as a blue line. The different subtypes of SC neurons recorded simultaneously using a linear array during an example session are also shown as a schematic. (D) The neural activity aligned on target onset (left) and saccade onset (right) is shown for a representative neuron. The firing rates in these time intervals (colored patches) were quantified and used to classify the SC cells into different subtypes. (E) A map showing the potential anatomical locations of recordings in SC derived based on the receptive field of the recorded neurons over 33 separate sessions. Sessions recorded from monkey DWN are shown in grey squares and from monkey BLY in black circles.
Figure 2:
Figure 2:. Effect of reward on saccadic behavior
Saccadic behavior towards high-valued good (red) and low-valued bad (blue) objects is shown. (A) Average cumulative reaction time distributions of good and bad object trials from all the recording sessions are shown with the standard error of means as the colored envelope. (B) Average normalized velocity profiles of saccades directed to good and bad objects are shown with the standard error of means as the colored envelope. (C) Average normalized saccadic displacement profiles for good and bad trials are plotted separately. The mean RT (D), mean PV (E) and mean amplitude (F) calculated separately for good and bad objects in each session (connected by the light grey line) are shown to depict the variability in behvaior across different recording sessions. The data obtained from the two animals are shown separately using different symbols. Bar graphs denote the population mean calculated by averaging across all the 33 recorded sessions. (G) A scatterplot between the value modulation (difference between good and bad object trials) observed in RT and PV across all the recorded sessions. The data obtained from the two animals are shown separately using different symbols. (H). The extent of value modulation seen in RT (circle) and PV (square) across all the recorded sessions is plotted after sorting them in increasing order. The range of saccade amplitudes the animals made in different sessions of this experiment is shown as a colormap ranging from cool to warm colors. The sessions showing significant value modulation based on an unpaired t-test are shown as filled symbols.
Figure 3:
Figure 3:. Population response of SC neurons to reward modulation
The average SC population response aligned on stimulus onset when saccades were directed to the good objects (red) and bad objects (blue) in the RF is shown separately for visual (A), visuomotor (B), motor (C), and tonic (D) neurons. The population response of the SC neurons, when aligned on saccade onsets, is shown separately for visual (E), visuomotor (F), motor (G), and tonic (H) neurons. The firing rate calculated in the time intervals −300 to 0 (light blue) before the target onset, greater than 80ms (light green) aligned on the target onset, and −50 to 20ms aligned on the saccade onset (light violet) are shown as bar graphs separately for the good (red outline) and bad (blue outline) trials. The error bars denote the standard error of means. The firing rate is separately quantified for the visual (I), visuomotor (J), motor (K), and tonic (L) neurons. The piecharts below show the proportion of positively modulated (grey), negatively modulated (black), and non-modulated (white) neurons within the populations of visual (M), visuomotor (N), motor (O), and tonic (P) neurons. *** denotes p<0.001 ** denotes p<0.005 to p>0.001 and ns denote p>0.05.
Figure 4:
Figure 4:. Properties of tonic neurons.
The average response of SC tonic neurons when aligned on target onset (A) and saccade onset (B) is shown. (C) The mean firing rate from the population of tonic neurons in a 200 ms time interval before (white) and after (grey) target onset (left) and fixation onset (right) is shown as bar graphs. The error bars denote the standard error of means. (D) The eccentricity of the identified RFs of all the recorded tonic neurons (n=89) is shown. The green circles denote the tonic neurons, which had significant changes in activity in the 200 ms time interval before and after the onset of fixation.
Figure 5:
Figure 5:. Identifying different phases of SC neuronal response.
Simulated population activity of SC neurons generated by bootstrapping individual neuron responses separated by short (red), medium (yellow), and long (orange) RT trials are plotted. The activity is aligned on target onset and plotted separately for Visual (A), Visuomotor (E), and Motor (I) neurons. The vertical dashed lines denote the three phases of SC response: 1) early visual (EVIS) component (cyan) between 30–80ms, 2) late visual (LVIS) component (maroon) between 80–130ms, 3) tertiary pre-saccadic (PRESAC) component (grey) beyond 130ms. The saccade RTs of trials belonging to the short (red), medium (yellow), and long (orange) groups are shown separately at the bottom of the graphs. The average time at which firing activity peaked in each RT quantile is shown separately for the EVIS (cyan), LVIS (maroon), and PRESAC components (grey) for Visual (B), Visuomotor (F), and Motor (J) neurons. Simulated population activity of SC neurons is aligned on saccade onset and plotted separately for visual (C), visuomotor (G), and motor (K) neurons. The vertical dashed lines denote the pre-saccadic phase of SC response: −40 to 0ms (green). The average time at which firing activity peaked in the pre-saccadic phase for each RT quantile is shown separately for visual (D), visuomotor (H), and motor (L) neurons. The error bars denote the 95% confidence interval in the peak time measured across the 10000 bootstrapped repeats.
Figure 6:
Figure 6:. Effect of value on different phases of SC response.
Simulated mean responses of visual neurons to good (red) and bad (blue) objects in the RF generated by bootstrapping individual neuron responses separately for short (A), medium (C), and long (E) RT trials are plotted. The shaded envelopes denote the standard deviation in the spike density functions measured across the 10000 repeats of the simulations. The saccade RTs of good and bad object trials are shown separately at the bottom of the graphs. The vertical dashed lines denote the different epochs identified in the responses of each SC subtype. The line graphs plot the mean firing rate and the 95% confidence intervals for the good (red) and bad (blue) object responses during the EVIS (B), LVIS (D), and PRESAC (E) phases of the response. The value effect in each RT quantile (short, medium, long) is separately shown in each graph. Simulated population responses of visuomotor neurons (G-L) and motor neurons (M-R) generated by bootstrapping individual neuron responses separated by short (top), medium (middle), and long (bottom) RT trials are plotted. The rest of the convention is the same as in panels A-G.
Figure 7:
Figure 7:. Role of Tonic neurons in saccade generation.
Simulated population activity of tonic neurons generated by bootstrapping individual neuron responses separated by short (red), medium (yellow), and long (orange) RT trials are plotted aligned on target (A) and saccade (C) onset. The time at which the activity reached its minimum firing rate is calculated for each RT quantile and plotted when the activity is aligned on the target (B) and saccade onset (D). The error bars denote the 5% confidence interval in the minimum time calculated across the 10000 repeats of the simulations.
Figure 8:
Figure 8:. Relationship between reward and behavior modulation.
Scatterplot showing the relation between reaction time index (correlation between firing rate and reaction time) and reward modulation (the difference in firing rate between good and bad objects in the time interval 80–160ms). Relations are assessed separately for visual (A), visuomotor (C), motor (E), and tonic (G) neurons. Each circle represents a single SC neuron. The best-fit regression line (black dashed line) is shown with a negative slope in all cases. Filled circles denote the neurons that showed significant reward and RT modulation indices. Scatterplots of peak velocity index (correlation between firing rate and peak velocity) vs. reward modulation (the difference in firing rate between good and bad objects in the time interval 80–160ms) are shown for visual (B), visuomotor (D), motor (F), and tonic (H) neurons. The best-fit regression lines have positive slopes in all cases. Filled circles denote the neurons that showed significant reward and PV modulation indices.
Figure 9:
Figure 9:. Distribution of modulated SC neurons
(A) Cumulative plot showing the number of neurons that are modulated by reward from visual (grey), visuomotor (brown), motor (black), and tonic (yellow) neurons in SC. The reward modulation is assessed using AUROC. The neurons with AUROC values from 0 to 0.5 denote positively modulated cells, and those from 0.5 to 1 denote negatively modulated neurons. The total number of neurons from each SC subtype modulated by reward is also shown in their corresponding colors. (B) Cumulative plot showing the number of neurons that are modulated by RT from visual (grey), visuomotor (brown), motor (black), and tonic (yellow) neurons in SC. The RT modulation is quantified as the Pearson’s correlation between firing rates in the time interval 80–160ms and the corresponding trial RT. The neurons with RT indices ranging from −1 to 0 denote negatively modulated cells, and those from 0 to 1 denote positively modulated neurons. The total number of neurons from each SC subtype that are RT modulated is also shown in their corresponding colors. (C) Cumulative plot showing the number of neurons that are modulated by PV from visual (grey), visuomotor (brown), motor (black), and tonic (yellow) neurons in SC. The PV modulation is quantified as Pearson’s correlation between firing rates in the time interval 80–160ms and the PV of the corresponding trial. The neurons with PV indices ranging from −1 to 0 denote negatively modulated cells, and those from 0 to 1 denote positively modulated neurons. The total number of neurons from each SC subtype that are modulated by PV is also shown in their corresponding colors. Venn diagram showing the overlap between reward (pink), RT (green), and PV (blue) modulated neurons calculated separately for visual (D), visuomotor (E), motor (F), and tonic (G) neurons. The intersection area where all three circles meet denotes the neurons that are modulated by all three factors. The intersection area where two circles meet denote neurons that are modulated by reward/RT, reward/PV, and RT/PV. The area of the circle that does not intersect with the others denotes neurons modulated by only one factor. The number of neurons belonging to each of the above groups is also given.

Similar articles

References

    1. Amador N., Schlag-Rey M., & Schlag J. (2000). Reward-predicting and reward-detecting neuronal activity in the primate supplementary eye field. Journal of Neurophysiology, 84(4), 2166–2170. - PubMed
    1. Amita H., Kim H. F., Inoue K. I., Takada M., & Hikosaka O. (2020). Optogenetic manipulation of a value-coding pathway from the primate caudate tail facilitates saccadic gaze shift. Nature Communications, 11(1), 1876. - PMC - PubMed
    1. Bahill A. T., Clark M. R., & Stark L. (1975). The main sequence, a tool for studying human eye movements. Mathematical Biosciences, 24(3–4), 191–204.
    1. Basso M. A., Bickford M. E., & Cang J. (2021). Unraveling circuits of visual perception and cognition through the superior colliculus. Neuron, 109(6), 918–937. - PMC - PubMed
    1. Basso M. A., & May P. J. (2017). Circuits for Action and Cognition: A View from the Superior Colliculus. Annu Rev Vis Sci, 3, 197–226. - PMC - PubMed

Publication types