[Preprint]. 2025 Jun 17:2025.06.12.659348.
doi: 10.1101/2025.06.12.659348.

Spatially-distinct programming of macrophage diversity within the granulomas of Mycobacterium tuberculosis infected nonhuman primates

Affiliations

Spatially-distinct programming of macrophage diversity within the granulomas of Mycobacterium tuberculosis infected nonhuman primates

Davide Pisu et al. bioRxiv. .

Abstract

Tuberculosis (TB), caused by Mycobacterium tuberculosis (Mtb), is defined by granulomas-immune aggregates that either contain or support bacterial replication. Macrophages, fundamental components of these lesions, are crucial to TB pathogenesis, yet their phenotypic and functional diversity is incompletely understood. Here, we used single-cell RNA sequencing and immunofluorescence to profile macrophages in lung tissue and granulomas from a nonhuman primate model of early TB. We identified distinct subsets, including embryonic-origin tissue-resident alveolar macrophages and monocyte-derived alveolar and interstitial macrophages, with distinct spatial localization in granulomas. Tissue-resident alveolar macrophages and a subset undergoing epithelial-to-mesenchymal transition accounted for the highest frequency of Mtb-infected cells. Infected cells exhibited differential expression of immune- and migration-associated genes compared to uninfected counterparts, suggesting Mtb either induces or exploits these pathways as a survival strategy. These findings highlight macrophage heterogeneity as a major driver of differential susceptibility to Mtb and provide insights relevant to future immunomodulatory strategies.


Conflict of interest statement

Conflict of Interest: The authors declare no conflicts of interest in this work.

Figures
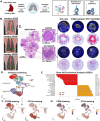
Figure 1.
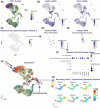
Figure 1.. NHP infection with mCherry-expressing Mtb leads to TB disease where macrophages can be interrogated by scRNAseq.
A. Schematic of the overall experimental design. NHPs were infected with mCherry-expressing Erdman-strain Mtb and the infection was confirmed using PET-CT scans. At necropsy, granulomas and non-diseased lung tissues were excised and frozen for multimodal scRNA sequencing, fluorescence microscopy, and flow cytometry for comparative analysis. B. 18F-FDG PET-CT imaging shows the development of TB-associated inflammation in the lower lung lobes of monkeys 30320, 30420, and 30520. Arrows and circles indicate the locations of granulomas. C. Diseased lung tissue from monkey 30520 shows numerous lesions, including caseous and non-caseous granulomas, with positive staining for CD3+ T cells, S100A9+ neutrophils, and CD11c+ macrophages (yellow) and DAPI-stained nuclei (blue). Immunofluorescence images for each marker (left) were used to identify the location of marker-positive cells (red) against a background of marker negative cells (gray). D. UMAP visualization of scRNA-seq data from 51,214 cells collected from both granuloma and non-diseased lung tissue. Cells are clustered in an unbiased manner based on their transcriptional profiles. E. GSEA of differentially expressed genes between AM and IM, using the hallmark gene sets (H:) from the Molecular Signatures Database of the Broad Institute. The figure displays the normalized enrichment scores (NESs) and false discovery rates (FDRs) for each gene set, highlighting the pathways that are most significantly enriched in AMs and IMs. F. Immunostaining of lung cells shows differential expression of CD206 and CD11b between AMs and IMs, corresponding to the ontologically and transcriptionally defined characterization of these macrophages. G. UMAP visualizations of cells stained for CD80 and CD1d, with normalized staining levels represented by a color gradient from black (low) to yellow (high).
Figure 2.
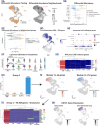
Figure 2.. Monocyte extravasation and differentiation in the Mtb-infected lung.
A. UMAP plot displaying CD14 antibody staining intensity across single cells, highlighting the lineage-specific staining pattern of CD14 within monocyte populations. B. UMAP plots showing log-normalized expression levels for the Mef2c (left) and Csf1r (right) genes across all cells. C. Visualization of scWGCNA-derived Module 5 (25 genes) expression levels mapped onto UMAP embeddings of all cells. This gene module is primarily expressed in blood and extravasating monocyte subpopulations. D. Differential expression of key markers, Clec9a and Cdh20, associated with blood presence and extravasation processes within the Early Monocyte subset. The UMAP plots spatially represent the early phases of monocyte differentiation, from their arrival into the lung to their extravasation into the tissue. F. DotPlot showing expression levels of key migration and cell adhesion genes across various macrophage populations. Dot size represents the percentage of cells expressing each gene, while color intensity indicates the average expression level. G. Trajectory and pseudotime analysis of macrophages visualized on the UMAP projection. The inferred differentiation trajectory is shown, with starting points (“roots,” white), terminal states (“leaves,” gray), and intermediate branching points (black) where the trajectory bifurcates. The numbers label each key point (roots, leaves, and branching points) and correspond to identifiers assigned by Monocle during trajectory reconstruction. H. Identification and analysis of gene expression modules around Branching Point 1, a critical juncture in the monocyte-to-macrophage differentiation process. The analysis focuses on cells clustered near this branching point, identifying gene modules with significant expression changes across the pseudotime axis. UMAP visualization displays these gene modules and provides insights into their spatial distribution at this transitional stage, with a color scale indicating the intensity of expression.
Figure 3.
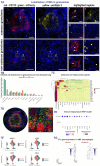
Figure 3.. MoAM subsets differ between granuloma and non-diseased lung.
A. CD206, CD163, and CD63 surface marker staining of moAM subsets within granuloma and non-diseased lung with moAM numbering (moAM_1, moAM_2, moAM_3) corresponding to the moAMs identified through UMAP-based clustering analysis in Figure 1D. Data are presented as violin plots overlaid with box plots. The center line of each box plot represents the median expression level of the marker, the box bounds represent the interquartile range (IQR) from the 25th to 75th percentile, and the whiskers extend to 1.5 times the IQR. Statistical significance was assessed using a two-sided Wilcoxon Rank-Sum Test to compare expression levels between ‘Granuloma’ and ‘Uninvolved’ cell types within each moAM subset. P-values were adjusted for multiple comparisons using the Benjamini-Hochberg procedure, with significance indicated by markers for extremely low adjusted p-values (**** = p.adj < 1e−50). B. UMAP visualizations of cells stained for CD86 and CD195 protein markers. Each plot uses a color gradient from dark blue (low expression) to dark red (high expression) to represent staining intensity across a spectrum of expression percentiles. C. UMAP plot illustrating staining levels for the CD163 marker, a hemoglobin scavenger receptor, across non-diseased lung tissue. The plot uses a color gradient from dark blue (low expression) to dark red (high expression) to represent staining intensity across a spectrum of expression percentiles. D. Representative visualization of IHC staining for surface markers CD206, CD163, and CD11b at the granuloma edge. The staining patterns reveal distinct spatial distributions: CD206+ CD163 and CD206+ CD163+ moAMs and TR-AMs predominate in areas adjacent to the granuloma, while CD163+ CD206 moAMs are primarily located in the inner core. Additionally, CD11b+ IMs are present within the core. Scale bar (left side bottom, vertical) = 100 μm.
Figure 4.
Figure 4.. MoAMs are transcriptionally and phenotypically distinct from TR-AMs.
A. Visualization of average expression levels of the scWGCNA-derived Module 3 (139 genes), specific to CD206+ CD163 moAMs, mapped onto UMAP embeddings from non-diseased cells. Scale bar = 50 μm. B. UMAP plot showing log-normalized expression levels of the Maf gene among non-diseased lung cells. C. DotPlot displaying expression levels of Maf-controlled genes across various macrophage clusters. Dot size represents the percentage of cells expressing each gene, while color intensity indicates the average expression level. D. Localization of cells expressing STARD13 and FOLR2 in a non-caseous (left) and caseous (right) granuloma. Each paired image includes the microscopy-based image (left half) and the plotted positions of the positive cells (red) against the total cell population (blue) (right half). Scale bar = 500 μm. E. UMAP plot showing log-normalized expression levels of the Folr2 gene across all cells. F. Visualization of average expression levels of the scWGCNA-derived Module 11 (869 genes), specific to CD206+ CD163+ TR-AMs, mapped onto UMAP embeddings from non-diseased cells.
Figure 5.
Figure 5.. Identification of pro-inflammatory AMs in Granulomas.
A. Differential abundance analysis of granuloma and uninvolved lung cells. (Left) UMAP visualization showing the distribution of cells from granuloma (blue) and uninvolved (yellow) lung tissue. (Right) Neighbors graph projected onto the UMAP plot, displaying cell cluster relationships based on differential abundance in granuloma and non-diseased lung populations. Neighbors with a significant Log2 Fold Change (LFC) increase in granuloma are shown in red, while those enriched in non-diseased lung are shown in blue (FDR < 0.1). B. Horizontal scatter plot showing changes in macrophage subset abundance, with color-coded data points indicating statistical significance and direction of change: Blue for neighbors with increased abundance in granuloma (FDR < 0.1), yellow for neighbors with higher abundance in uninvolved lung (FDR < 0.1), and light gray for no significant change. C. Horizontal scatter plot showing neighborhood (Nhood) clustering based on differential abundance, as calculated by changes in their LFC depletion rates. NhoodGroups are derived by aggregating neighbors (5A) that share similar transcriptional profiles and spatial proximity. NhoodGroups with increased abundance in granuloma are highlighted in blue, those with increased abundance in uninvolved lung are highlighted in yellow, and those with no significant change are shown in gray. D. Visualization of a granuloma-specific scWGCNA-derived module (146 genes) expression levels mapped onto UMAP embeddings. This module is specifically expressed by cells from NhoodGroup 6 and is exclusive to a subset of pro-inflammatory AMs in granuloma. E. DotPlot showing expression levels of lysosomal and cathepsin genes across various macrophage clusters. Dot size represents the percentage of cells expressing each gene, while color intensity indicates the average expression level. F. Violin plots showing the expression levels of lipid and cholesterol metabolism genes Apoc1 and Apoe across various macrophage subsets. Each violin plot displays the distribution of expression levels, with overlaid box plots representing the median (center line), interquartile range (IQR; box bounds), and whiskers extending to 1.5 times the IQR. Cliff’s Delta (C. Delta) values indicate the effect size. Statistical significance is denoted by asterisks (**** = p < 0.0001). G. Heatmap showing the expression levels of IFNγ and LPS-induced genes across various macrophage subsets. Gene expression levels are color-coded, with red indicating higher expression and blue indicating lower expression. Hierarchical clustering is applied to both genes and cell populations to reveal patterns of co-expression and group similarities. H. Bar plot showing the distribution of cell types within Neighborhood Group 3. The plot displays the percentage of total cells contributed by each cell type, with TR-AMs comprising the majority (97.6%) of the group. I. Visualization of scWGCNA-derived gene module expression levels mapped onto UMAP embeddings. (Left) Expression pattern of genes in Module 12 (49 genes). (Right) Expression pattern of genes in Module 13 (212 genes). J. Heatmap displaying the expression levels of genes from Module 12 in granuloma across various macrophage subsets. These genes are specifically expressed by TR-AMs from Neighborhood Group 3. Gene expression levels are color-coded, with red indicating higher expression and blue indicating lower expression. Hierarchical clustering is applied to both genes and cell populations to reveal patterns of co-expression and group similarities. K. UMAP visualization of Cd101 gene expression in granuloma (left) and non-diseased lung tissue (right). The expression levels are color-coded, with darker shades of blue indicating higher expression. The figure highlights the differential expression of Cd101 between granuloma and non-diseased lung cells, with prominent expression in TR-AMs from non-diseased lung.
Figure 6.
Figure 6.. Analysis of IMs from both granuloma and non-diseased lung.
A. Visualization of scWGCNA-derived gene module expression levels mapped onto UMAP embeddings across non-diseased lung cells. (Left) Expression pattern of genes in Module 6 (39 genes). (Right) Expression pattern of genes in Module 9 (60 genes). B. Heatmap displaying the expression levels of M1 genes from Modules 6 and 9 in non-diseased lung tissue across various macrophage subsets. Gene expression levels are color-coded, with red indicating higher expression and blue indicating lower expression. Hierarchical clustering is applied to both genes and cell populations to reveal patterns of co-expression and group similarities. C. Visualization of average expression levels of the scWGCNA-derived Module 6 (63 genes) in granuloma cells, mapped onto UMAP embeddings. D. Violin plots showing the expression levels of Irf1 and Irf8 in granuloma and non-diseased lung IMs. The expression levels are represented on the y-axis, with granuloma IMs shown in red and non-diseased lung IMs shown in blue. Each plot includes an overlaid box plot, where the center line indicates the median expression level, the box represents the interquartile range (IQR), and the whiskers extend to 1.5 times the IQR. Statistical significance between granuloma and non-diseased lung cells was assessed using a two-sided Wilcoxon Rank-Sum test, with p-values adjusted for multiple testing using the Benjamini-Hochberg method (p.adj). The adjusted p-values for the comparisons are displayed above each plot. E. Dot plot showing the expression levels of genes that are upregulated in IMs from granuloma compared to non-diseased (uninvolved) lung tissue. The size of the dots indicates the percentage of cells expressing each gene, while the color intensity represents the average expression level, with blue indicating upregulation. F. Localization of antigens that are strongly expressed by IMs (top row) and antigens expressed by both Ims and pro-inflammatory AMs (bottom row) in caseous granulomas. For each antigen, the panel on the left represents the microscopy image and the panel on the right is the plotted positions of antigen-positive cells (red) plotted against all of the nuclei for all of the cells in the image (blue). Scale bar = 500 μm.
Figure 7.
Figure 7.. Distribution of Mtb-infected cells and identification of EMT macrophages.
A. FFPE granulomas were stained for CD11c (red), mCherry (green), and perilipin-2 (plin-2, yellow) to visualize the presence of bacteria in the context of macrophages. Representative images of caseous and non-caseous granulomas are shown, with the position of Mtb in highlighted regions indicated by arrows. Enlarged views of the highlighted regions (labeled 1 and 2) show the presence of mCherry Mtb in necrotic (top) and non-necrotic (bottom) granulomas. Full granuloma scale bar = 500 μm, highlighted region scale bar = 50 μm. B. Bar plot showing the distribution of infected mCherry+cells across various cell types in granuloma and non-diseased lung tissue. The percentage of infected cells for each cell type, as a function of the total number of cells, is represented on the y-axis, with granuloma cells (green) and cells from non-diseased lung (orange). Cell subsets are listed along the x-axis with numbers above the bars indicating the raw count of infected cells recovered for each cell type within a category. C. Heatmap displaying the expression levels of adherens and tight junction genes across various cell types in granuloma and non-diseased lung tissue. Gene expression levels are color-coded according to the scale on the right, ranging from low (blue) to high (red). Hierarchical clustering is applied to both genes and cell populations to reveal patterns of co-expression and group similarities. D. Microscopy of IDO1 (red) and ITGB3 (green) expressing macrophages in the granuloma’s macrophage core. The highlighted region in the left panel is magnified in the right panel. Nuclei are stained with DAPI (blue). Inset scale bar = 50 μm. E. Dot plot showing the expression levels of immune response-related genes in the EMT macrophage cluster, comparing uninfected and infected cells. The size of the dots indicates the percentage of cells expressing each gene, while the color intensity represents the average expression level, with blue indicating higher expression and red indicating lower expression. F. Violin plots showing the expression levels of Apoc1, Apoe, Cd74, and Cd44 in EMT macrophages (EMT macs) and non-transformed cells from granuloma and uninvolved lung tissue. The expression levels are represented on the y-axis, with granuloma cells shown in red and uninvolved cells shown in green. Each plot includes an overlaid box plot, where the center line indicates the median expression level, the box represents the interquartile range (IQR), and the whiskers extend to 1.5 times the IQR. The plots highlight the loss of macrophage marker expression in EMT macs specifically within granuloma tissue, while non-transformed cells maintain expression of these markers. G. UMAP plots showing expression of the Ftl gene in the EMT macrophage cluster in infected and uninfected samples. The left panel represents infected cells, while the right panel represents uninfected cells. Expression levels are color-coded, with darker shades of blue indicating higher expression levels. The plots highlight differences in Ftl gene expression between infected and uninfected EMT macrophages.

References

    1. WHO. 2023. [cited 2024 April 22]; Available from: https://www.who.int/news-room/fact-sheets/detail/tuberculosis.
    1. Lin P.L., et al. Early events in Mycobacterium tuberculosis infection in cynomolgus macaques. Infect Immun, 2006. 74(7): p. 3790–803. - PMC - PubMed
    1. Sawyer A.J., et al. Spatial mapping reveals granuloma diversity and histopathological superstructure in human tuberculosis. Journal of Experimental Medicine, 2023. 220(6). - PMC - PubMed
    1. Wells G., et al. Micro–Computed Tomography Analysis of the Human Tuberculous Lung Reveals Remarkable Heterogeneity in Three-dimensional Granuloma Morphology. American Journal of Respiratory and Critical Care Medicine, 2021. 204(5): p. 583–595. - PMC - PubMed
    1. Mattila J.T., et al. Microenvironments in tuberculous granulomas are delineated by distinct populations of macrophage subsets and expression of nitric oxide synthase and arginase isoforms. J Immunol, 2013. 191(2): p. 773–84. - PMC - PubMed

Publication types

LinkOut - more resources