[Preprint]. 2025 Jun 17:2025.06.17.660164.
doi: 10.1101/2025.06.17.660164.

High throughput machine learning pipeline to characterize larval zebrafish motor behavior

Affiliations

High throughput machine learning pipeline to characterize larval zebrafish motor behavior

John Hageter et al. bioRxiv. .

Abstract

Using machine learning, we developed models that rigorously detect and classify larval zebrafish spontaneous and stimulus-evoked behaviors in various well plate formats. Zebrafish are an ideal model system for investigating the neural substrates underlying behavior due to their simple nervous system and well-documented responses to environmental stimuli. To track movement, we utilized an 8 key point pose estimation model, allowing precise capture of zebrafish kinematics. Using this kinematic data, we trained two random forest classifiers in a semi-supervised learning framework to classify various discreet behavioral outputs including stationary, scoot, turn, acoustic-startle like behavior, and visual-startle like behavior. The classifiers were trained on a manually labeled dataset, and their accuracy was validated showing high precision. To validate our machine learning models, we analyzed behavioral outputs during various stimulus evoked responses and during spontaneous behavior. For additional validation, and to show the utility of our recording and analysis pipeline, we investigated the locomotor effects of several established drugs with well-defined impacts on neurophysiology. Here we show that machine learning model development, enabled by semi-supervised learning developed classification models, provide detailed insights into the behavioral phenotypes of zebrafish, offering a powerful, high throughput method for studying neural control of behavior.

Keywords: behavior; high-throughput; kinematics; machine-learning; semi-supervised learning; zebrafish.


Conflict of interest statement

Conflicts of Interest The authors declare the following financial and personal relationships that may be considered as potential competing interests: J.E., V.S., M.W, and M.H. have a financial interest in Ramona Optics, Inc.

Figures

Figure 1
Figure 1. High throughput tracking of zebrafish kinematics.
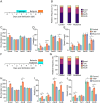
A. Representative labeling of 8 key point pose estimation of zebrafish along the body and representative traces for each key point over a 25 msec duration. Color indicates key point identifier. B. Key point tracking model error for both 24-well plate and 96-well plate tracking models. Each bar represents the average distance error for inferred key point locations compared to a manual label. Green dotted line indicates an error of 75 μm, magenta dotted line indicates an error of 125 μm, and the cyan dotted line indicates an error of 175μm. Color indicates key point location coinciding with the labels in (A). C. Representative tail angle calculation for a recording where a stimulus was applied. Color indicates angle. D. Depiction of acoustic stimulus tracking assay where larvae are recorded for 10 seconds and given at 0.1 second tap stimulus to the 4 corners of the well plate at 5 seconds. Image denotes a representative average projection of a larvae recorded during the onset of the tap stimulus. E. Average of the maximum absolute value of instantaneous heading change for among all individuals recorded in a 24-well plate (N=72). F. Bar chart representation of average maximum absolute value of heading change for given intervals 200 msec prior to and to the onset of the tap stimulus (purple, N=72), from the onset of the tap stimulus extending 200 msec (blue, N=72), and 200 to 400 msec after the onset of the tap stimulus (mint, N=72). G. Average absolute maximum caudal tail angle across the recording period. H. Same as in (F) for caudal tail angle. I. Average maximum speed for the same intervals as in (F, H). J. Depiction of recordings evoking a visual stimulus. Larvae were recorded for 6 repeats of 10 second recordings where environmental illumination was extinguished for 2 seconds halfway through the recording period. K-O. Same as in (E-I) for visual stimulus recordings (N=120). P. Depiction of spontaneous behavior recordings where individuals were recorded for one-minute intervals repeated 10 times for a total of 10 minutes of recording. Each recording was separated by 3 minutes. Q. Representative identification of bouts based on speed using a threshold of 5 mm/s (cyan) R. Representative instantaneous change in heading direction from the bouts classified in (Q). Average S. maximum speed or T. change in heading direction for all bouts classified using a threshold of 2 mm/s (N=120). U. Proportion of bouts able to be identified using the 2 mm/s threshold from Q-T. Error bars represent mean± SEM. * indicates p < 0.05
Figure 2
Figure 2. Supervised learning identifies and classifies unique types of motor behavior.
A. Depiction of egocentric alignment where from every timepoint a transformation is applied to the rest of the frames in the window. Initially larvae are rotated so their heading direction is facing north and the center is translated to become the origin image, then all key points are translated to the origin. B. This transformation is then applied to the subsequent 39 frames in the window for a 40-frame window. C. Representative identification of movement bouts detected from unsupervised clustering with K-means clustering (k=9). D-E. Confusion matrices for both 24-well plate configuration and 96-well plate configuration RFC models. Color indicates proportion of the classification type used for comparison in the confusion matrix. True indices are feature vectors from our manual segmentation of behavior while predicted are model classifications. Values indicate the proportion of behavior clips that were classified correctly compared to manual labelling. F-G. 2D UMAP of a subset of recording datasets with behaviors labeled in the classification of F. 24 well plate models and G. 96-well plate model. Percent responding trials based on the presence of at least one call made to acoustic or visual stimuli in either the 24-well or 96-well plate recordings.
Figure 3
Figure 3. Classified behaviors show different underlying kinematics.
A. Representative instantaneous heading change and speed for acoustically evoked behavioral recordings in the 24-well plate recording. Bar above heading change indicates the sequence of classified behaviors for each timepoint (black: stationary, dark purple: movement, orange: AsLB, yellow: VsLB). B. Average of the maximum absolute value of heading change across different classified behaviors within the stimulus window for acoustic startle from 5.0 to 5.25 seconds (Stationary: N=49m Scoot: N=28, Turn: N=70, AsLB: N=61, VsLB: N=42). C. Average maximum speed across different classified behaviors. D-E. Same as in (A-C) for visually evoked behaviors (Stationary: N=120, Scoot: N=103, Turn: N=57, AsLB, N=34, VsLB: N=115). The window used for E, F was from 5.0 to 6.0 seconds. G. Representative selection of 10 seconds of recording from a total 60 seconds of recording showing instantaneous changes in heading direction and speed. Bar above heading direction indicates the classified behavior for each timepoint (black: stationary, purple: scoot, maroon: turn, orange: AsLB, and yellow: VsLB). H. Relative proportion of classified behaviors excluding stationary behavior (Stationary: N=144, Scoot: N=138, Turn: N=136, AsLB: N=130, VsLB: N=136). I. average bout duration for each classified behavior type. J. Average maximum instantaneous speed across select bout types. K. Average magnitude of maximum instantaneous change in heading direction for select bout types. Error bars represent mean ± SEM. * indicates p < 0.05. Comparisons where * is not located means p < 0.05.
Figure 4
Figure 4. Neural activity modulators alter underlying behavioral kinematics.
A. Depiction of drug treatment paradigm. Larvae are treated for an hour prior to behavior testing where they are recorded for 6 repeat acquisitions while given either an acoustic tap stimulus or a visual light off for 2 seconds stimulus. Larvae remain in their respective pharmacologic for the duration of behavior testing. Dosages for each drug treatment and response rates across all recording trials for each drug in either an acoustic stimulus recording (green outline) or a visual stimulus recording (purple outline). B. Recordings are classified as responsive if they contain at least one call from their respective stimulus window (Acoustic = 5.00 – 5.25 seconds; Visual = 5.0–6.0 seconds). Light green indicated proportion of responsive trials while light blue indicates proportion of non-responsive trials in a 24 well plate. C-D. Average of the maximum absolute value of heading change or maximum instantaneous speed across behavior classifications and drug treatments for C. acoustic evoked behavior (green outline, Control: Scoot: N=65, Turn: N=123, AsLB: N=75, VsLB: N=54; 4-AP: Scoot: N=61, Turn: N=137, AsLB: N=83, VsLB: N=105; Muscimol: Scoot: N=57, Turn: N=129, AsLB: N=93, VsLB: N=58) or D. visually evoked behavior (purple outline, Control: Scoot: N=82, Turn: N=29, AsLB: N=42, VsLB: N=83; 4-AP: Scoot: N=82, Turn: N=40, AsLB: N=42, VsLB: N=83; Muscimol: Scoot: N=52, Turn: N=17, AsLB: N=22, VsLB: N=65). Error bars represent mean ± SEM. * indicates p < 0 05.
Figure 5
Figure 5. Neural activity modulators alter underlying kinematics of classified spontaneous behaviors.
A. Depiction of early drug treatments. Larvae are treated with either 4-AP, muscimol, or nothing from 2–4 dpf. They are then removed from the drug and behavior testing took place at 7 dpf. Larvae are tracked for 1–0 repeats of 1-minute recordings separated by 3 minutes. B. Relative proportion of classified behavior types excluding stationary classifications for control, 4-AP, and muscimol treated larvae. Color indicates behavioral classification (purple: scoot, maroon: turn, orange: AsLB, and yellow: VsLB). C-E. Bar graphs measuring average C. bout duration, D. average maximum absolute value of instantaneous heading direction, or E. maximum speed across select behavioral classifications and drugs (Green: control, Scoot: N=72, Turn: N=72, AsLB: N=69, VsLB: N=72, Orange: 4-AP, Scoot: N=72, Turn: N=72, AsLB: N=67, VsLB: N=71, Muscimol: blue, Scoot: N=71, Turn: N=71, AsLB: N=69, VsLB: N=69). F. Depiction of same day drug treatments. Larvae are treated with either 4-AP, muscimol, or nothing for an hour prior to behavior testing, then they remain in the drug for the duration of behavior testing. Larvae are tracked for 10 repeats of 1-minute recordings separated by 3 minutes. G-J Same as in B-E for larvae behavior tested while being treated (Control: Scoot: N=70, Turn: N=71, AsLB: N=69, VsLB: N=69; 4-AP: Scoot: N=72, Turn: N=72, AsLB: N=71, VsLB: N=71; Muscimol: Scoot: N=72, Turn: N=71, AsLB: N=65, VsLB: N=69).

Similar articles

References

    1. Yoshikawa S., Tang P. & Simpson J. H. Mechanosensory and command contributions to the Drosophila grooming sequence. Current Biology 34, 2066–2076.e3 (2024). - PMC - PubMed
    1. Ravbar P., Zhang N. & Simpson J. H. Behavioral evidence for nested central pattern generator control of Drosophila grooming. eLife 10, e71508. - PMC - PubMed
    1. Naghizadeh M., Mohajerani M. H. & Whishaw I. Q. Mouse Arm and hand movements in grooming are reaching movements: Evolution of reaching, handedness, and the thumbnail. Behavioural Brain Research 393, 112732 (2020). - PubMed
    1. Coleman R. T. et al. A modular circuit coordinates the diversification of courtship strategies. Nature 635, 142–150 (2024). - PMC - PubMed
    1. Kohatsu S. & Yamamoto D. Visually induced initiation of Drosophila innate courtship-like following pursuit is mediated by central excitatory state. Nat Commun 6, 6457 (2015). - PubMed

Publication types

LinkOut - more resources